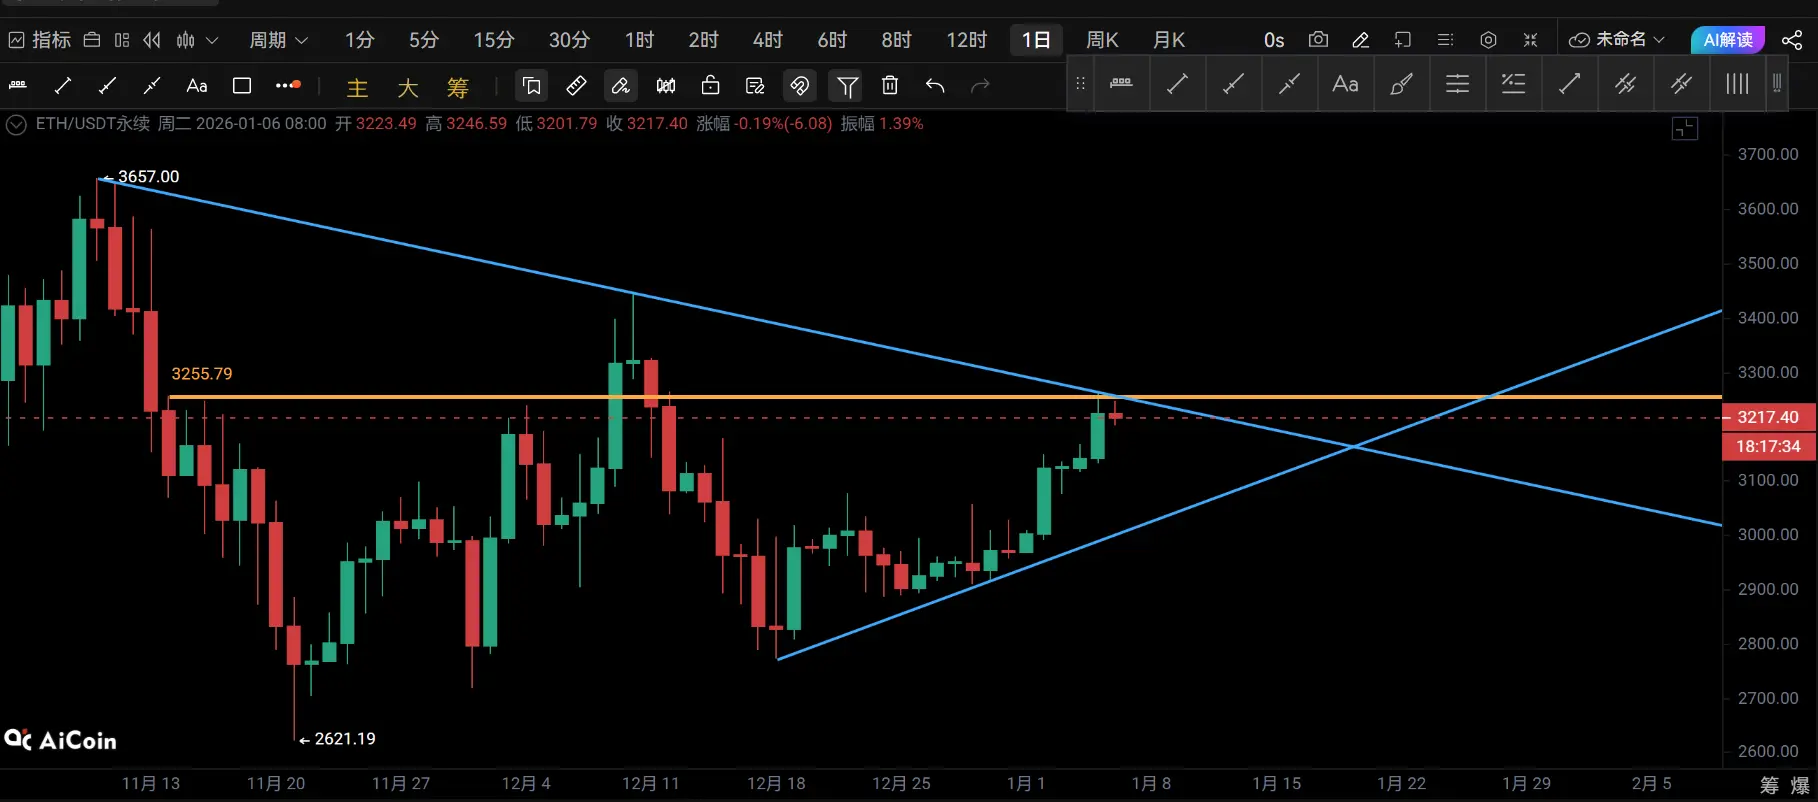
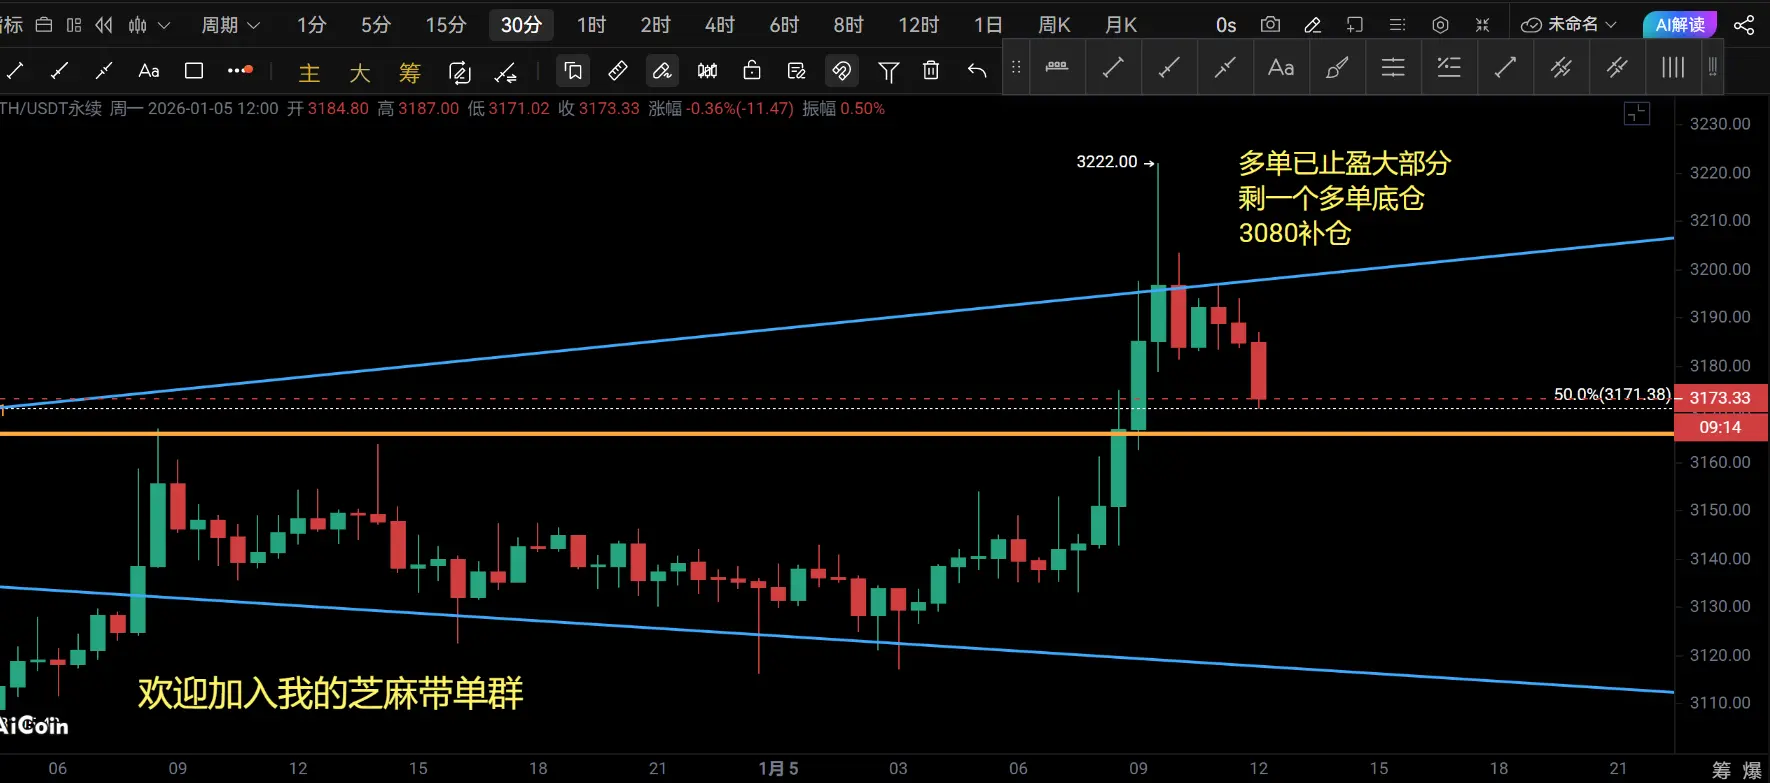
Daily Chart Analysis.
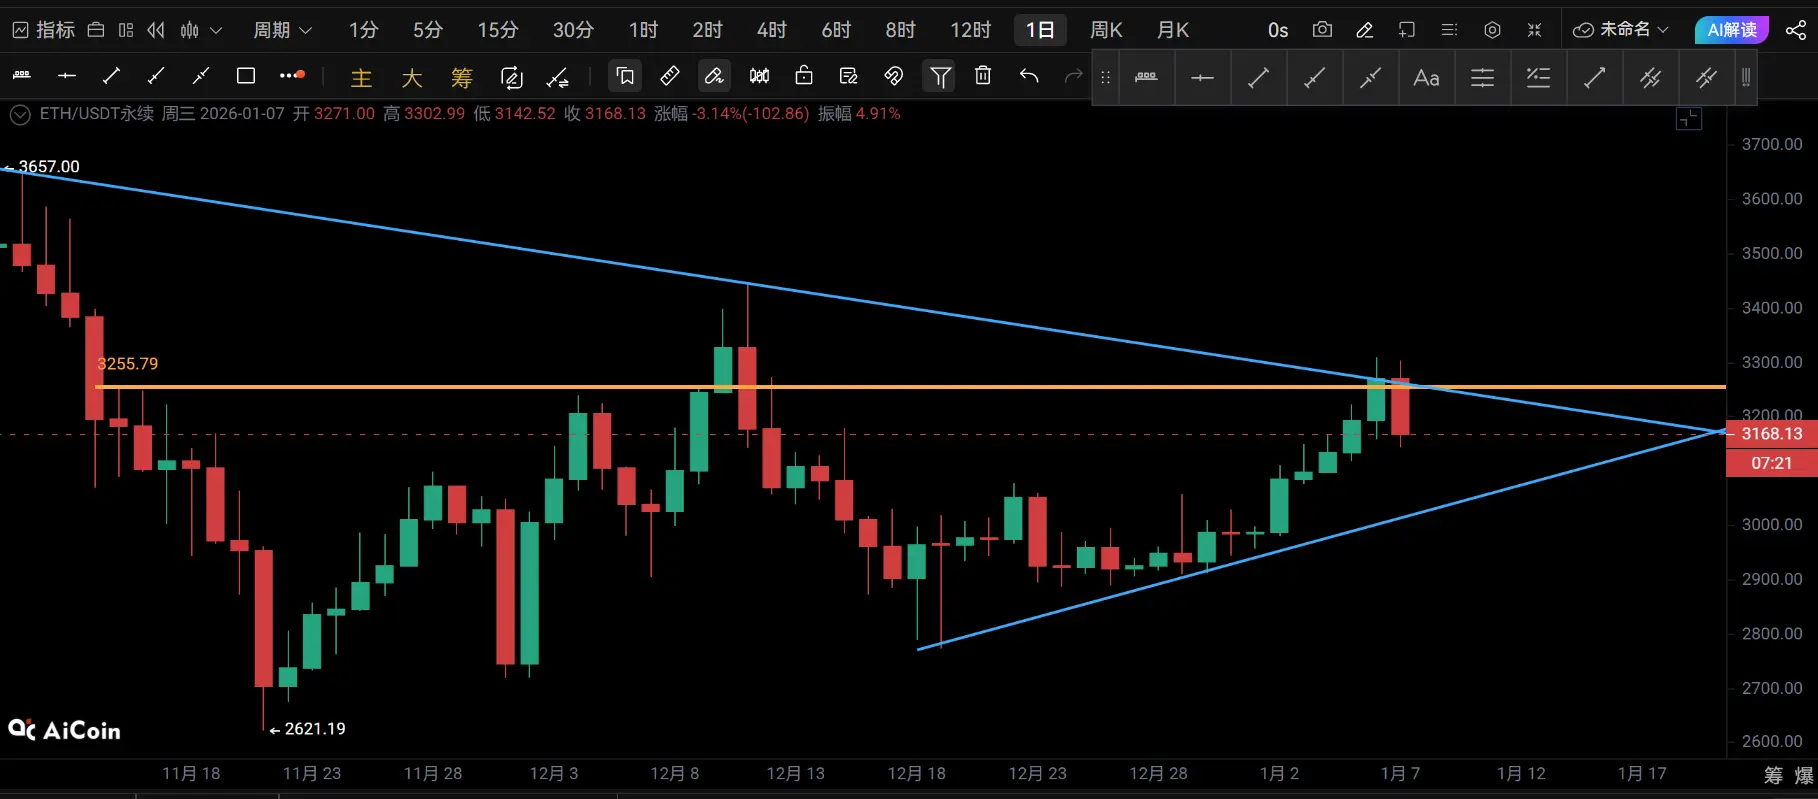
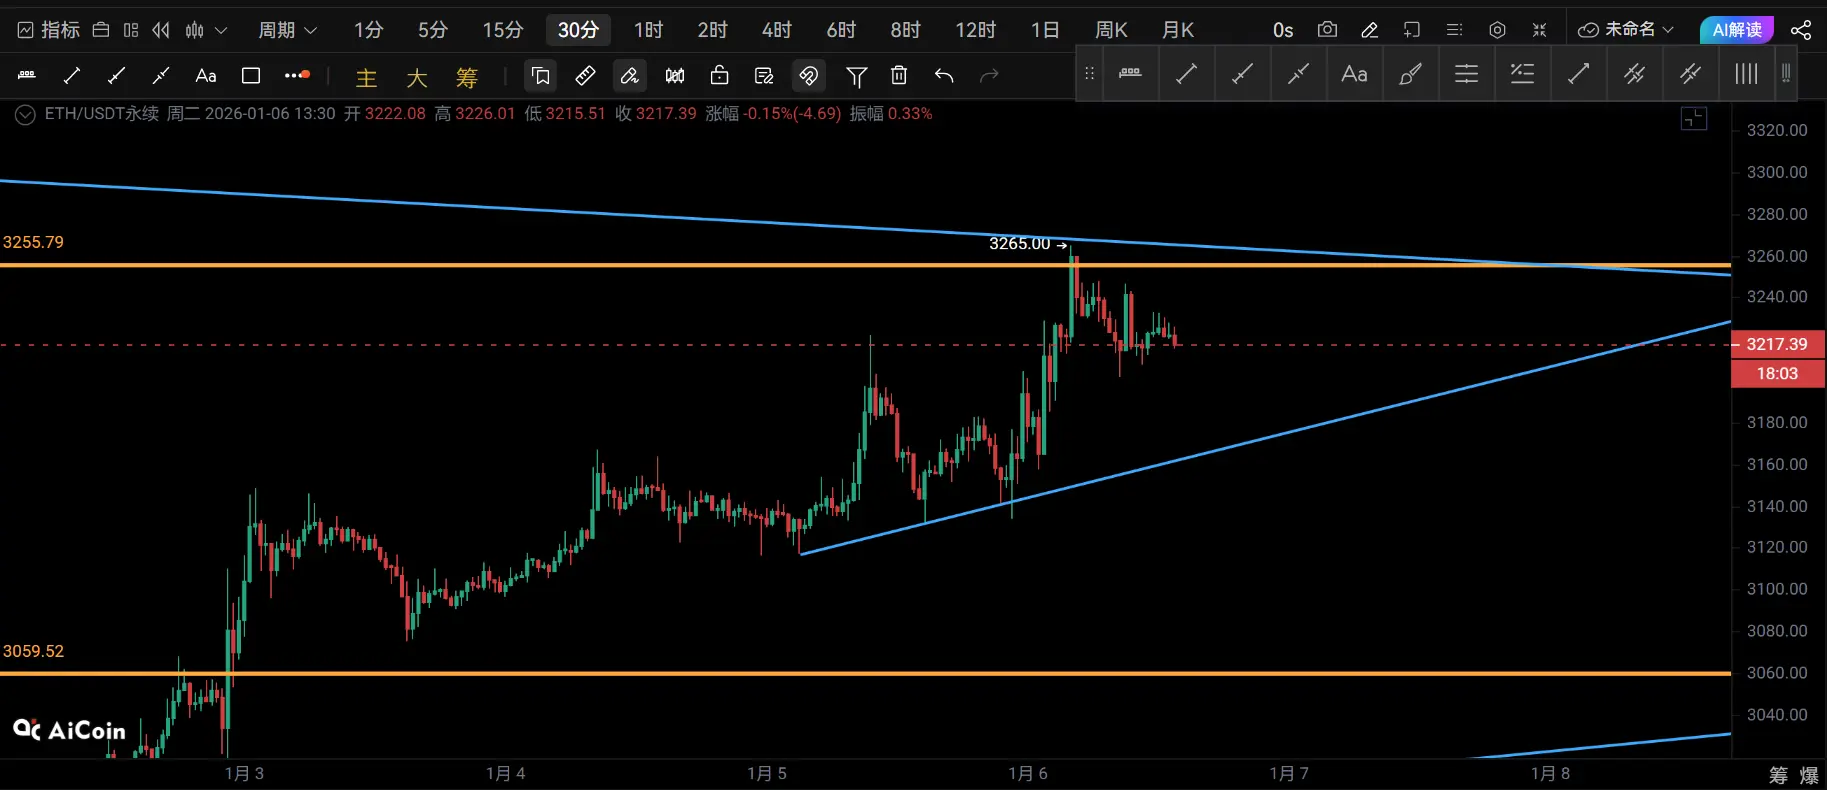
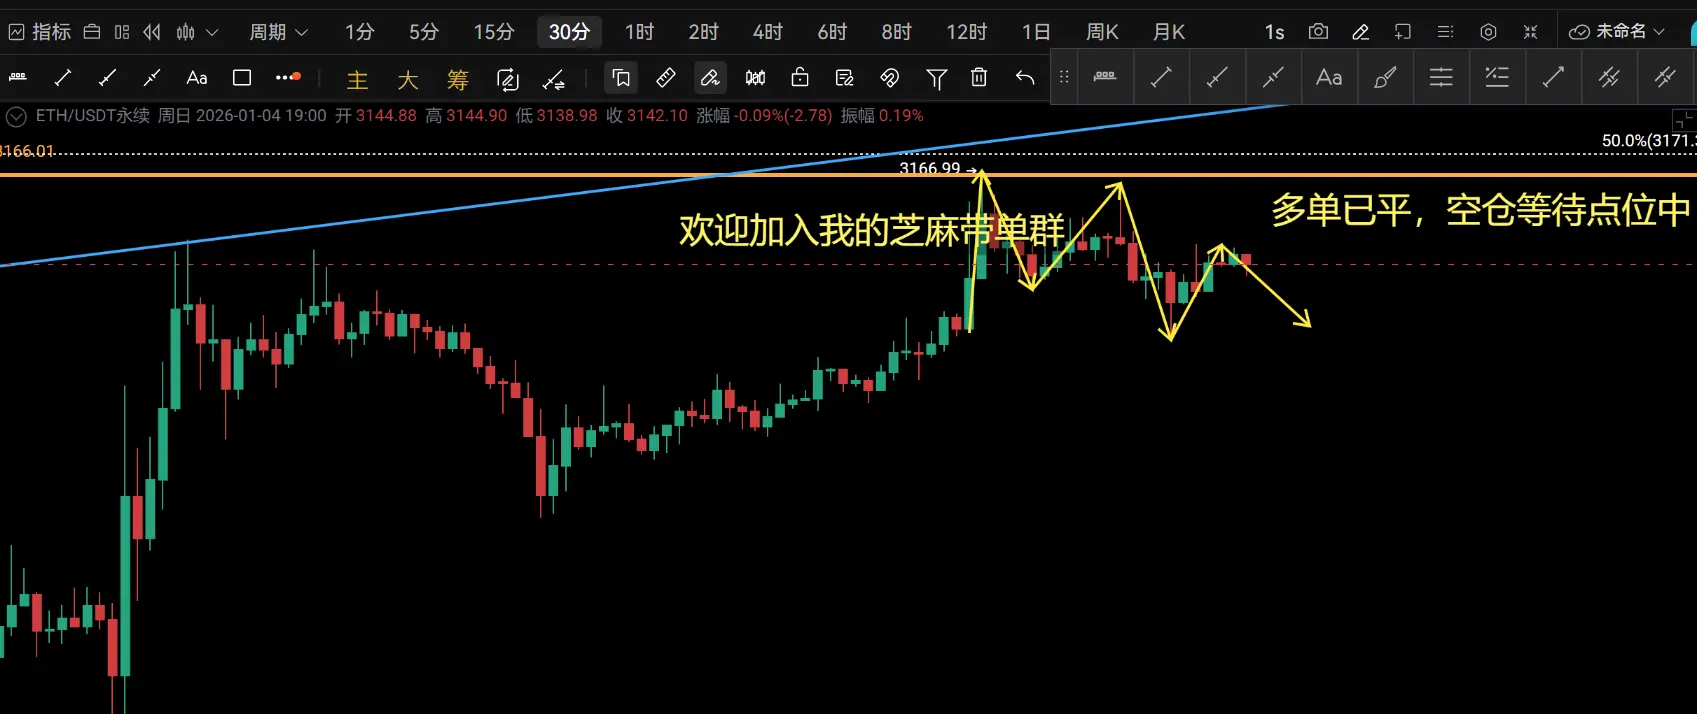
From the trend line in Chart 1, yesterday's surge can be viewed as a false breakout of the upper slope line of the daily chart convergence triangle. Looking at the convergence triangle, there is a high probability of oscillation within the upper and lower slope lines of this convergence zone. 3040 is a support level.
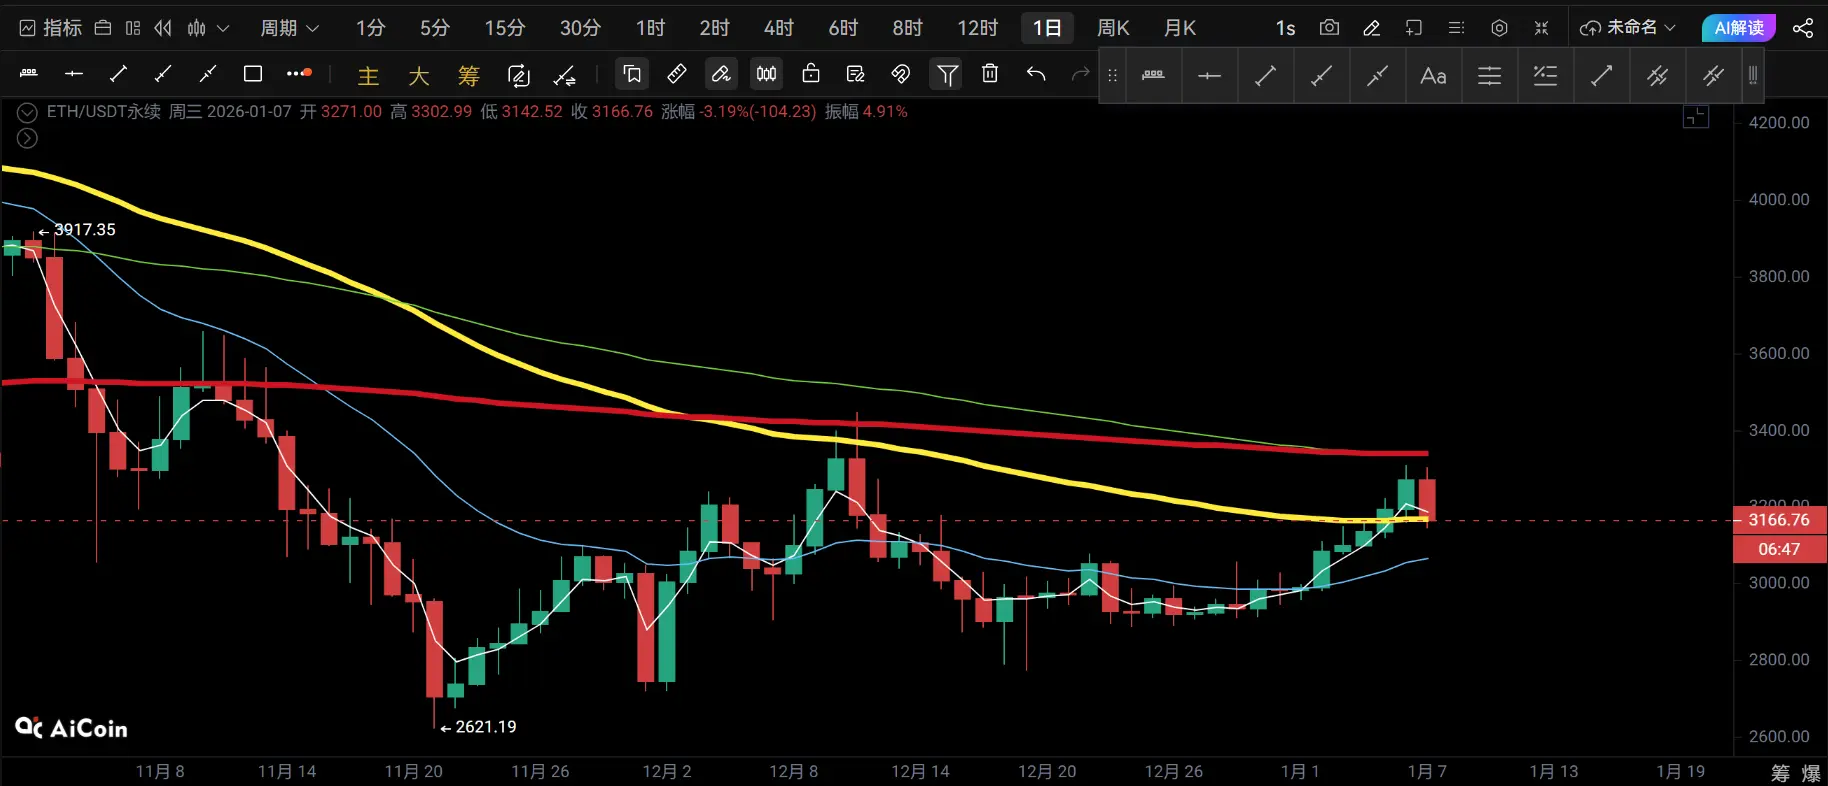
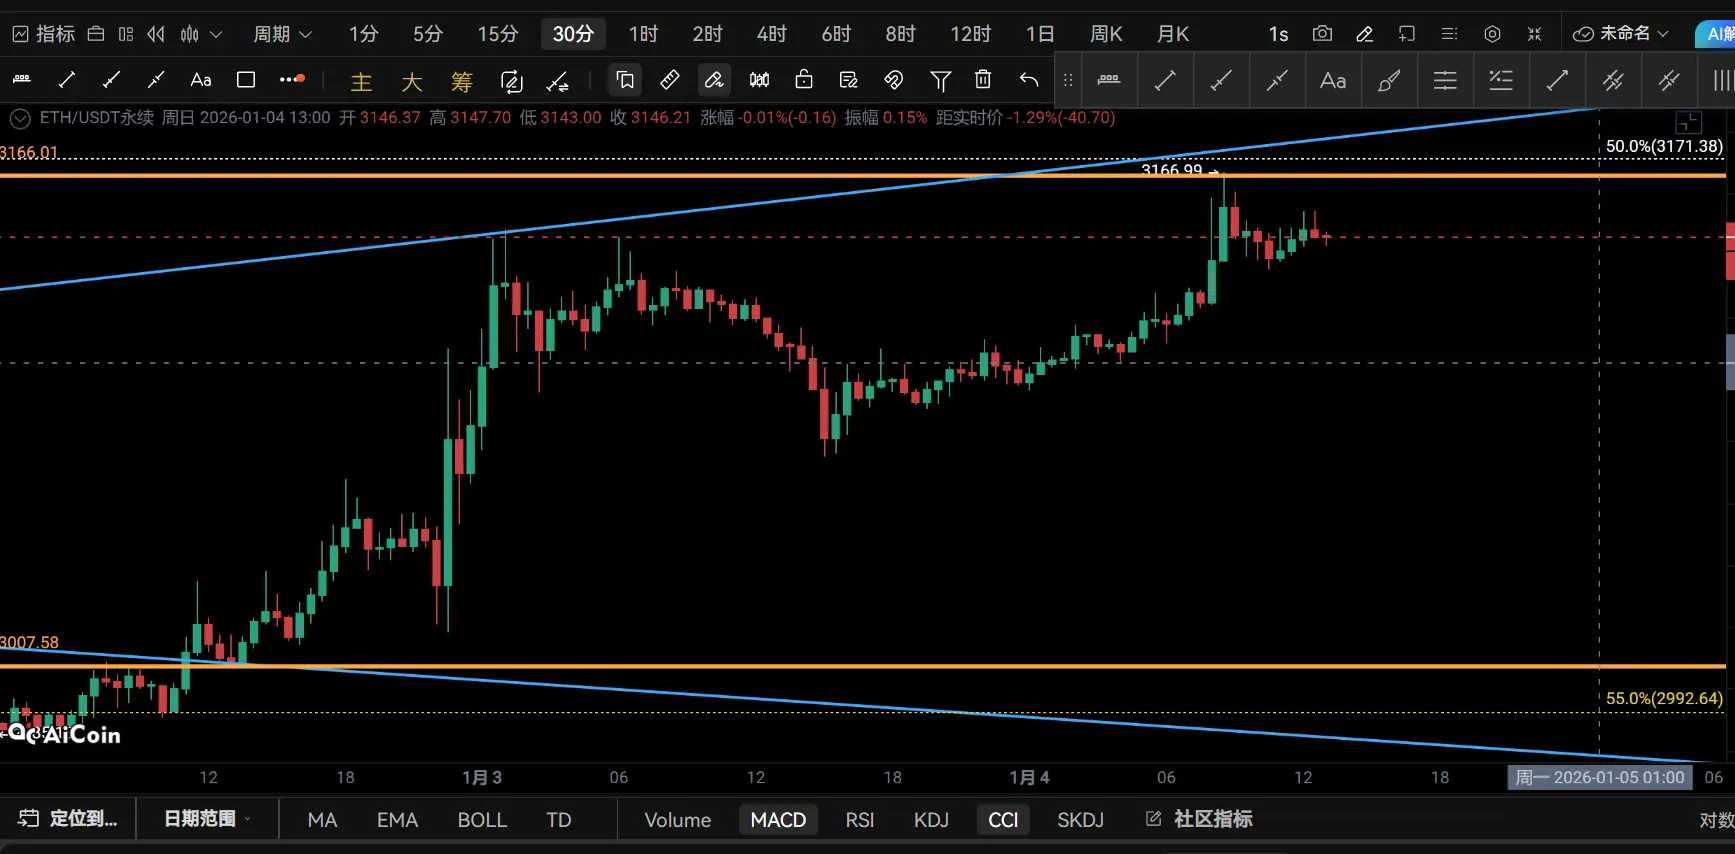
From the moving averages in Chart 2, there is a high probability of oscillation within the yellow moving average and red moving average. At 12:00 today, the daily chart is about to close. If it closes below the yellow moving average, it can be considered a fa
原文表示