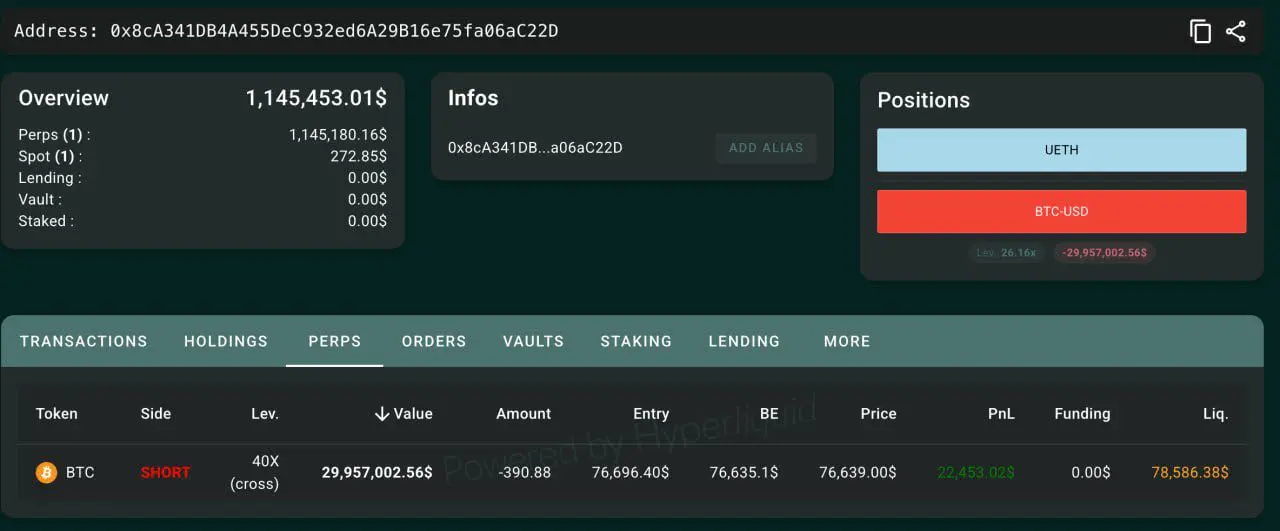
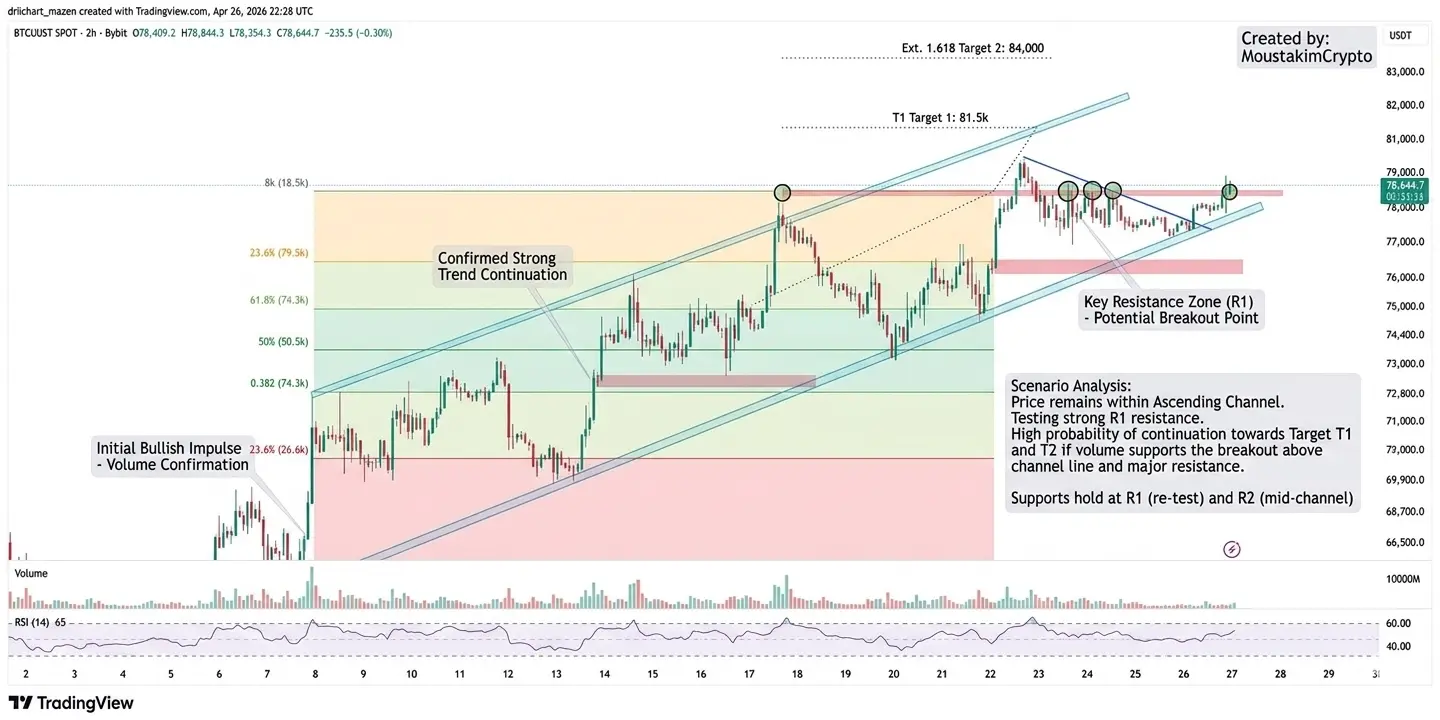
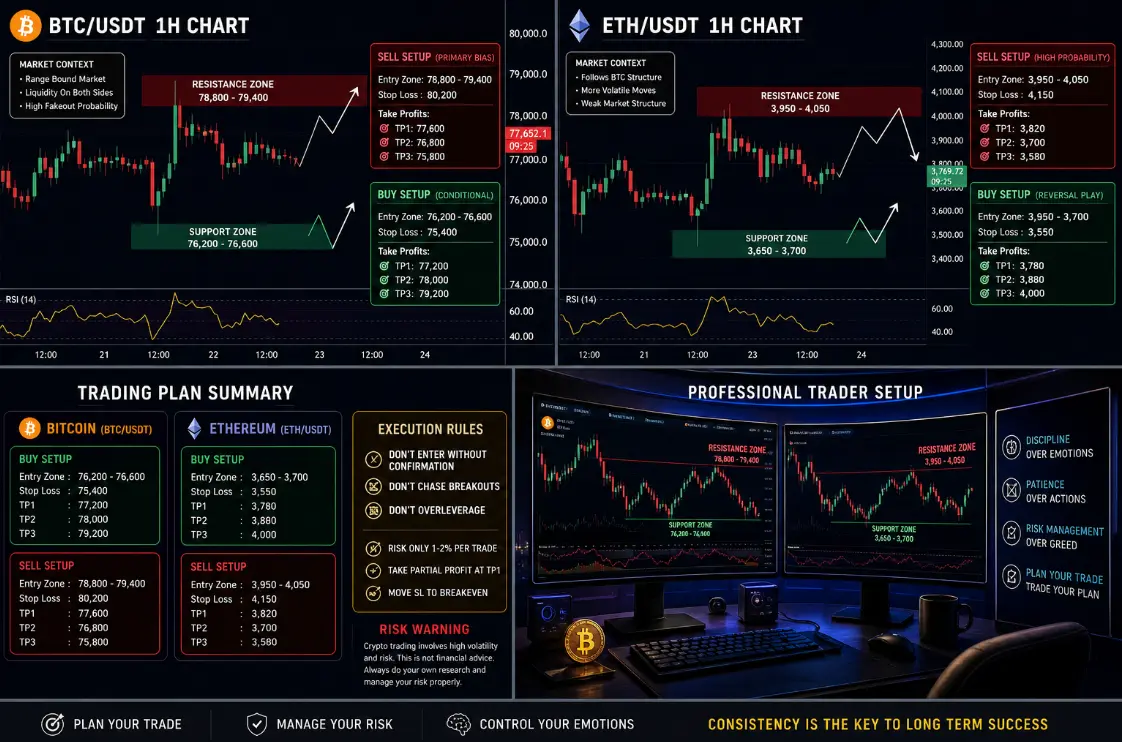
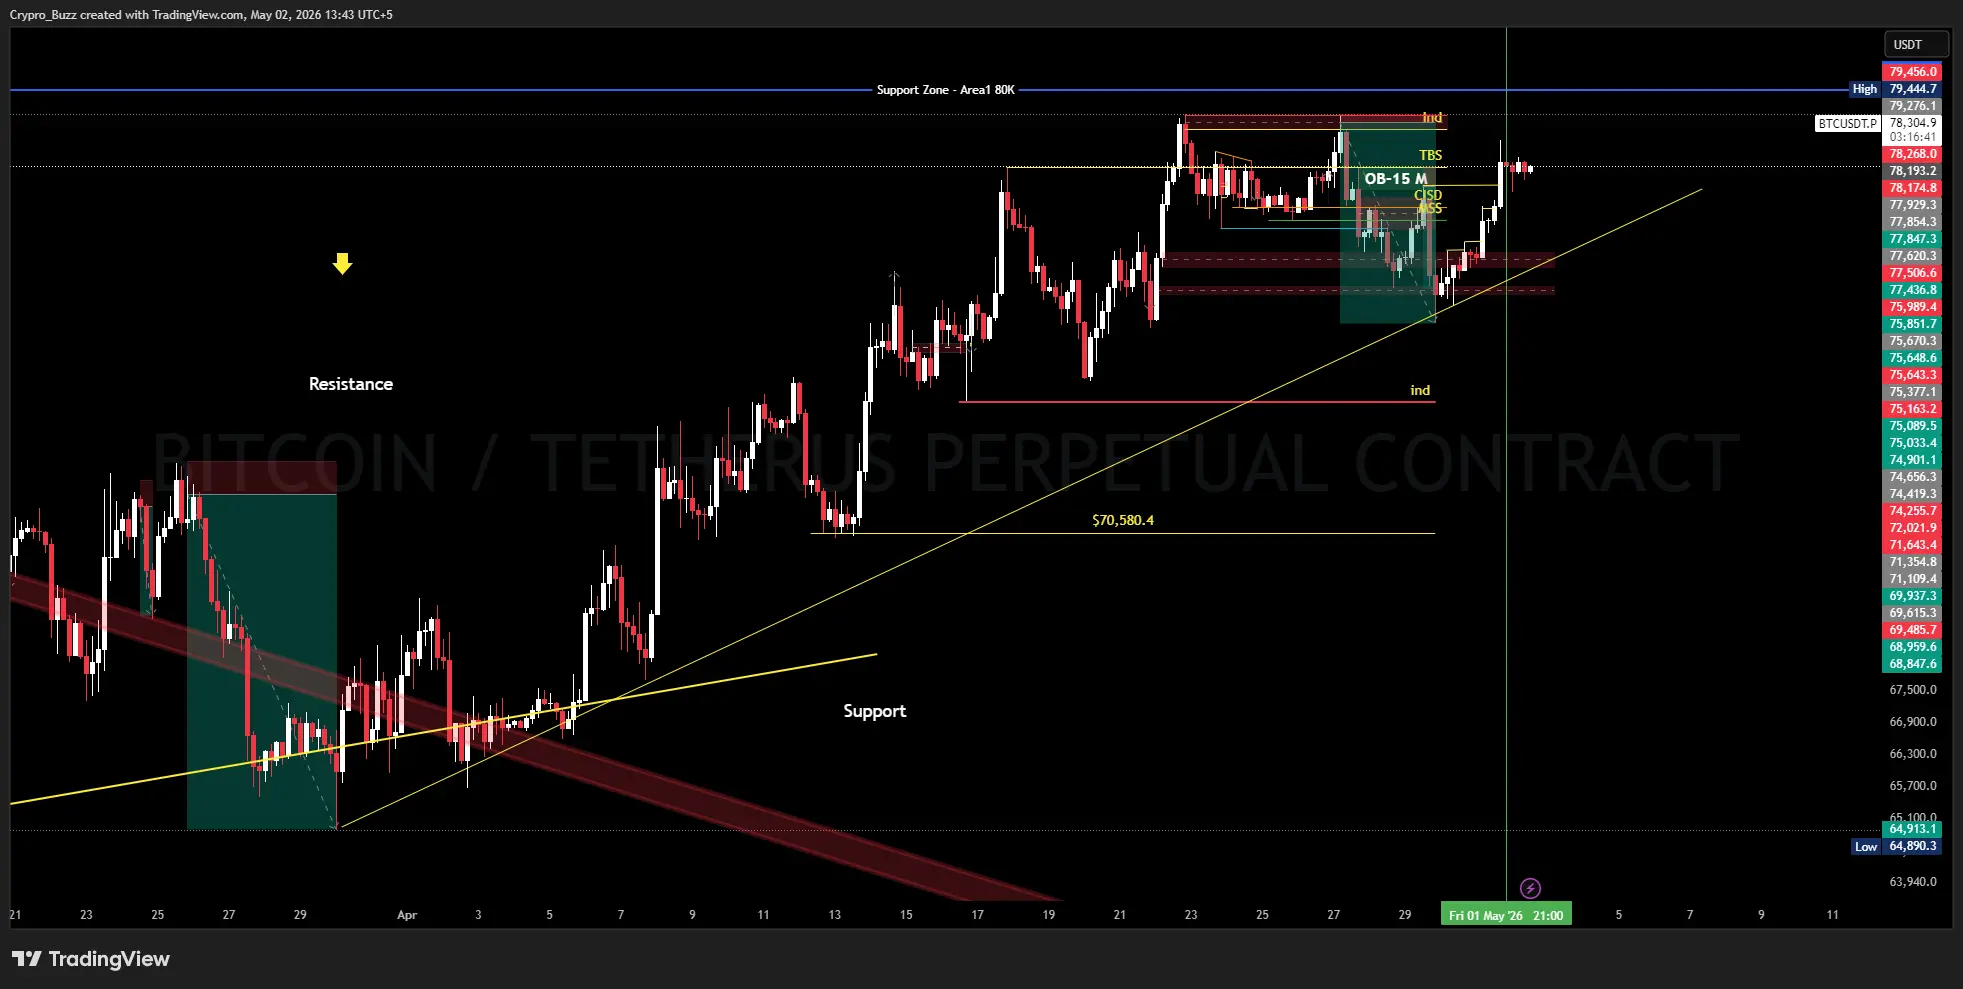
# BTC

37.65M
#CryptoMarketPullback #CryptoMarketPullback 🚨
BTC dipping under $83K has everyone on edge — Fear & Greed screaming Extreme Fear, charts bleeding red, sentiment breaking faster than price.
But markets don’t move on emotions. They move on liquidity and positioning.
What’s really happening: • ETF flows cooling after a strong run-up
• Excess leverage getting wiped out
• Macro uncertainty pushing a short-term defensive stance
This is how trends stay healthy. Expansion without correction doesn’t last.
Levels that matter now: 🔸 $81K — short-term demand zone
🔸 $78.5K — high-conviction structural ba
BTC-6,68%
post-image
  • Reward
  • 7
  • Repost
  • Share
AylaShinexvip:
Happy New Year! 🤑
View More
$BTC #CryptoMarketPullback #CryptoMarketPullback 🚨
BTC dipping under $83K has everyone on edge — Fear & Greed screaming Extreme Fear, charts bleeding red, sentiment breaking faster than price.
But markets don’t move on emotions. They move on liquidity and positioning.
What’s really happening: • ETF flows cooling after a strong run-up
• Excess leverage getting wiped out
• Macro uncertainty pushing a short-term defensive stance
This is how trends stay healthy. Expansion without correction doesn’t last.
Levels that matter now: 🔸 $81K — short-term demand zone
🔸 $78.5K — high-conviction structur
BTC-6,68%
  • Reward
  • Comment
  • Repost
  • Share
🚨 BREAKING
TOM LEE’S BITMINE IS CURRENTLY SITTING ON A $6.9 BILLION LOSS ON ETHEREUM.
THEIR STOCK DUMPED 84% AND IS NOW AT RISK OF DELISTING AND FULL LIQUIDATION.
THE SCARY PART?
WE HAVEN’T EVEN ENTERED THE BEAR MARKET YET… #bitcoin #btc #crypto #eth
ETH-13,34%
BTC-6,68%
  • Reward
  • Comment
  • Repost
  • Share
📉 #Bitcoin eaks key support level as Glassnode warns of further price breakdown
U.S. president Donald Trump’s surprise nomination of former Fed governor Kevin Warsh as the next Federal Reserve chair boosted the dollar, unwound the precious metals rally, and is bringing bitcoin below a key support level.
Onchain data shared by Glassnode shows bitcoin was consolidating just above key structural support around $83.4K, the lower bound of its short-term holder cost basis model.
A breakdown below that zone could open the door to a deeper slide toward $80.7K, the so-called True Market Mean.
That bre
BTC-6,68%
post-image
  • Reward
  • Comment
  • Repost
  • Share
#CryptoMarketPullback #CryptoMarketPullback 🚨🚀
BTC dipping under $83K has everyone on edge — Fear & Greed screaming Extreme Fear, charts bleeding red, sentiment breaking faster than price.
But markets don’t move on emotions. They move on liquidity and positioning.
What’s really happening: • ETF flows cooling after a strong run-up
• Excess leverage getting wiped out
• Macro uncertainty pushing a short-term defensive stance
This is how trends stay healthy. Expansion without correction doesn’t last.
Levels that matter now: 🔸 $81K — short-term demand zone
🔸 $78.5K — high-conviction structural
BTC-6,68%
post-image
  • Reward
  • Comment
  • Repost
  • Share
$BTC is now trading right on top of Bottom-2 support around 81k, and this is one of those levels where the market must show its hand. There’s no middle ground here.
What price is saying right now:
The sell-off has pushed BTC back into a high-risk zone.
Volatility is compressing after the drop — a classic sign that a large move is loading.
Two clear paths from here:
1️⃣ Breakdown scenario (high risk):
If #BTC loses 81k with strong sell volume, this structure fails completely. In that case, downside liquidity opens fast toward 75k first, and if fear accelerates, even 70k becomes possible. This m
BTC-6,68%
post-image
  • Reward
  • Comment
  • Repost
  • Share
Core Takeaway
BTC has been under significant pressure lately, showing a clear downward trend with signs of heavy selling and extremely bearish sentiment. Technical signals are flashing "oversold," hinting a rebound may be near—but caution is key as trend strength is still negative.
Key Data
- Latest price: $82,652.80 (quoted in USDT for the BTC_USDT pair)
- 24h change: -0.32%
- 24h high/low: $84,631.50 / $81,881.20
- Fear & Greed Index: Extreme Fear (score: 20)
- Technicals: RSI deeply oversold on multiple timeframes (as low as 12.3), MA lines in bearish alignment, price pressing on short-term
BTC-6,68%
post-image
  • Reward
  • 7
  • Repost
  • Share
Discoveryvip:
Happy New Year! 🤑
View More
$BTC at a Decision Point
This move is not just a pullback. It looks like a liquidity reset.
Price has sold off aggressively and is now sitting on a major demand area that previously acted as strong support. This zone will likely decide the next directional move.
Two scenarios to watch:
If this level holds, a relief rally and short-term trend recovery become likely.
If this level fails, another downside sweep could occur before a meaningful reversal.
Market moves are designed to shake out weak hands first.
Patience and confirmation matter more than prediction here.
Let price show its intent.
#B
BTC-6,68%
post-image
  • Reward
  • 1
  • Repost
  • Share
GateUser-7bfa3ee1vip:
Bull run 🐂
#CryptoMarketPullback #CryptoMarketPullback 🚨
Bitcoin slipping below $83K.
Fear Index flashing Extreme Fear.
Timeline full red.
But let’s slow down and read the market properly.
This isn’t panic. This is positioning.
🔹 ETF outflows = short-term profit booking
🔹 Leverage flush = weak hands removed
🔹 Macro pressure = temporary risk-off mood
Healthy bull markets breathe.
They pump. They correct. They reset.
Key zones to watch:
📍 $81,000 – First major support
📍 $78,500 – Strong structural support
If those levels hold, this pullback becomes fuel for the next expansion.
Remember:
Red days shak
BTC-6,68%
post-image
  • Reward
  • 13
  • Repost
  • Share
AngelEyevip:
2026 GOGOGO 👊
View More
#BTC (Bitcoin) Deep Market Analysis | Outlook for the Coming Days
Bitcoin is currently trading within a high-impact decision zone, where market participants are waiting for clear confirmation before committing to large directional positions. Price behavior indicates a phase of controlled consolidation, not trend exhaustion.
📊 Current BTC Market Structure
BTC remains aligned with a medium-to-long-term bullish structure
Higher timeframe charts continue to print higher lows, maintaining trend integrity
Lower timeframe action shows liquidity sweeps and range compression, often seen before expansi
BTC-6,68%
  • Reward
  • 10
  • Repost
  • Share
Flower89vip:
2026 GOGOGO 👊
View More
Load More
Trade Crypto Anywhere Anytime
qrCode
Scan to download Gate App
Community
  • 简体中文
  • English
  • Tiếng Việt
  • 繁體中文
  • Español
  • Русский
  • Français (Afrique)
  • Português (Portugal)
  • Bahasa Indonesia
  • 日本語
  • بالعربية
  • Українська
  • Português (Brasil)