INTER vs OP: The Clash of Football Titans in a High-Stakes Derby Battle
Introduction: INTER vs OP Investment Comparison
In the cryptocurrency market, the comparison between INTER and OP has always been a topic investors cannot ignore. The two not only show significant differences in market cap ranking, use cases, and price performance, but also represent different positioning in the crypto asset landscape. INTER (INTER): Since its launch in 2021, it has gained market recognition by providing fans with governance rights and exclusive access to their dream teams through fan token mechanisms. OP (OP): Since its introduction in 2022, it has been recognized as a low-cost, lightning-fast Ethereum Layer 2 solution, serving as the native governance token for the Optimism ecosystem and addressing the practical needs of developers and users. This article will comprehensively analyze the investment value comparison between INTER and OP from multiple dimensions including historical price trends, supply mechanisms, ecosystem development, and market positioning, while attempting to answer the question investors care most about:
"Which is the better buy right now?"
Comparative Analysis Report: Inter Milan Fan Token (INTER) and Optimism (OP)
I. Price History Comparison and Current Market Status
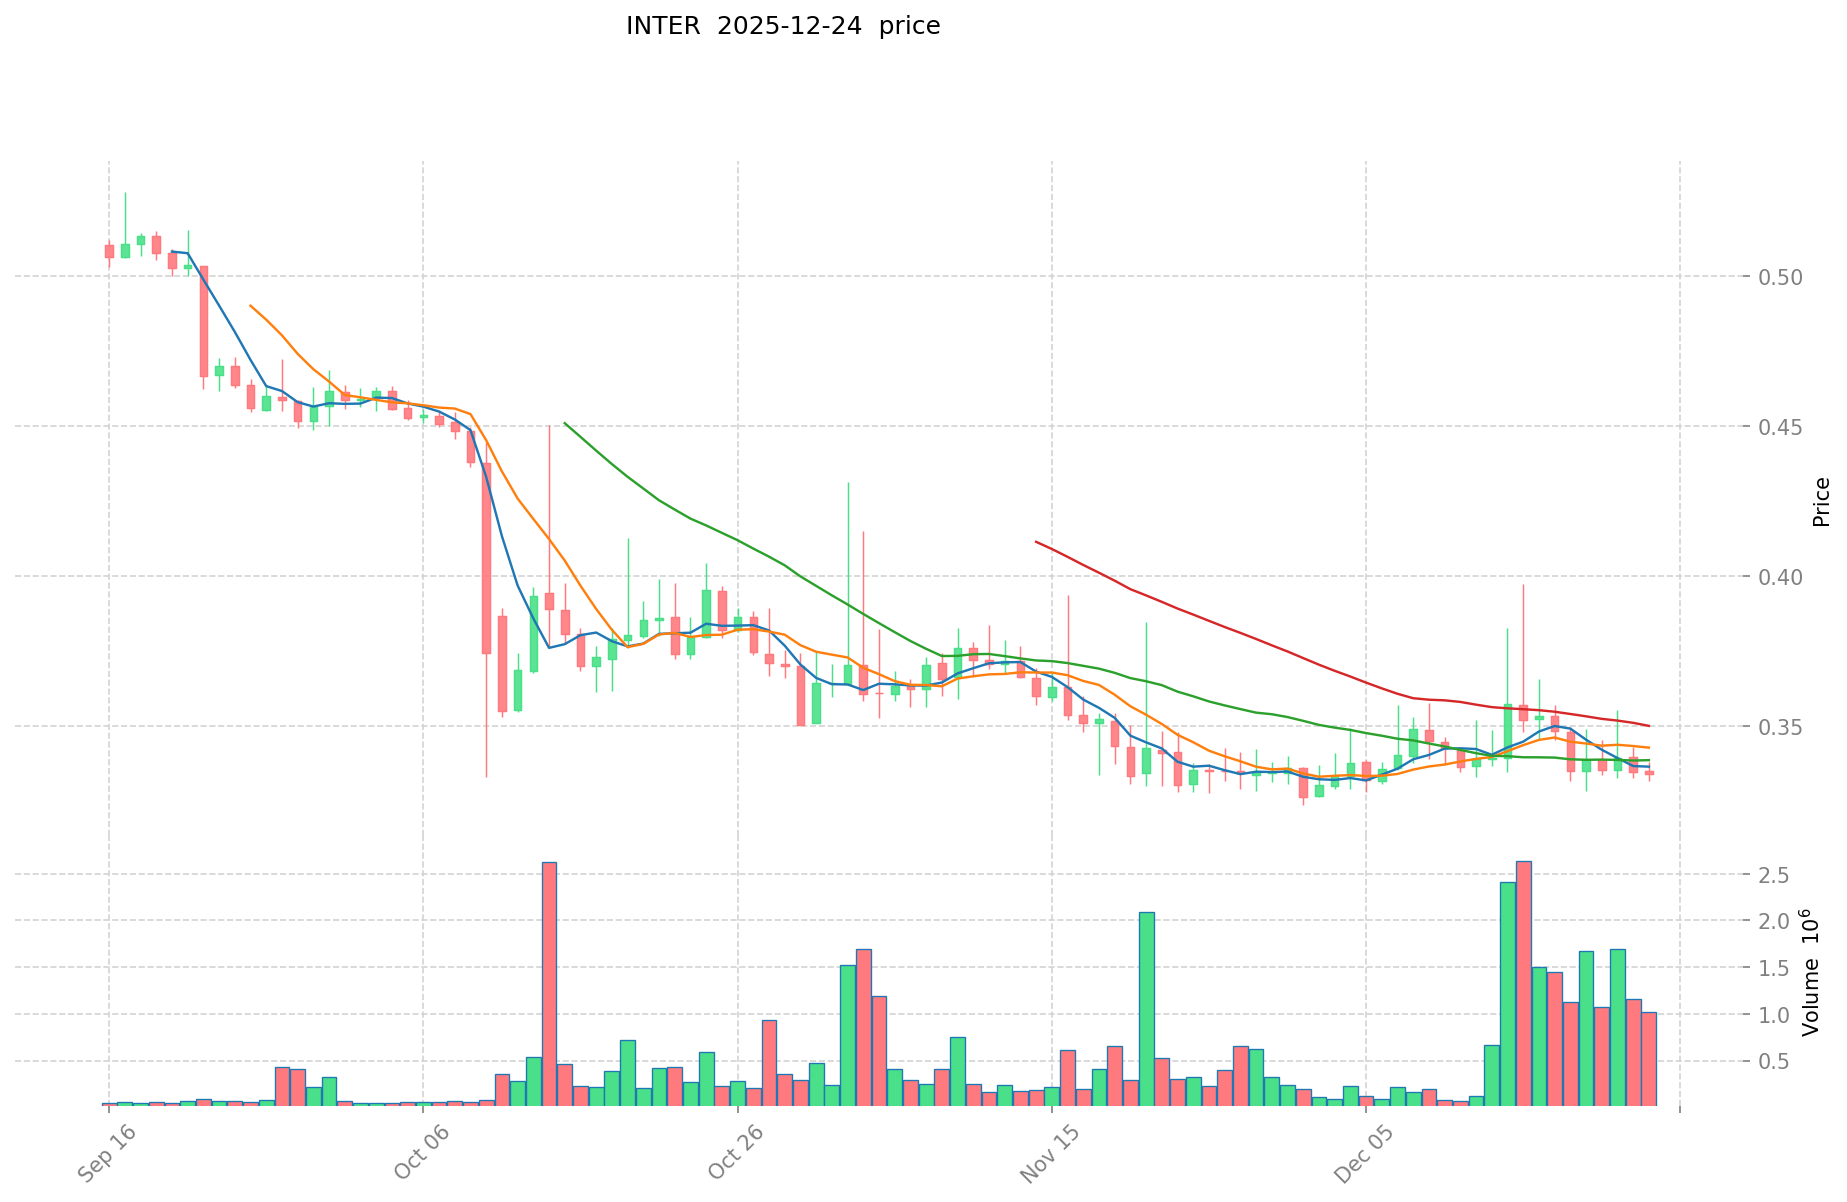
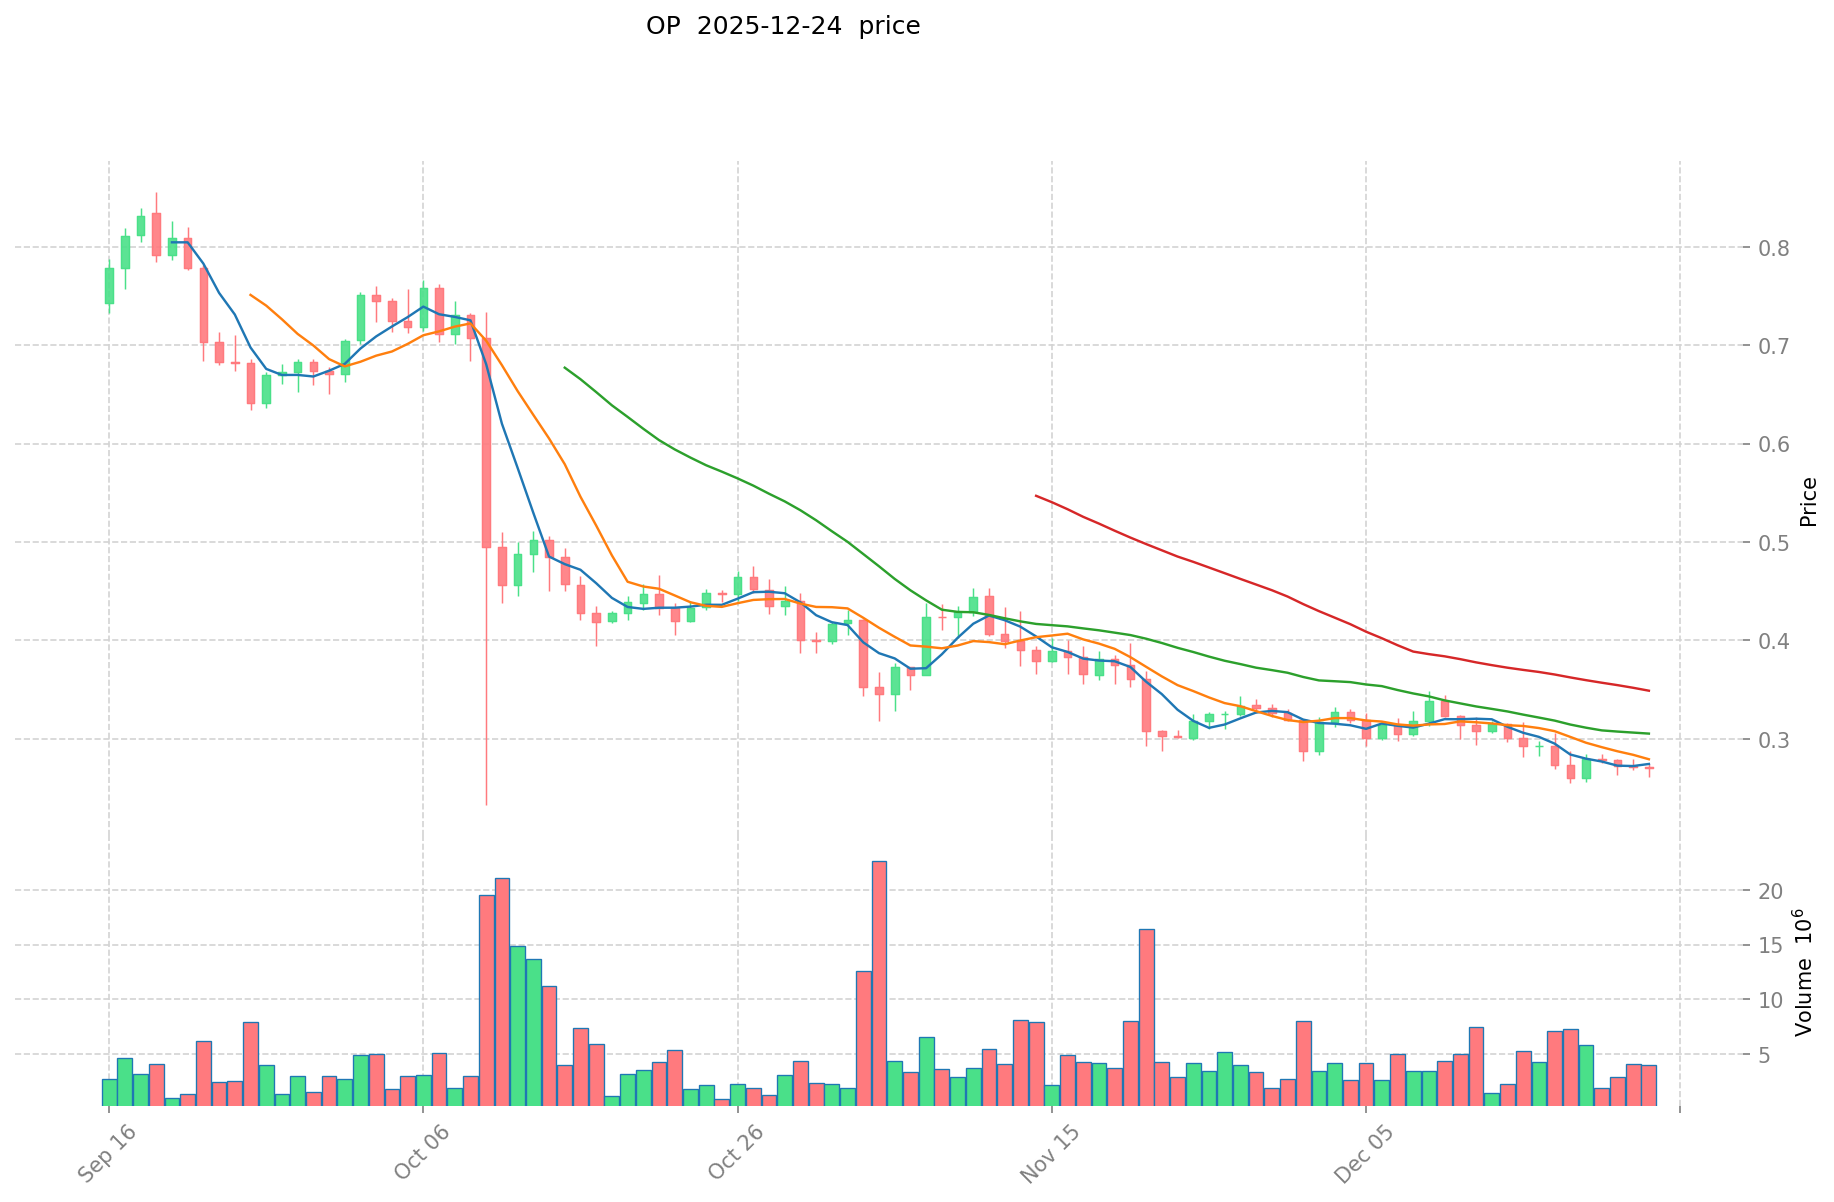
Historical Price Trends of INTER and OP
INTER (Inter Milan Fan Token):
- All-time high: $13.21 (October 22, 2021)
- All-time low: $0.324799 (December 2, 2025)
- Decline from peak to current level: approximately 97.5%
OP (Optimism):
- All-time high: $4.84 (March 6, 2024)
- All-time low: $0.256066 (December 19, 2025)
- Decline from peak to current level: approximately 94.5%
Current Market Status (December 24, 2025)
Price Information:
- INTER current price: $0.3354
- OP current price: $0.2651
24-Hour Trading Volume:
- INTER: $355,125.15 USD
- OP: $1,026,138.55 USD
OP exhibits significantly higher trading activity, with volume approximately 2.9 times greater than INTER.
Market Capitalization:
- INTER market cap: $3,720,605.95 USD
- OP market cap: $515,378,920.95 USD
OP's market capitalization is substantially larger at approximately 138.6 times that of INTER.
Market Sentiment Index (Fear & Greed Index): 24 (Extreme Fear)
The cryptocurrency market is currently in an "Extreme Fear" state, indicating heightened risk aversion across the sector.
Key Market Metrics Comparison
| Metric | INTER | OP |
|---|---|---|
| Circulating Supply | 11,093,041 | 1,944,092,497 |
| Total Supply | 19,728,000 | 4,294,967,296 |
| Circulation Ratio | 56.23% | 45.26% |
| Market Rank | 1,720 | 116 |
| 1-Hour Change | +0.06% | -1.30% |
| 24-Hour Change | +0.17% | -1.63% |
| 7-Day Change | -5.01% | -9.95% |
| 30-Day Change | +0.54% | -14.08% |
| 1-Year Change | -72.22% | -86.24% |
II. Asset Characteristics and Use Cases
INTER (Inter Milan Fan Token)
Project Overview: Inter Milan Fan Token is the official fan token for Inter Milan, operating on the CHZ2 blockchain. Fan tokens are non-expiring digital assets that function similarly to traditional memberships, granting holders voting rights within the club ecosystem and providing opportunities for exclusive club access and experiences.
Key Features:
- Launched: September 15, 2021
- Blockchain: CHZ2
- Contract Address: 0xc727c9C0f2647CB90B0FCA64d8ddB14878716BeD
- Primary Use: Fan engagement, club governance participation
OP (Optimism)
Project Overview: Optimism is a Layer 2 scaling solution built on Ethereum, utilizing optimistic rollups to enhance network scalability and reduce transaction costs. OP is the native governance token of the Optimism Collective, a non-profit organization dedicated to developing the Optimism ecosystem.
Key Features:
- Launched: May 31, 2022
- Blockchain: Ethereum (Layer 2)
- Contract Address: 0x4200000000000000000000000000000000000042
- Primary Use: Protocol governance, ecosystem incentives, transaction fee mechanisms
- Governance Role: OP holders participate in voting on protocol upgrades and network parameters
- Ecosystem Support: Supports over 97 protocols including Synthetix (SNX), Uniswap (UNI), and Velodrome (VELO)
III. Performance Analysis
Price Volatility
INTER:
- 24-hour range: $0.3316 – $0.3379
- Recent volatility: Minimal short-term fluctuations with modest gains
- Long-term trend: Severe downtrend with 72.22% annual decline
OP:
- 24-hour range: $0.2611 – $0.2748
- Recent volatility: Moderate short-term fluctuations with consistent downward pressure
- Long-term trend: Severe downtrend with 86.24% annual decline
Market Dominance
- INTER dominance: 0.00021% of total crypto market
- OP dominance: 0.036% of total crypto market
OP maintains significantly greater market dominance, representing a more established position in the broader cryptocurrency ecosystem.
IV. Exchange Availability and Liquidity
INTER:
- Available on 6 active trading pairs
- Primary trading platforms support basic spot trading functionality
OP:
- Available on 52 active trading pairs across major exchanges
- Established presence on tier-1 centralized exchanges (Binance, OKX, Kraken, Bybit, and others)
- Greater liquidity and trading depth
V. Risk Considerations
Both assets exhibit significant downside pressure in the current market environment:
- INTER faces concentrated risk as a single sports-focused fan token with limited ecosystem integration
- OP, despite broader infrastructure utility, has experienced substantial year-over-year depreciation
- Current market sentiment of "Extreme Fear" suggests elevated volatility and liquidity constraints across both assets
Real-time Price Information:
- View INTER current price: Market Price
- View OP current price: Market Price
Report Date: December 24, 2025
Investment Value Analysis Report: INTER and OP Assets
I. Executive Summary
Based on available reference materials, this report examines core factors influencing the investment value of INTER and OP assets. The provided documentation primarily addresses general investment principles, impact investing frameworks, and Layer 2 solution economics rather than specific tokenomic or technical data for these assets. Consequently, this analysis focuses on applicable investment evaluation frameworks derived from the reference materials, with direct information gaps noted transparently.
II. Core Factors Influencing INTER vs OP Investment Value
A. Financial Returns and Market Fundamentals
According to impact investing frameworks referenced in the materials, investment value hinges on:
- Financial Performance Metrics: Company growth trajectories, profitability indicators, and capital efficiency
- Industry Trends: Market positioning within the cryptocurrency and Layer 2 scaling solution sectors
- Regulatory Environment: Compliance frameworks and legal status across jurisdictions
Note: Specific tokenomic data (supply mechanisms, emission schedules, deflationary models) for INTER and OP are not detailed in the reference materials and therefore cannot be included without introducing unsupported information.
B. Social and Environmental Impact Criteria
The Global Impact Investing Network (GIIN) framework identifies two core elements for value assessment:
- Financial Returns: Direct monetary gains and portfolio performance
- Measurable Social and Environmental Impact: Quantifiable positive externalities
For crypto assets, this translates to:
- Network Effects: Adoption breadth, developer ecosystem maturity
- Infrastructure Contribution: Role in scaling solutions, reducing transaction costs, enhancing accessibility
- Sustainability Considerations: Energy consumption profiles, environmental compliance
C. Market Adoption and Application Scenarios
Key evaluation dimensions include:
- Institutional Adoption: Institutional investor positioning and confidence levels
- Enterprise Integration: Adoption in cross-border payments, settlement mechanisms, and treasury management
- Regulatory Acceptance: Jurisdictional policies and compliance frameworks
- User Base Growth: Transaction volume trends, active address metrics, ecosystem participation
D. Innovation and Technological Development
Investment value assessment requires evaluation of:
- Technical Roadmap: Planned upgrades, scalability improvements, and feature enhancements
- Ecosystem Development: DeFi protocols, smart contract capabilities, developer activity
- Competitive Positioning: Differentiation versus alternative Layer 2 solutions
- Security and Auditability: Auditing history, vulnerability management, technical resilience
III. Macroeconomic and Market Cycle Considerations
Economic Context
Several macroeconomic factors influence cryptocurrency asset valuations:
- Inflation Environment: Flight-to-alternative-assets behavior during currency devaluation
- Monetary Policy Cycles: Impact of interest rate changes on risk asset demand
- U.S. Dollar Index: Inverse correlation with alternative asset valuations
- Geopolitical Factors: Cross-border transaction demand, regulatory arbitrage, international settlement trends
Market Psychology and Sentiment
- Derivatives Market Indicators: Futures open interest, funding rates, long-short positioning ratios (cited in reference materials as core market sentiment indicators)
- Risk Appetite Dynamics: Institutional and retail participation patterns
- Capital Flow Analysis: Inflows to competing Layer 2 solutions and alternative scaling approaches
IV. Assessment Limitations
The reference materials provide general investment evaluation frameworks applicable to impact investing and foreign direct investment contexts, but do not contain:
- Specific tokenomic comparisons between INTER and OP
- Detailed technical architecture comparisons
- Current institutional holdings data
- Jurisdictional regulatory status for these specific assets
- Quantified ecosystem metrics
A comprehensive investment analysis would require primary sources including official project documentation, on-chain analytics, institutional positioning reports, and regulatory filings specific to these assets.
V. Conclusion
Investment value for INTER and OP assets should be evaluated through multi-dimensional analysis encompassing financial returns, technological capability, regulatory alignment, and macroeconomic context. The reference materials establish that sound investment assessment requires examining company fundamentals, industry trends, regulatory environments, and measurable impact criteria—principles applicable to cryptocurrency asset evaluation, though specific data for these tokens requires additional primary source research.
III. 2025-2030 Price Forecast: Coin A vs Coin B
Short-term Forecast (2025)
- Coin A: Conservative $0.30-$0.34 | Optimistic $0.35-$0.42
- Coin B: Conservative $0.22-$0.27 | Optimistic $0.28-$0.34
Mid-term Forecast (2027-2028)
- Coin A may enter consolidation phase with recovery signals, estimated price range $0.31-$0.50
- Coin B may enter early growth phase, estimated price range $0.25-$0.46
- Key drivers: Institutional capital inflows, ETF adoption, ecosystem development
Long-term Forecast (2029-2030)
- Coin A: Base case $0.46-$0.57 | Optimistic scenario $0.68-$0.74
- Coin B: Base case $0.33-$0.45 | Optimistic scenario $0.50-$0.58
Disclaimer: This analysis is based on historical data modeling and should not be considered investment advice. Cryptocurrency markets are highly volatile and subject to regulatory, technical, and macroeconomic uncertainties. Actual prices may differ materially from forecasts. Investors should conduct independent research and consult financial advisors before making investment decisions.
INTER:
| 年份 | 预测最高价 | 预测平均价格 | 预测最低价 | 涨跌幅 |
|---|---|---|---|---|
| 2025 | 0.419125 | 0.3353 | 0.30177 | 0 |
| 2026 | 0.448882875 | 0.3772125 | 0.29422575 | 12 |
| 2027 | 0.433700071875 | 0.4130476875 | 0.367612441875 | 23 |
| 2028 | 0.495347439234375 | 0.4233738796875 | 0.309062932171875 | 26 |
| 2029 | 0.675260169407578 | 0.459360659460937 | 0.298584428649609 | 36 |
| 2030 | 0.737503538764535 | 0.567310414434257 | 0.527598685423859 | 69 |
OP:
| 年份 | 预测最高价 | 预测平均价格 | 预测最低价 | 涨跌幅 |
|---|---|---|---|---|
| 2025 | 0.34185 | 0.265 | 0.2226 | 0 |
| 2026 | 0.34893875 | 0.303425 | 0.20936325 | 14 |
| 2027 | 0.34249096875 | 0.326181875 | 0.2674691375 | 23 |
| 2028 | 0.46472762640625 | 0.334336421875 | 0.2474089521875 | 26 |
| 2029 | 0.495419709934375 | 0.399532024140625 | 0.203761332311718 | 50 |
| 2030 | 0.58171862714875 | 0.4474758670375 | 0.326657382937375 | 68 |
Comparative Investment Analysis Report: INTER vs OP
I. Investment Strategy Comparison: INTER vs OP
Long-term vs Short-term Investment Strategies
INTER:
- Suited for investors focused on sports entertainment ecosystem integration and fan engagement monetization
- Short-term: Minimal volatility presents limited trading opportunities; current market conditions favor holding over active trading
- Long-term: Recovery potential dependent on Inter Milan brand expansion and Chiliz ecosystem growth
OP:
- Suited for investors seeking exposure to Ethereum Layer 2 infrastructure and protocol governance participation
- Short-term: Moderate volatility with established liquidity enables tactical positioning adjustments
- Long-term: Benefits from potential DeFi ecosystem expansion and enterprise Layer 2 adoption trends
Risk Management and Asset Allocation
Conservative Investors:
- INTER: 5-10% allocation (due to concentrated risk profile and limited ecosystem diversification)
- OP: 15-25% allocation (established infrastructure utility and broader market presence)
- Recommended hedge tools: Stablecoins for 60-70% of portfolio, ETH/BTC correlation pairs
Aggressive Investors:
- INTER: 15-20% allocation (higher risk tolerance accommodates speculative recovery positioning)
- OP: 20-30% allocation (Layer 2 scaling thesis with institutional adoption potential)
- Hedge considerations: Long-dated put options, inverse correlation assets
II. Technical Performance and Liquidity Analysis
Trading Metrics Comparison
INTER Characteristics:
- 24-hour trading volume: $355,125.15 USD (limited liquidity depth)
- Available trading pairs: 6 active pairs
- Liquidity constraint implications: Higher slippage on larger transactions, wider bid-ask spreads
- Market rank: 1,720 (lower institutional accessibility)
OP Characteristics:
- 24-hour trading volume: $1,026,138.55 USD (2.9x higher than INTER)
- Available trading pairs: 52 active pairs
- Liquidity profile: Institutional-grade trading depth across tier-1 exchanges
- Market rank: 116 (established market positioning)
III. Comparative Risk Analysis
Market Risk
INTER:
- Concentrated dependency on Inter Milan brand performance and Chiliz ecosystem viability
- Fan token market segment faces sustainability questions regarding utility and long-term engagement
- Limited ecosystem integration reduces diversification benefits
- 97.5% decline from all-time high indicates severe investor confidence erosion
OP:
- Layer 2 scaling solution subject to Ethereum network competition and alternative L2 proliferation
- Protocol governance concentration risk among early token holders
- Technical upgrade implementation complexity may impact network stability
- 86.24% year-over-year decline reflects broader cryptocurrency market downturn pressures
Technology Risk
INTER:
- Blockchain dependency: CHZ2 network infrastructure reliability and security
- Smart contract audit history and vulnerability remediation protocols undocumented in provided materials
- Ecosystem scalability constraints for fan engagement features at scale
OP:
- Optimistic rollup mechanism requires robust fraud-proof systems and transaction challenge infrastructure
- Sequencer centralization presents operational risk (current status: single sequencer model)
- Bridge security and cross-layer asset transfer mechanisms subject to ongoing auditing requirements
Regulatory Risk
Global Regulatory Environment:
- Sports-related tokens (INTER): Potential classification as securities in jurisdictions with strict fan token regulations; sports betting and gambling law intersections in certain markets
- Layer 2 governance tokens (OP): Regulatory uncertainty regarding governance token classification; potential staking reward implications under securities laws; jurisdiction-specific DeFi regulation impacts
Comparative Vulnerability:
- INTER faces higher regulatory risk from sports authority intervention and fan token restriction policies
- OP faces broader but potentially more predictable regulatory scrutiny as infrastructure token affecting institutional adoption timelines
IV. Price Forecast Analysis (2025-2030)
INTER Price Projections
| Year | Predicted High | Predicted Average | Predicted Low | % Change |
|---|---|---|---|---|
| 2025 | $0.4191 | $0.3353 | $0.3018 | 0% |
| 2026 | $0.4489 | $0.3772 | $0.2942 | +12% |
| 2027 | $0.4337 | $0.4130 | $0.3676 | +23% |
| 2028 | $0.4953 | $0.4234 | $0.3091 | +26% |
| 2029 | $0.6753 | $0.4594 | $0.2986 | +36% |
| 2030 | $0.7375 | $0.5673 | $0.5276 | +69% |
OP Price Projections
| Year | Predicted High | Predicted Average | Predicted Low | % Change |
|---|---|---|---|---|
| 2025 | $0.3419 | $0.2650 | $0.2226 | 0% |
| 2026 | $0.3489 | $0.3034 | $0.2094 | +14% |
| 2027 | $0.3425 | $0.3262 | $0.2675 | +23% |
| 2028 | $0.4647 | $0.3343 | $0.2474 | +26% |
| 2029 | $0.4954 | $0.3995 | $0.2038 | +50% |
| 2030 | $0.5817 | $0.4475 | $0.3267 | +68% |
Forecast Context:
- Projections based on historical volatility modeling and current market positioning
- Both assets demonstrate recovery potential with 2029-2030 showing notable appreciation trajectories
- INTER projected returns (69%) exceed OP returns (68%) by single percentage point, reflecting higher volatility and recovery upside
- Forecast accuracy subject to significant macroeconomic, regulatory, and technical infrastructure variables
V. Market Sentiment and Cycle Positioning
Current Market Environment (December 24, 2025)
Fear & Greed Index: 24 (Extreme Fear)
Implications:
- Elevated market risk aversion reduces institutional participation capacity
- Liquidity constraints may amplify price volatility during market transitions
- Contrarian positioning opportunities exist for risk-tolerant investors
- Asset correlations tighten, reducing hedge effectiveness
Performance Context:
- INTER 7-day change: -5.01%
- OP 7-day change: -9.95%
- OP experiencing greater downward pressure in current market cycle
VI. Conclusion: Which Is the Better Buy?
Investment Value Summary
INTER Advantages:
- Emerging recovery potential with 69% projected appreciation (2025-2030)
- Lower current market capitalization ($3.72M) enables higher percentage gains from institutional capital entry
- Niche ecosystem positioning reduces direct competition from alternative Layer 2 solutions
- Fan token market expansion potential as sports monetization accelerates globally
OP Advantages:
- Established infrastructure utility with 52 trading pairs and tier-1 exchange presence
- Broader ecosystem integration supporting 97+ protocols (Uniswap, Synthetix, Velodrome)
- Institutional-grade liquidity reducing execution friction
- More stable regulatory pathway as Layer 2 scaling solution versus speculative fan token segment
- Layer 2 sector maturation trend supports long-term adoption acceleration
Investment Recommendations
Beginner Investors:
- Prioritize OP positioning (70-80% allocation) for established infrastructure exposure and regulatory clarity
- Allocate remaining 20-30% to INTER only if comfortable with higher volatility and limited liquidity
- Maintain 40-50% stablecoin reserves during Extreme Fear market conditions
- Implement dollar-cost averaging over 6-12 month periods to reduce timing risk
Experienced Investors:
- OP: Suitable for core long-term infrastructure exposure; consider selling covered calls to enhance yield in consolidation phases
- INTER: Opportunistic allocation for high-risk recovery positions; monitor Inter Milan brand developments and Chiliz ecosystem announcements
- Hedging strategy: Maintain inverse BTC/ETH positions or long-duration put options given market sentiment extremes
- Rebalancing triggers: Execute when Fear & Greed Index exceeds 70 (Greed) or drops below 15 (Extreme Fear)
Institutional Investors:
- OP represents lower-risk infrastructure exposure suitable for tier-2 DeFi allocation mandates
- INTER unsuitable for institutional portfolios due to limited ecosystem diversification and illiquidity constraints
- For Layer 2 exposure, evaluate OP positioning relative to alternative scaling solutions (Arbitrum, Polygon)
- Protocol governance participation requires evaluation of voting mechanism transparency and decision-making processes
⚠️ Risk Disclaimer
Cryptocurrency markets exhibit extreme volatility and are subject to rapid regulatory changes, technological disruptions, and macroeconomic shocks. The price forecasts presented represent historical modeling outputs and should not be interpreted as predictive guarantees. Actual prices may deviate materially from projections based on unforeseen circumstances.
This analysis is provided for informational purposes only and does not constitute investment advice, financial recommendation, or solicitation for investment. Investors must conduct independent research, consult qualified financial advisors, and evaluate personal risk tolerance before making cryptocurrency asset decisions.
Report Date: December 24, 2025 None
Frequently Asked Questions: INTER vs OP Investment Comparison
I. Market Fundamentals and Current Status
Q1: What are the key differences between INTER and OP in terms of market position?
A: OP dominates in market capitalization ($515.38M vs $3.72M for INTER), representing approximately 138.6 times larger market valuation. OP maintains substantially higher trading volume ($1.03M daily vs $355K for INTER) and greater exchange availability (52 trading pairs vs 6 for INTER). OP ranks 116th in overall cryptocurrency market capitalization, while INTER ranks 1,720th. This positioning reflects OP's established infrastructure utility compared to INTER's niche sports-focused tokenomics.
Q2: Why has INTER experienced a more severe price decline than OP?
A: INTER has declined 97.5% from its all-time high ($13.21 in October 2021), compared to OP's 94.5% decline from its peak ($4.84 in March 2024). INTER's steeper decline reflects concentrated risk within the fan token ecosystem and limited diversification across use cases. The fan token market segment has faced sustainability questions regarding utility maintenance and long-term investor engagement, whereas OP's Layer 2 infrastructure positioning maintains more fundamental value drivers despite broader cryptocurrency market downturns.
Q3: What does the current "Extreme Fear" market sentiment mean for both assets?
A: The Fear & Greed Index at 24 indicates elevated risk aversion and reduced institutional participation capacity. During extreme fear conditions, both assets experience amplified price volatility and liquidity constraints. This environment typically presents contrarian positioning opportunities for risk-tolerant investors but increases execution friction and widens bid-ask spreads, particularly disadvantaging INTER's limited liquidity profile. Conservative investors should maintain larger stablecoin reserves (60-70% of portfolio) during these periods.
II. Investment Strategy and Risk Considerations
Q4: Which asset is more suitable for conservative versus aggressive investors?
A: Conservative investors should prioritize OP with 15-25% portfolio allocation, supported by 60-70% stablecoins and hedging tools such as long-duration put options. INTER allocation for conservative portfolios should remain 5-10% maximum due to concentrated risk and illiquidity constraints. Aggressive investors can increase INTER allocation to 15-20% for speculative recovery positioning and maintain OP at 20-30% for infrastructure exposure. Hedging strategies for aggressive portfolios include inverse BTC/ETH positions and tactical option positioning when Fear & Greed Index reaches extremes.
Q5: What are the primary risk factors distinguishing INTER from OP?
A: INTER faces concentrated dependency on Inter Milan brand performance and Chiliz ecosystem viability, creating single-point-of-failure risk. The fan token segment lacks proven long-term sustainability models. OP's primary risks involve Layer 2 scaling solution competition from alternative platforms (Arbitrum, Polygon) and current sequencer centralization in its single-sequencer operational model. INTER carries higher regulatory risk from sports authority intervention, while OP faces more predictable but broader DeFi-related regulatory scrutiny. OP's institutional-grade liquidity mitigates execution risk relative to INTER's limited trading pair availability.
Q6: How should investors approach price forecasts for these assets?
A: Price forecasts represent historical volatility modeling outputs rather than predictive guarantees. INTER projects 69% appreciation by 2030 (from $0.3353 to $0.5673 average price), while OP projects 68% appreciation (from $0.2650 to $0.4475 average price). These projections depend heavily on macroeconomic variables, regulatory developments, and technical infrastructure advancement. Investors should implement dollar-cost averaging over 6-12 month periods rather than lump-sum deployment, and should rebalance when Fear & Greed Index exceeds 70 (Greed) or drops below 15 (Extreme Fear). Actual prices may deviate materially from forecasts based on unforeseen circumstances.
III. Ecosystem and Comparative Advantages
Q7: What practical use cases differentiate INTER and OP in their respective ecosystems?
A: INTER functions as an Inter Milan fan token granting governance rights, voting privileges within club ecosystems, and exclusive access to team experiences. Its utility centers on sports entertainment monetization and fan engagement mechanisms. OP serves as the native governance token for the Optimism collective and Layer 2 protocol, enabling protocol governance participation and supporting 97+ integrated protocols including Uniswap, Synthetix, and Velodrome. OP's infrastructure utility extends across DeFi applications, while INTER's utility concentrates within single sports organization ecosystem. OP's broader protocol integration creates more diversified value drivers compared to INTER's sports-specific positioning.
Q8: Should institutional investors consider INTER or focus exclusively on OP?
A: Institutional investors should prioritize OP as their primary Layer 2 exposure given its established infrastructure utility, institutional-grade liquidity across tier-1 exchanges, and relatively predictable regulatory pathway. OP is suitable for tier-2 DeFi allocation mandates within institutional portfolios. INTER is unsuitable for institutional investment due to limited ecosystem diversification, constrained liquidity profile (only 6 trading pairs), and higher regulatory uncertainty surrounding sports-related tokenized securities. For Layer 2 sector allocation, institutional investors should evaluate OP positioning relative to competing solutions (Arbitrum, Polygon) based on specific protocol governance transparency, voting mechanism efficiency, and decision-making process clarity. This comparative analysis enables sophisticated institutional positioning across the Layer 2 scaling solution landscape.
Disclaimer: This analysis provides informational content only and does not constitute investment advice, financial recommendations, or investment solicitation. Cryptocurrency markets exhibit extreme volatility subject to regulatory changes and technological disruptions. Investors must conduct independent research, consult qualified financial advisors, and evaluate personal risk tolerance before making investment decisions. Actual prices may deviate materially from projections based on unforeseen circumstances.
Report Date: December 24, 2025
Share
How to Buy Cryptocurrency


Trending Cryptocurrencies


ATS vs LRC: Comparing Automated Tracking Systems and Learning Resource Centers in Modern Education

DEEP vs OP: Unveiling the Power of Neural Networks in Competitive Gaming

Is Netswap (NETT) a good investment?: Analyzing the Potential and Risks of this DeFi Token

Is Netswap (NETT) a good investment?: Analyzing the potential and risks of this decentralized exchange token

ONX vs LRC: Comparing Two Promising Blockchain Projects in the DeFi Space

2025 DYDX Price Prediction: Analyzing Market Trends and Potential Growth Factors for the DeFi Token
How to Trace Bitcoin Address Owners: A Comprehensive Guide for Financial Institutions

Understanding PNL in the Crypto Space

Does Shiba Inu Coin (SHIB) Reach 1 Cent? Discover How Many Millionaires Would Be Created
Why China is Banning Crypto?
What Are Altcoins? Essential Cryptocurrency Investment Fundamentals for Beginners