PMG vs BCH: A Comprehensive Comparison of Two Blockchain Payment Solutions

Introduction: PMG vs BCH Investment Comparison
In the cryptocurrency market, the comparison between Pomerium (PMG) and Bitcoin Cash (BCH) reveals fundamental differences in market positioning and investment profiles. The two assets operate at vastly different scales—BCH ranks among the top cryptocurrencies by market capitalization, while PMG represents an emerging Web3 gaming platform. Both serve distinct purposes within the broader digital asset ecosystem.
Pomerium (PMG): Launched as a blockchain Web3 game onboarding platform, PMG aims to bridge the gap between Web2 games and the Web3 realm through unique Pomeranian-themed content and original game development.
Bitcoin Cash (BCH): Originating from a Bitcoin hard fork in 2017, BCH is built on an on-chain scaling philosophy featuring 8MB blocks, enhanced transaction signatures, and decentralized development. It has established itself as a significant player in the cryptocurrency ecosystem with substantial market liquidity and adoption.
This analysis will examine key dimensions including market capitalization and dominance, price volatility and historical performance, circulating supply dynamics, exchange availability, and the underlying technical infrastructure supporting each asset. By contrasting these factors, this article provides a comprehensive framework for understanding how PMG and BCH differ as investment vehicles and their respective positioning within the cryptocurrency market landscape.
"What distinguishes these two assets in the current market environment?"
Pomerium (PMG) vs Bitcoin Cash (BCH) Market Analysis
I. Historical Price Comparison and Current Market Status
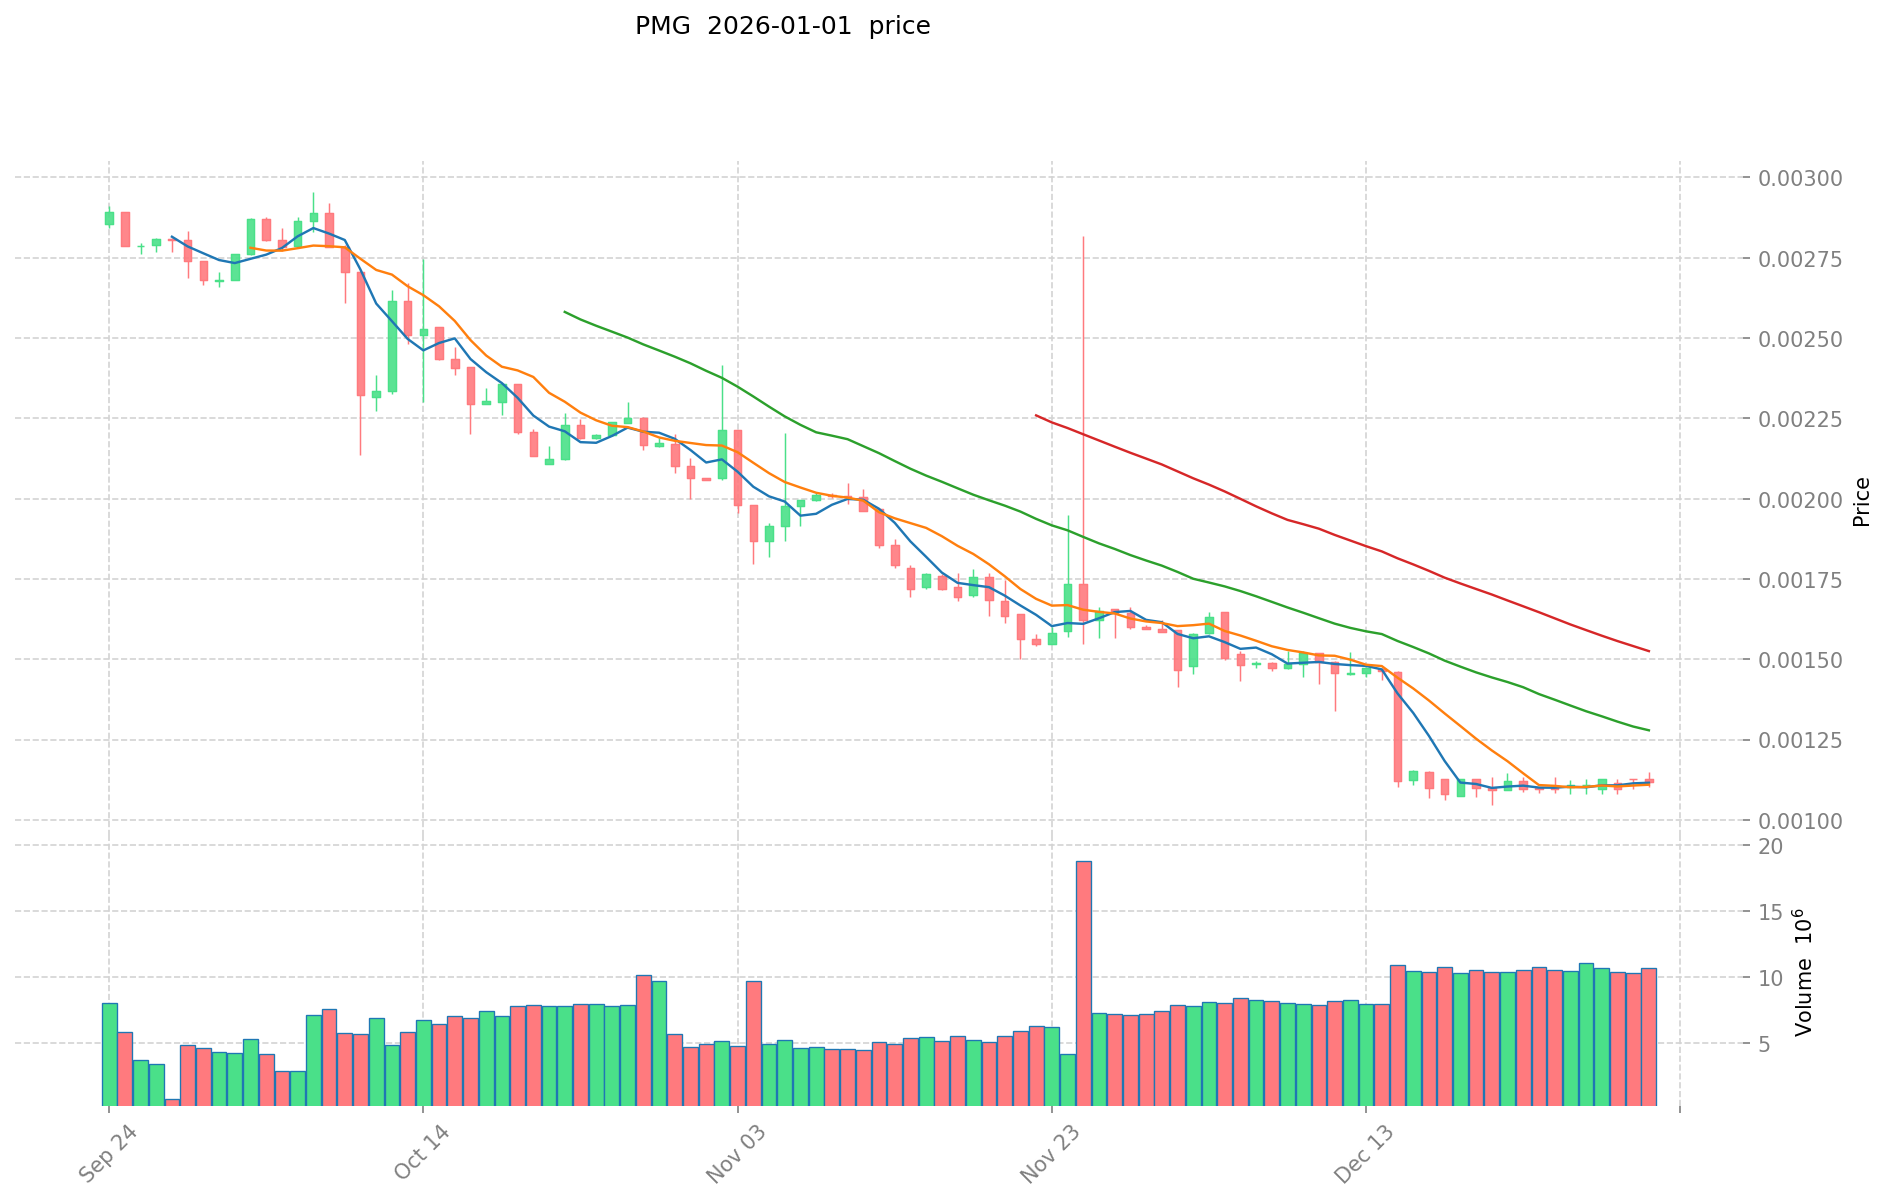
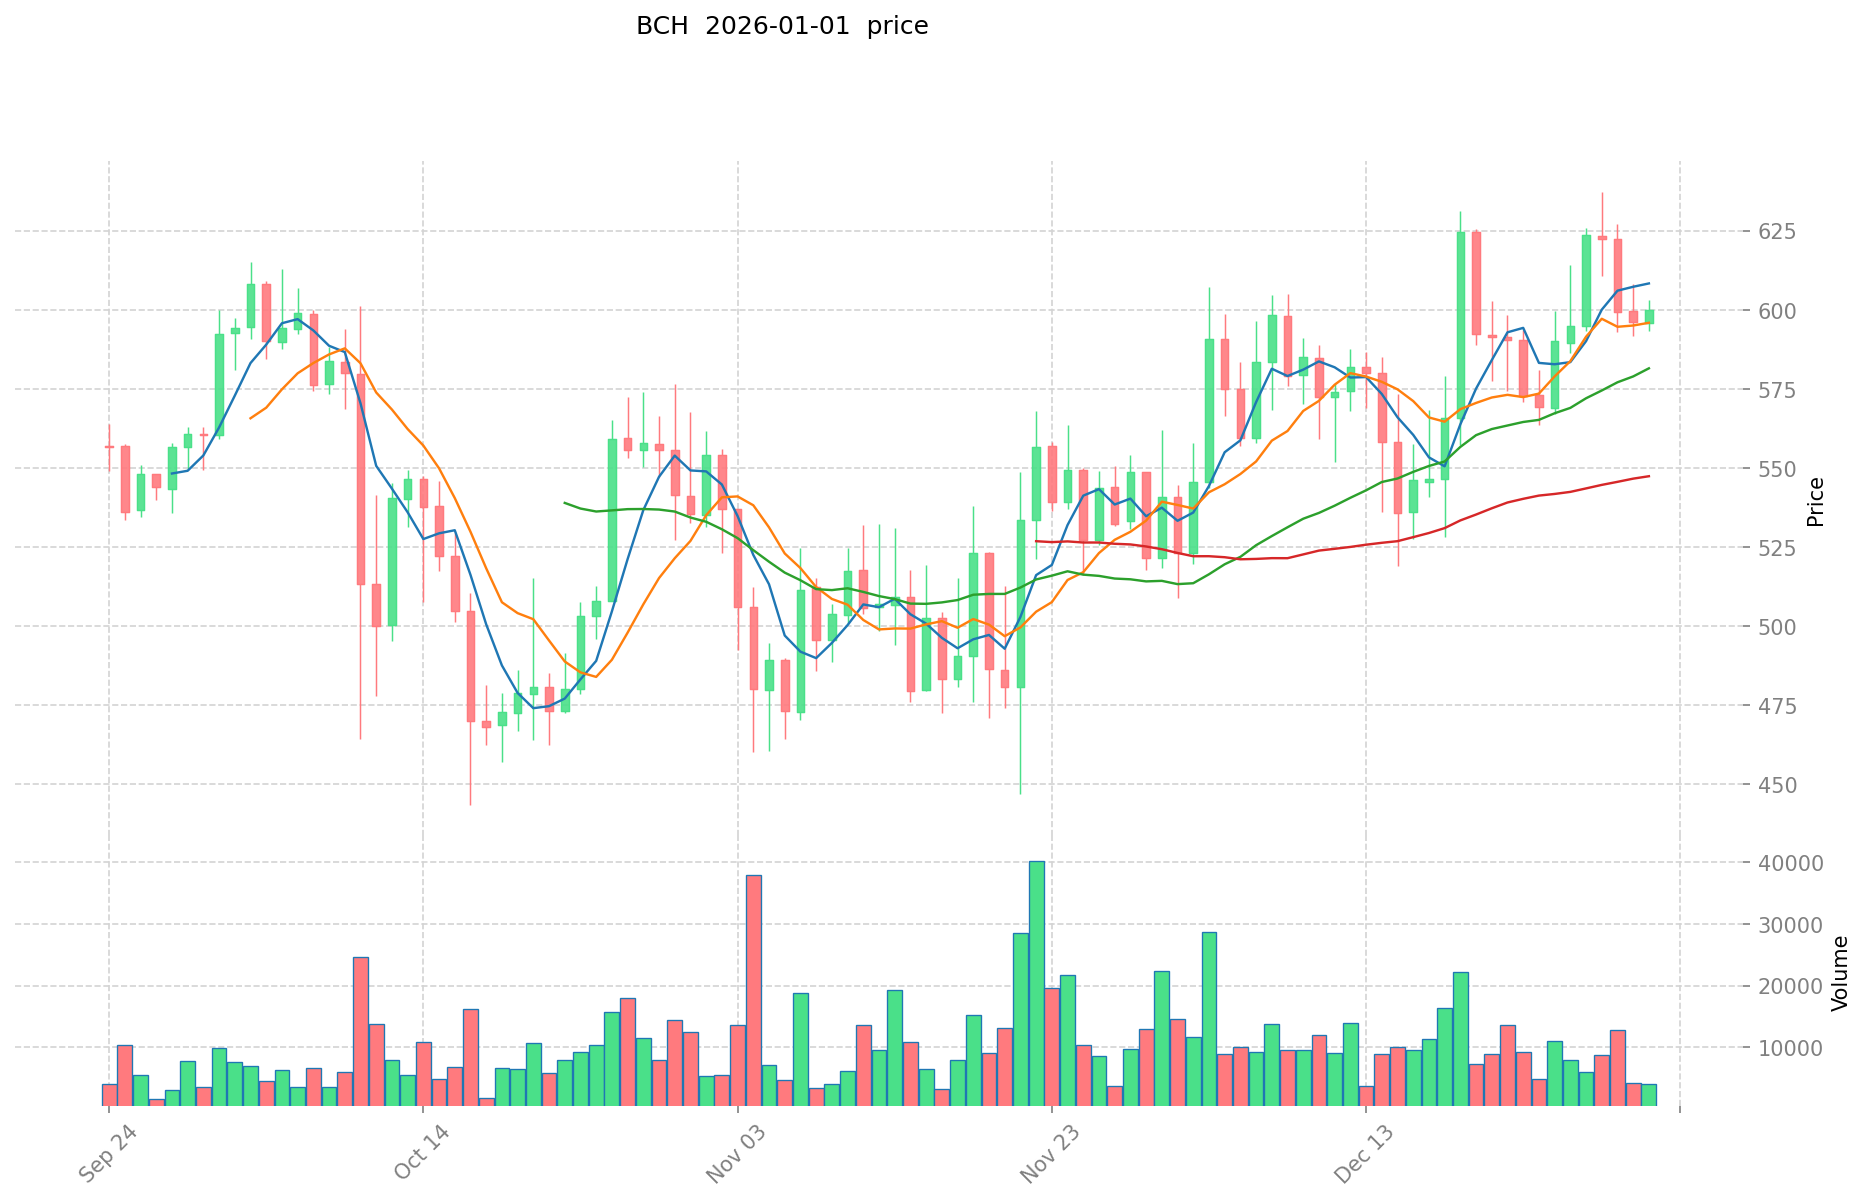
Pomerium (PMG) and Bitcoin Cash (BCH) Historical Price Trends
- 2023: PMG reached its all-time high of $0.29999 on June 29, 2024, driven by platform development and Web3 gaming adoption momentum.
- 2017: BCH emerged from a hard fork of Bitcoin on August 1, 2017, with an initial price of $555.89, driven by the scaling debate and community support for larger block sizes.
- Comparative Analysis: Over the observed period, PMG has experienced significant volatility, declining from its all-time high of $0.29999 to a current level of $0.001102, representing a 96.31% decline over one year. BCH has demonstrated greater price resilience, with an all-time high of $3,785.82 in December 2017 and a current price of $590.55, reflecting the asset's more established market position and liquidity.
Current Market Status (January 2, 2026)
- Pomerium (PMG) current price: $0.001102.
- Bitcoin Cash (BCH) current price: $590.55.
- 24-hour trading volume: PMG $11,879.04 vs BCH $2,392,026.07.
- Market Sentiment Index (Fear & Greed Index): 20 (Extreme Fear).
Click to view real-time prices:
- View PMG current price Market Price.
- View BCH current price Market Price.
II. Core Factors Influencing Investment Value of PMG vs BCH
Tokenomics Comparison
Based on available reference materials, specific tokenomics data for PMG is not provided in the sources. For BCH, the reference materials indicate that BCH operates with a halving mechanism similar to Bitcoin, though detailed supply specifications are not explicitly outlined in the provided resources.
Institutional Adoption and Market Applications
Institutional Holdings: The reference materials do not contain specific information comparing institutional adoption between PMG and BCH.
Enterprise Adoption: According to the provided sources, BCH has demonstrated notable transaction activity metrics. BCH's daily transaction volume is approximately 2 times that of LTC, with average hourly transaction volume similarly exceeding LTC by nearly 2 times. BCH's 24-hour on-chain transfer value is reported to be 4.7 times that of LTC, indicating higher transaction throughput and network utilization compared to certain peer cryptocurrencies.
National Policies: The reference materials do not provide specific policy information regarding PMG or detailed comparative regulatory approaches toward BCH versus other cryptocurrencies.
Technical Development and Ecosystem Construction
BCH Technical Characteristics: BCH enhances transaction processing capacity by increasing block size, thereby reducing transaction fees and accelerating transaction confirmation times. While BCH represents technical innovation in this dimension, the reference materials indicate that long-term investment value requires comprehensive consideration of multiple factors beyond this single feature.
Ecosystem Comparison: The provided sources do not contain comparative information regarding DeFi, NFT, payment infrastructure, or smart contract implementations between PMG and BCH.
Macroeconomic Factors and Market Cycles
Inflation Environment Performance: The reference materials do not provide comparative analysis of how PMG or BCH specifically perform under inflationary conditions or their relative anti-inflation properties.
Monetary Policy Impact: The sources do not contain detailed analysis of interest rate or US dollar index effects on these specific cryptocurrencies.
Geopolitical Factors: The reference materials do not address geopolitical influences on cross-border transaction demand for PMG or BCH.
III. 2026-2031 Price Forecast: PMG vs BCH
Short-term Forecast (2026)
- PMG: Conservative $0.000758 - $0.001115 | Optimistic $0.001115 - $0.001583
- BCH: Conservative $372.267 - $590.9 | Optimistic $590.9 - $744.534
Mid-term Forecast (2027-2029)
- PMG may enter early accumulation phase, estimated price range $0.001309 - $0.001691
- BCH may enter growth phase, estimated price range $487.433 - $1,340.228
- Key drivers: institutional capital inflows, ETF approvals, ecosystem development
Long-term Forecast (2030-2031)
- PMG: Base case $0.001012 - $0.001855 | Optimistic scenario $0.001651 - $0.002764
- BCH: Base case $896.038 - $1,418.727 | Optimistic scenario $1,319.416 - $2,042.967
PMG:
| 年份 | 预测最高价 | 预测平均价格 | 预测最低价 | 涨跌幅 |
|---|---|---|---|---|
| 2026 | 0.0015833 | 0.001115 | 0.0007582 | 1 |
| 2027 | 0.001457082 | 0.00134915 | 0.0013086755 | 22 |
| 2028 | 0.00164164572 | 0.001403116 | 0.00085590076 | 27 |
| 2029 | 0.0016898427546 | 0.00152238086 | 0.0012331284966 | 38 |
| 2030 | 0.002104006467563 | 0.0016061118073 | 0.001011850438599 | 45 |
| 2031 | 0.002764038114772 | 0.001855059137431 | 0.001651002632314 | 68 |
BCH:
| 年份 | 预测最高价 | 预测平均价格 | 预测最低价 | 涨跌幅 |
|---|---|---|---|---|
| 2026 | 744.534 | 590.9 | 372.267 | 0 |
| 2027 | 954.83531 | 667.717 | 487.43341 | 13 |
| 2028 | 1103.3355708 | 811.276155 | 786.93787035 | 37 |
| 2029 | 1340.22820806 | 957.3058629 | 909.440569755 | 62 |
| 2030 | 1688.6875421556 | 1148.76703548 | 896.0382876744 | 94 |
| 2031 | 2042.967295897632 | 1418.7272888178 | 1319.416378600554 | 140 |
IV. Investment Strategy Comparison: PMG vs BCH
Long-term vs Short-term Investment Strategies
- PMG: Suitable for investors focusing on emerging Web3 gaming platform potential and early-stage accumulation opportunities during market downturns
- BCH: Suitable for investors seeking established market presence, greater price stability, and established transaction infrastructure
Risk Management and Asset Allocation
- Conservative Investors: PMG 5% vs BCH 95%
- Aggressive Investors: PMG 25% vs BCH 75%
- Hedging Tools: Stablecoin allocation, options strategies, cross-cryptocurrency portfolio diversification
V. Potential Risk Comparison
Market Risk
- PMG: Significant liquidity constraints with 24-hour trading volume of only $11,879.04, resulting in heightened price volatility and limited exit liquidity during market downturns. The asset has experienced a 96.31% decline from all-time high, indicating substantial speculative risk
- BCH: Established market liquidity with 24-hour trading volume of $2,392,026.07 provides greater stability; however, BCH faces competitive pressure from other payment-focused cryptocurrencies and market share concentration risks
Technical Risk
- PMG: Limited information available regarding network scalability, security audits, and technical infrastructure maturity for Web3 gaming platform operations
- BCH: Increased block size implementation (8MB) presents potential network synchronization challenges; mining centralization risks and ongoing protocol compatibility considerations with Bitcoin ecosystem
Regulatory Risk
Global regulatory frameworks continue evolving toward cryptocurrency classification and taxation. Payment-focused cryptocurrencies like BCH face potential regulatory scrutiny regarding cross-border transaction facilitation. Gaming-related tokens like PMG encounter additional compliance considerations regarding gambling regulations and virtual asset classification across different jurisdictions.
VI. Conclusion: Which Is the Better Buy?
📌 Investment Value Summary:
- PMG Strengths: Emerging Web3 gaming platform positioning, potential early-stage growth trajectory based on 2026-2031 forecasts showing 68% projected increase by 2031, lower entry price point facilitating retail participation
- BCH Strengths: Established market infrastructure, higher liquidity supporting easier position entry/exit, demonstrated transaction processing capacity (4.7x on-chain transfer value compared to peer cryptocurrencies), projected 140% price appreciation through 2031 with greater price stability
✅ Investment Recommendations:
- Beginner Investors: Prioritize BCH for its established market presence, greater liquidity, and reduced volatility, allocating majority portfolio weight to established infrastructure over speculative emerging platforms
- Experienced Investors: Consider BCH as portfolio core holding for stability while maintaining PMG allocation (5-10%) for exposure to emerging Web3 gaming sector opportunities, with strict stop-loss discipline given PMG's volatility profile
- Institutional Investors: Focus on BCH given superior liquidity metrics ($2.39M daily volume), regulatory clarity for payment infrastructure, and institutional-grade market depth; evaluate PMG only after platform achieves significant ecosystem development milestones and demonstrates sustainable trading volume above $100,000 daily threshold
⚠️ Risk Disclaimer: The cryptocurrency market exhibits extreme volatility as evidenced by the current Fear & Greed Index of 20 (Extreme Fear). This analysis does not constitute investment advice. Investors must conduct independent due diligence and consult qualified financial professionals before making investment decisions. Past performance and price forecasts do not guarantee future results.
FAQ
PMG和BCH分别是什么?各自的核心特点是什么?
PMG是贵金属集团代币,BCH是比特币分叉币。PMG聚焦贵金属资产代币化,具有实物背书特性;BCH优化了区块大小,实现快速低费交易,是比特币的扩容方案。
PMG和BCH在技术架构上有什么主要区别?
BCH是比特币的直接分叉,保留原生代码逻辑,支持更大区块容量。PMG采用独立架构设计,具有不同的共识机制和交易确认方式,性能特性差异显著。
PMG和BCH的交易速度和手续费分别如何对比?
PMG交易速度更快,手续费更低,适合频繁交易。BCH交易速度次之,手续费相对较高。PMG在性能上优于BCH。
PMG和BCH在市场认可度和生态应用上哪个更强?
BCH在市场认可度和生态应用上更强,拥有更广泛的挖矿支持、更活跃的开发者社区、以及更成熟的生态应用。PMG相对较新,生态建设仍在发展阶段。
投资PMG和BCH各有什么风险和优势?
PMG风险较高但潜力大,市场波动剧烈,适合风险承受度高的投资者。BCH相对稳定成熟,交易额大,但增长空间有限。选择需根据个人风险偏好判断。
PMG和BCH的发展前景和社区支持度如何对比?
BCH社区活跃度较高,市场表现稳定。PMG作为新兴项目,创新特性突出,发展潜力更大。两者前景各有优势,PMG的技术创新可能带来更多增长机会。
Share
Content
How to Buy Cryptocurrency


Trending Cryptocurrencies


Can Dash Achieve the $1000 Milestone?
ZEREBRO vs BCH: Which Cryptocurrency Offers Better Value for Smart Investors in 2024?
STRM vs LTC: A Comprehensive Comparison of Two Leading Cryptocurrency Payment Solutions

RIZ vs XLM: A Comprehensive Comparison of Two Rising Cryptocurrencies in the Digital Asset Market

NKN (NKN) price soaring: What is the driving force behind the 2025 craze?

Aergo Price Analysis: 112% Surge in 90 Days - What's Next for 2025?

BlockDAG Surpasses $435M in Presale as DOGE and CRO Face Pressure

SEI Completes Falling Wedge Pattern Amid Strong Net Inflows and ETF Progress

Position Reconciliation

DeFi Terminology Deep Dive: Understanding Yield Farming in 4 Minutes
APY (Annual Percentage Yield)
