Anthropic Economic Index Latest Report Analysis: Claude Usage in February 2026
Findings show that the use cases for Claude.ai continue to diversify, with a slight decrease in average task wages. This report is based on research published by Anthropic, translated and edited by Dongqu Dongqu.
(Previous highlight: Anthropic launches AI Impact Dashboard: Enter your profession to instantly see how much AI is replacing your job.)
(Background note: CZ: US crypto trading fees are too high; we still lack competition on the way to becoming the crypto capital.)
Table of Contents
Toggle
- Changes Since Last Report
- Learning Curve
- Chapter 1: Changes Since Last Report
- Diversification of Claude.ai Use Cases
- Emerging Automation Patterns
- Re-examining Geographic Convergence
- Chapter 2: Learning to Use AI
- Model Selection
- Learning Curve
- Discussion
- Footnotes
Using our privacy-protected data analysis system, the Anthropic Economic Index tracks Claude’s overall usage in the economy. This effort aims to understand AI’s economic impact early, giving researchers and policymakers ample time to prepare.
This latest report extends the economic framework established in our previous November 2025 data-based report, analyzing Claude usage in February 2026. The sample covers February 5–12, three months after the release of Claude Opus 4.5, overlapping with the release of Claude Opus 4.6.
First, we note changes compared to the previous report: the proportion of augmented interactions (collaborative interactions where AI assists user capabilities) has slightly increased in both Claude.ai and API traffic. Use cases on Claude.ai are becoming more diverse; the top 10 tasks now account for a smaller share of total usage than in November 2025. Due to this diversification, the average wages per conversation on Claude.ai are slightly lower than in the previous report.
Next, we focus on a key factor influencing Claude’s impact on the labor market and broader economy: the learning curve during Claude adoption. Evidence shows that more experienced users have developed more effective habits and strategies for leveraging Claude’s capabilities. Our data indicates that seasoned users not only attempt higher-value tasks but also tend to receive more successful responses in conversations.
Changes Since Last Report
In Chapter 1, we revisit findings from the January 2026 economic index report. Key conclusions:
- Claude.ai use case diversification. Code-writing tasks continue to shift from Claude.ai’s augmented interactions toward more automated workflows in our first-party API traffic. The concentration of Claude.ai use has decreased: the top 10 O*NET tasks accounted for 19% of conversations in February, down from 24% in November. Despite this, nearly all tasks appeared in our previous sample. About 49% of occupations have at least a quarter of tasks completed with Claude.
- Expansion into lower-wage tasks. As use cases diversify, the average economic value of Claude work, measured by relevant US occupational wages, has slightly declined. This reflects increased personal queries like sports, product comparisons, and home repairs. This pattern aligns with the standard “adoption curve”: early adopters focus on high-value coding tasks, while later adopters include a broader range of task types.
- Persistent global usage inequality. Usage remains highly concentrated: the top 20 countries account for 48% of per capita usage, up from 45%, indicating ongoing global adoption gaps. However, within the US, per capita usage is converging: the share of the top 10 states has decreased from 40% to 38% since the last report.
Learning Curve
A core finding of the index is that early adoption of Claude was highly uneven—more intensive in high-income countries, concentrated in regions with more knowledge workers within the US, and involving only a limited set of professional tasks.
A key question is how adoption inequality influences the distribution of AI benefits. For example, if effective use of AI requires complementary skills and expertise (as argued in our previous report), and such skills can be learned through use and experimentation, then early adopters may enjoy self-reinforcing advantages.
In Chapter 2, we explore how users shape the value they extract from Claude: how they match model capabilities to current tasks, and how usage patterns and effectiveness evolve with platform experience.
- Model choice and task matching. We find that users tend to select our most capable model series—Opus—for tasks that typically command higher salaries in the labor market. For example, among paid Claude.ai users, Opus is used 4 percentage points more often than average for coding tasks, but 7 points less for tutoring-related tasks. This pattern is even more pronounced in API usage.
- Longer experience, more work tasks. Users with longer tenure on Claude.ai are more likely to use it for work. Users with over 6 months of platform experience are 7 percentage points more likely to use Claude for work, and their tasks tend to require higher education levels.
- Learning by doing. More experienced users achieve higher success rates in conversations. Even after controlling for task type and geography, their success probability is 3–4 percentage points higher.
Chapter 1: Changes Since Last Report
Diversification of Claude.ai Use Cases
We analyze Claude’s task types by mapping each conversation to tasks listed in the US Bureau of Labor Statistics’ O*NET database, using privacy-preserving methods to describe overall behavior without exposing individual dialogues.
Samples of one million conversations each are drawn from Claude.ai (our consumer interface) and our first-party API (developer platform).
Coding remains the most common use case, with computer and math-related tasks accounting for 35% of Claude.ai conversations.
Between November 2025 and February 2026, task concentration on Claude.ai decreased: the top 10 O*NET tasks accounted for 19% of conversations in February, down from 24% in November. This decline is partly due to code-writing tasks migrating to the API, where the proxy design of Claude Code breaks down coding into many independent API calls. Despite increased code-related activity in the API, overall task distribution remains relatively stable.
This migration only explains part of the decrease in concentration. The composition of use cases has also shifted: academic-related conversations dropped from 19% to 12%, while personal use increased from 35% to 42%. The decline in academic queries partly reflects winter academic breaks in some regions. Additionally, February saw a surge in new user registrations, bringing more leisure-oriented users.
The diversification of workplace tasks built on existing patterns. Our early report noted that 49% of occupations used Claude for at least a quarter of tasks; this metric has remained stable. The emergence of new O*NET tasks has slowed compared to early growth.
Since our first report, we have classified dialogues into five interaction types—directive, feedback loop, iterative task, verification, and learning—and grouped these into automation and augmentation categories. Augmentation use on Claude.ai has slightly increased, driven mainly by small growth in verification and learning modes. Automation use in the API has decreased significantly.
The concentration of computer and math tasks in the API has increased: since August 2025, this category grew by 14% in the API but decreased by 18% on Claude.ai. Our concurrent labor market analysis suggests this shift may signal more direct occupational impacts. The proportion of managerial tasks on Claude.ai rose from 3% to 5%, including analysis tasks like preparing investment memos and client responses.
We measure task value by the average hourly wage of relevant US workers. The average task value on Claude.ai has slightly declined from $49.30 to $47.90, mainly due to increased simple factual queries (sports, weather) and code migration. Our early analysis indicated that Claude tasks generally require above-average education levels, corresponding to higher-than-average wages.
Between the two reports, several key indicators show a decline in the average complexity of Claude.ai tasks. The average education level needed for typical manual input dropped from 12.2 to 11.9 years; users assign more autonomy to Claude; estimated time to complete tasks independently has shortened by about 2 minutes. Meanwhile, the difficulty of completing tasks without AI assistance has slightly increased.
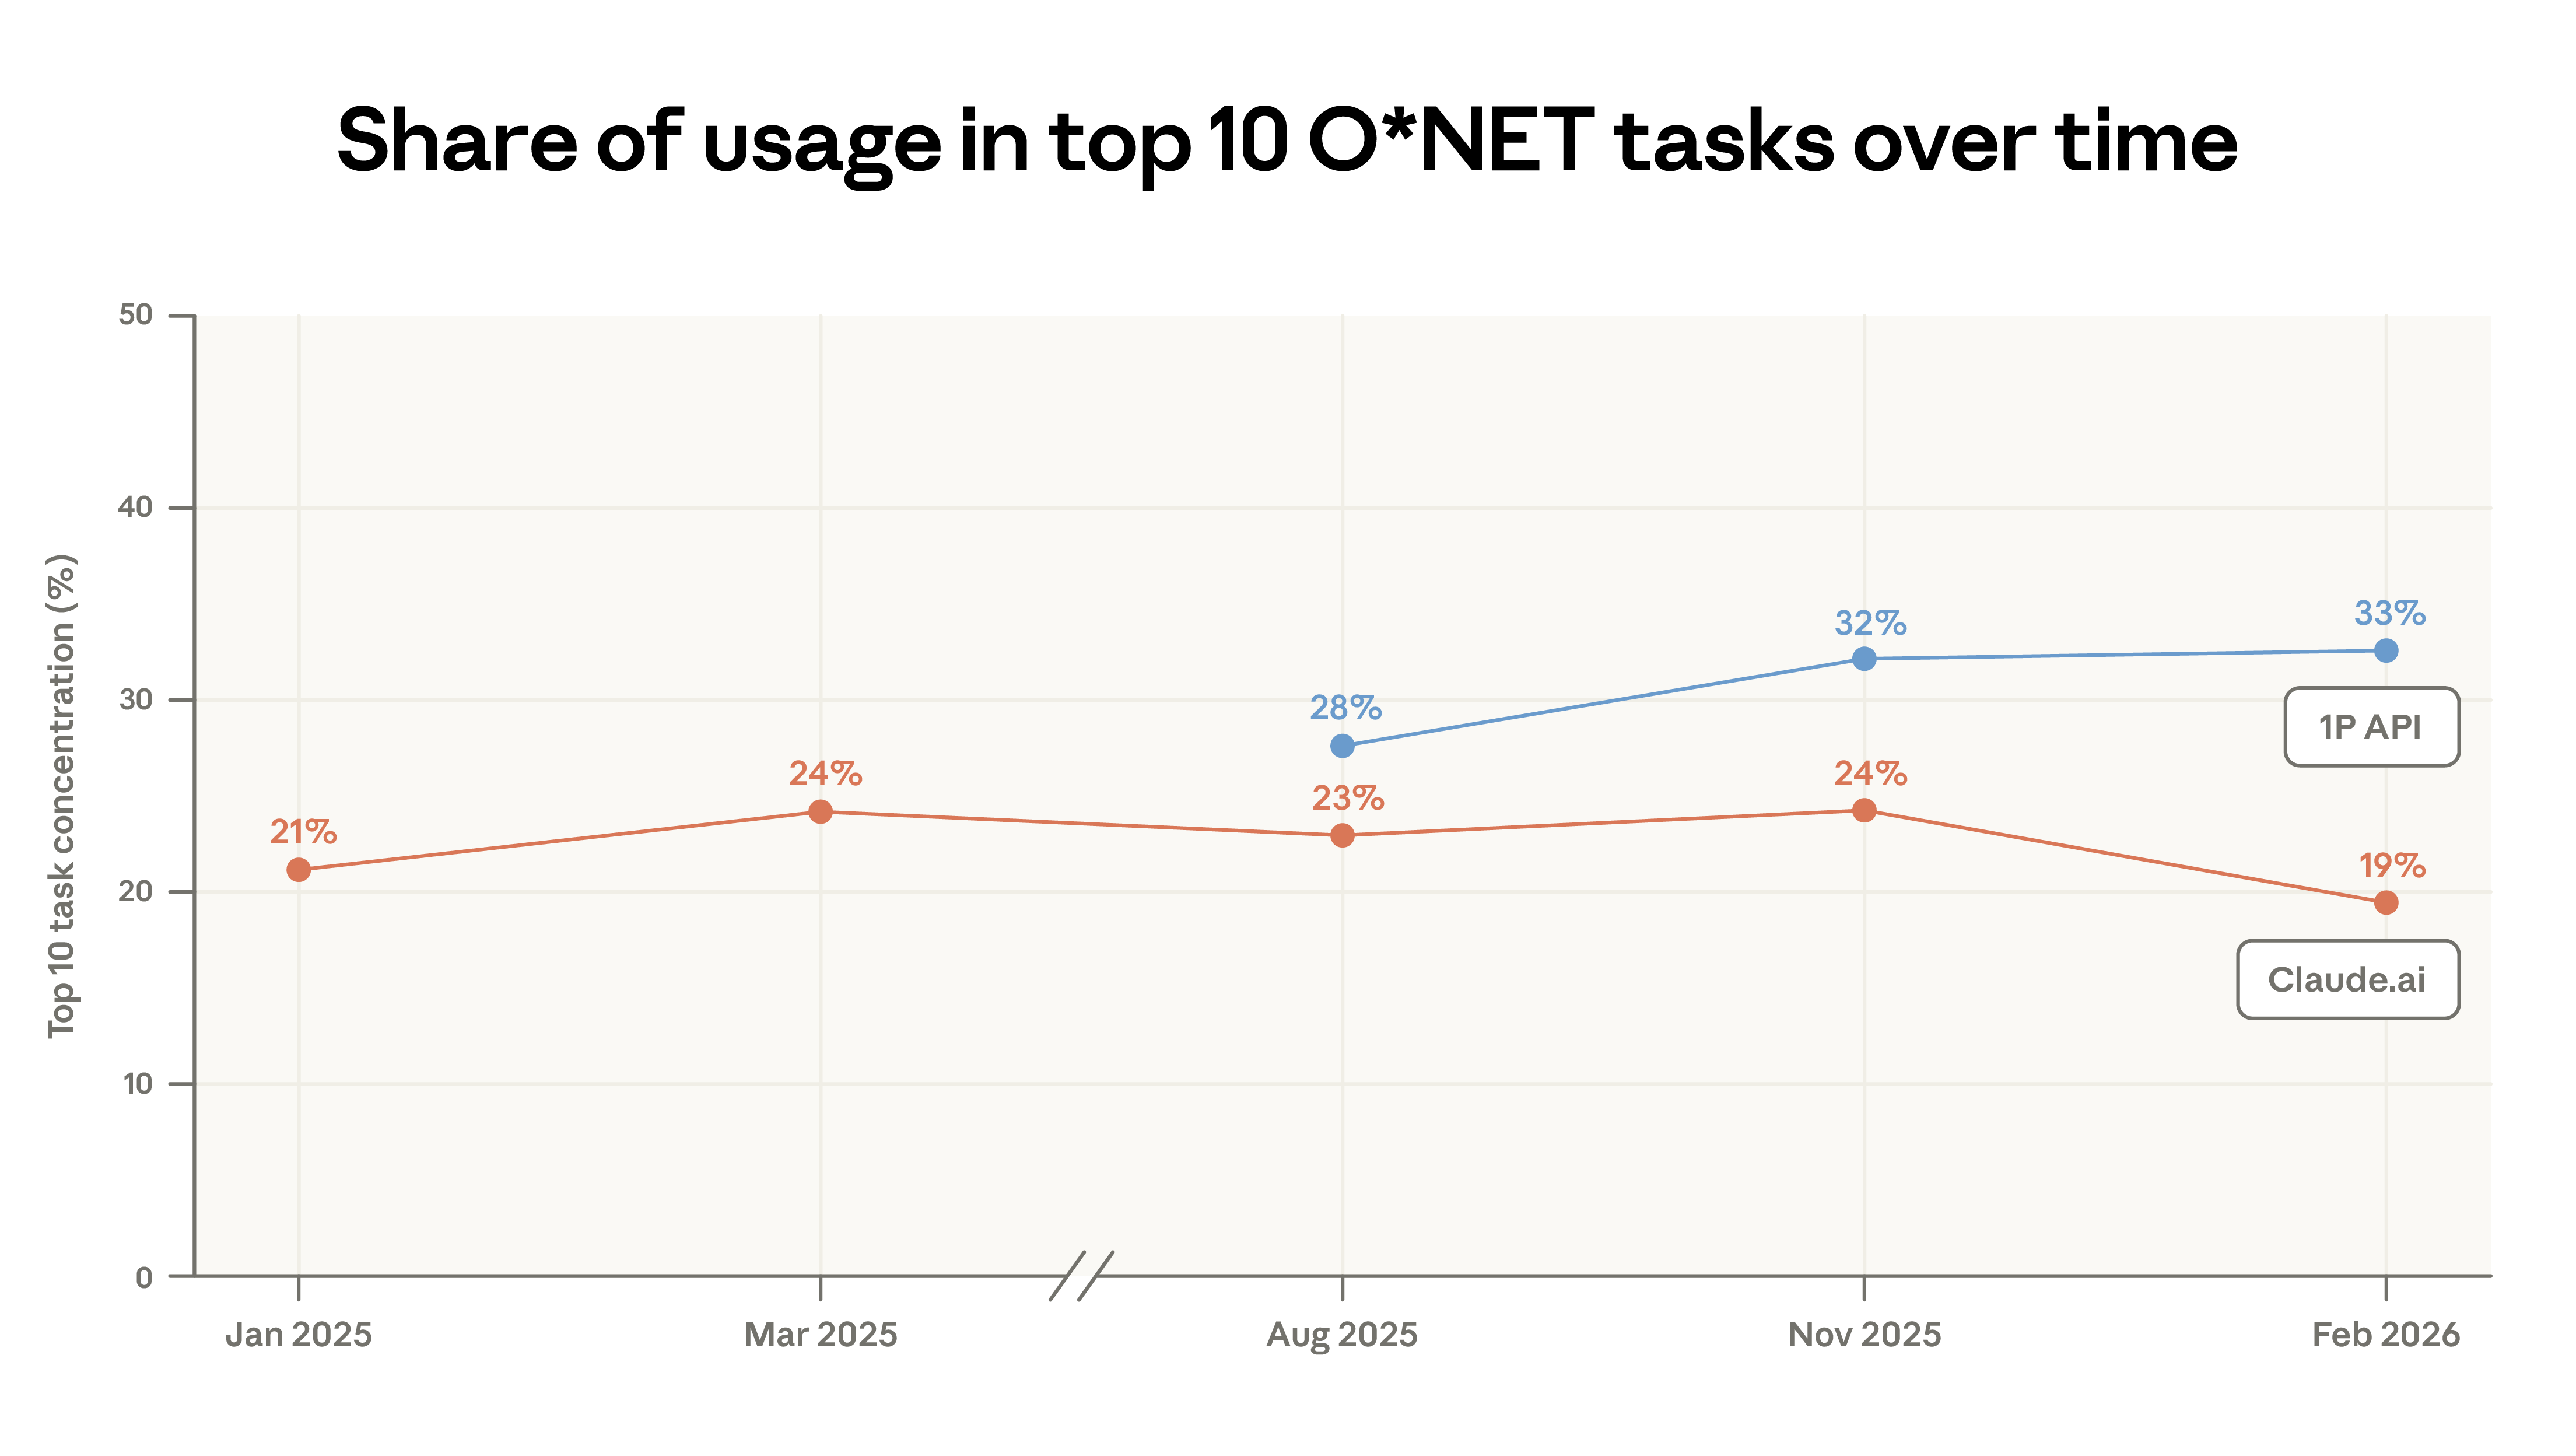
Figure 1: Changes in concentration of top 10 tasks on Claude.ai and API, illustrating diversification on Claude.ai and increased concentration in API
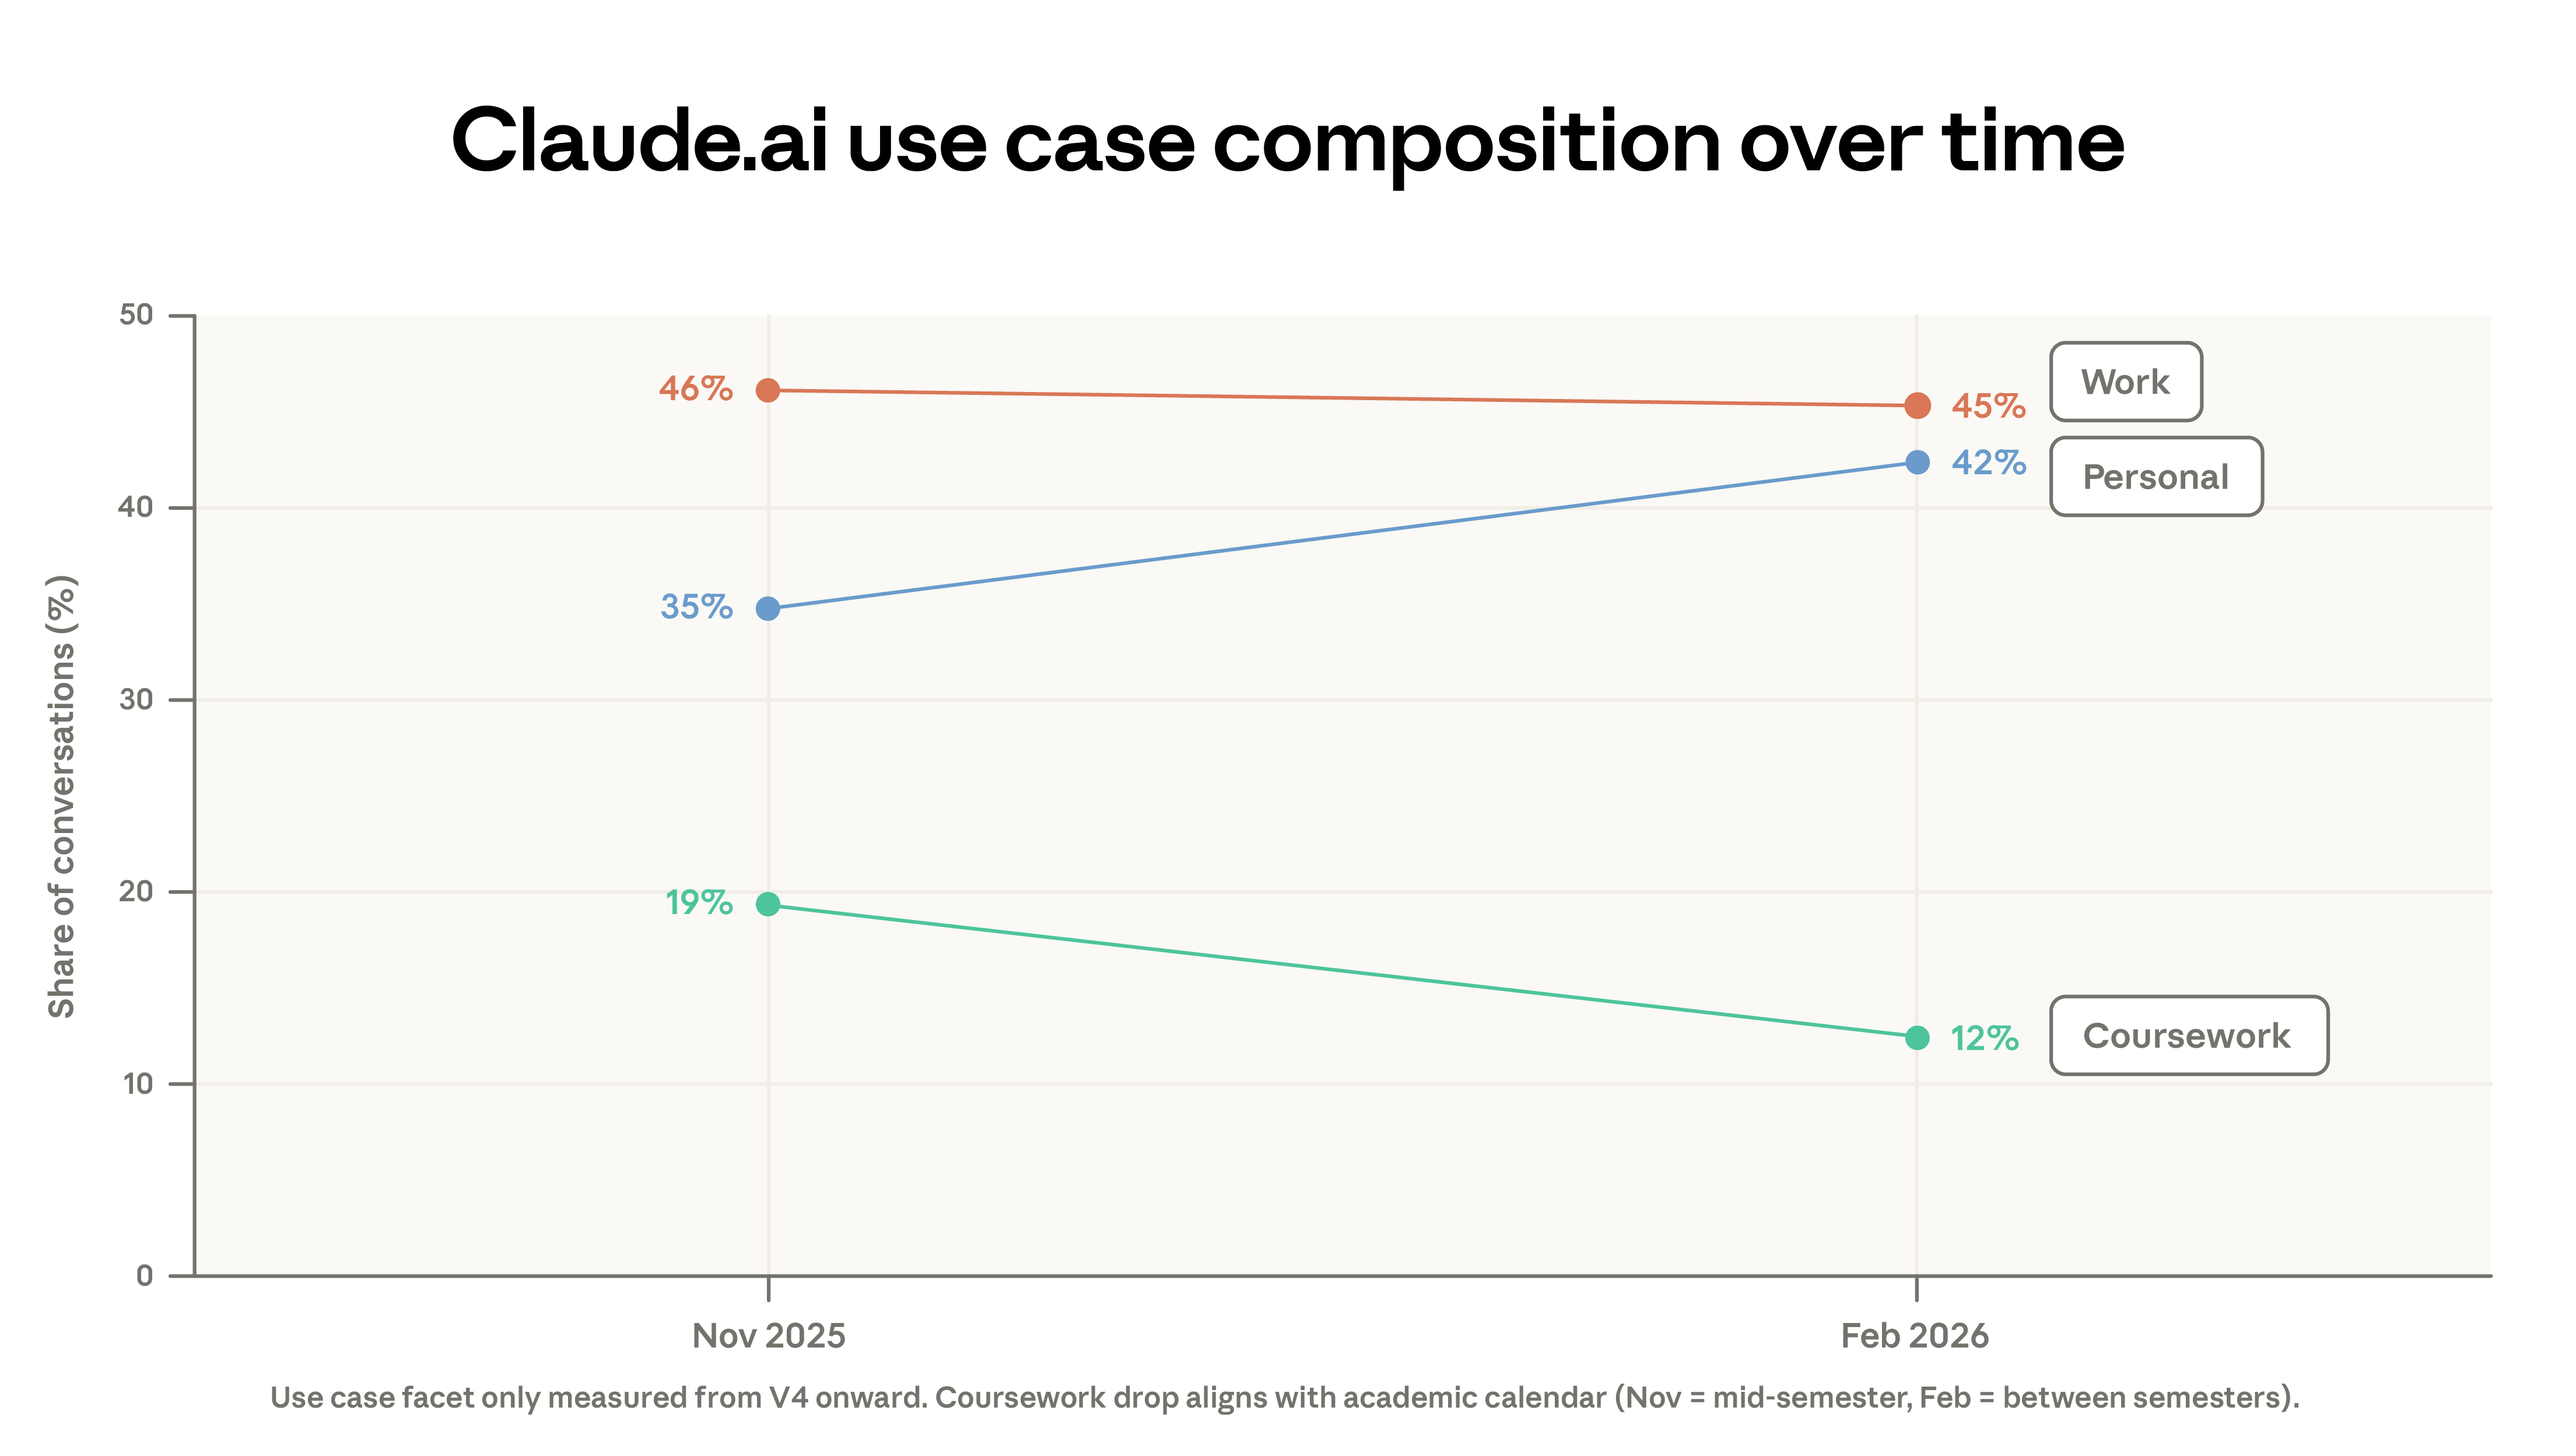
Figure 2: Distribution of Claude task value measured by US occupational wages, showing a slight decrease from $49.30 to $47.90
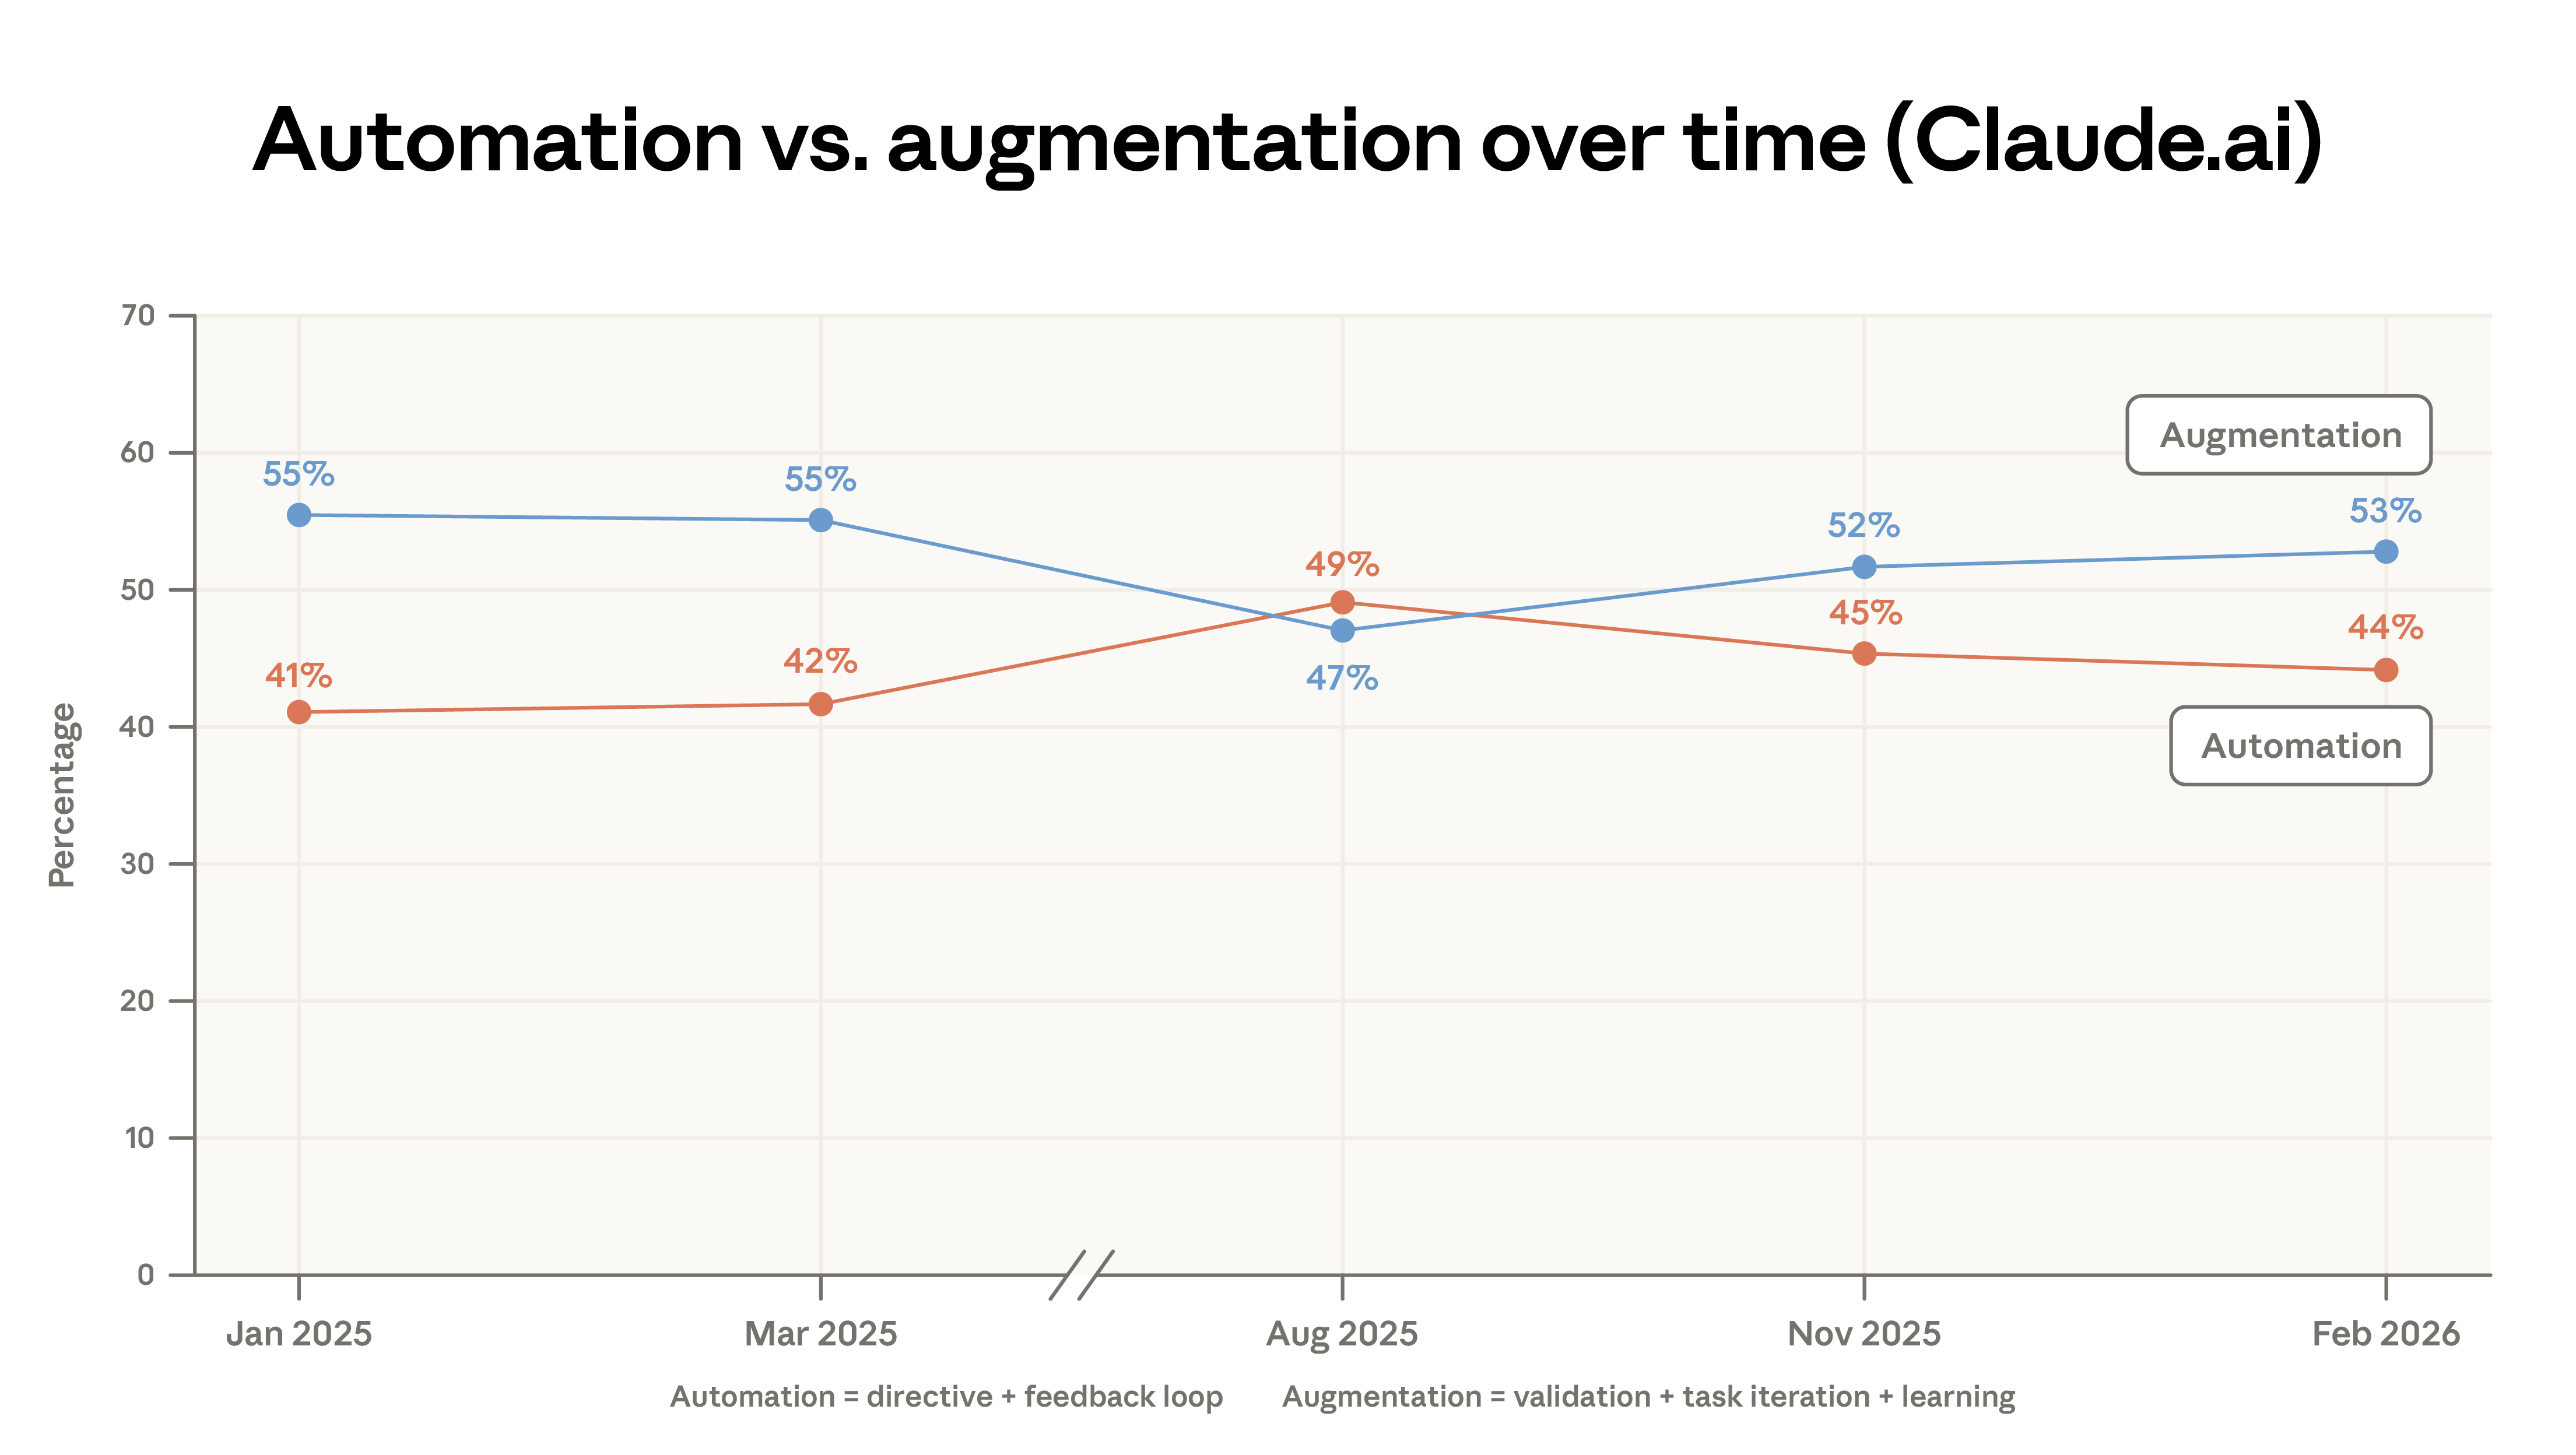
Figure 3: Comparison of task category distributions between Claude.ai and API, highlighting migration of coding tasks from Claude.ai to API
Emerging Automation Patterns
As more tasks migrate to the API, exposure to automation increases. API workflows are mainly directive, with minimal human intervention. We previously emphasized the ubiquity of customer service applications—including automated payments and billing support—indicating high exposure for customer reps, potentially accelerating occupational change.
Two API workflow types have roughly doubled in frequency during the sample period:
- Business sales and outreach: automating sales support content, researching B2B prospects, enriching customer info, and composing cold emails
- Automated trading and market operations: monitoring markets and positions, providing investment advice, and reporting market conditions to traders
Re-examining Geographic Convergence
Our early report noted that the Anthropic AI Usage Index (population-adjusted) rapidly converged across US states, with initially low-adoption states catching up quickly.
Current data confirms continued convergence, but at a slower pace. From August 2025 to February 2026, the top five states’ per capita usage share decreased from 30% to 24%. Since August 2025, the Gini coefficient has declined, but the rate of convergence has slowed. Our updated forecast estimates that it will take about 5–9 years for all states to reach equal per capita usage, compared to an earlier estimate of 2–5 years.6
Internationally, the situation is opposite: concentration has increased, with the Gini coefficient rising. The most active countries now account for a larger share of total usage, with the top 20 countries’ per capita adjusted usage rising from 45% to 48%.
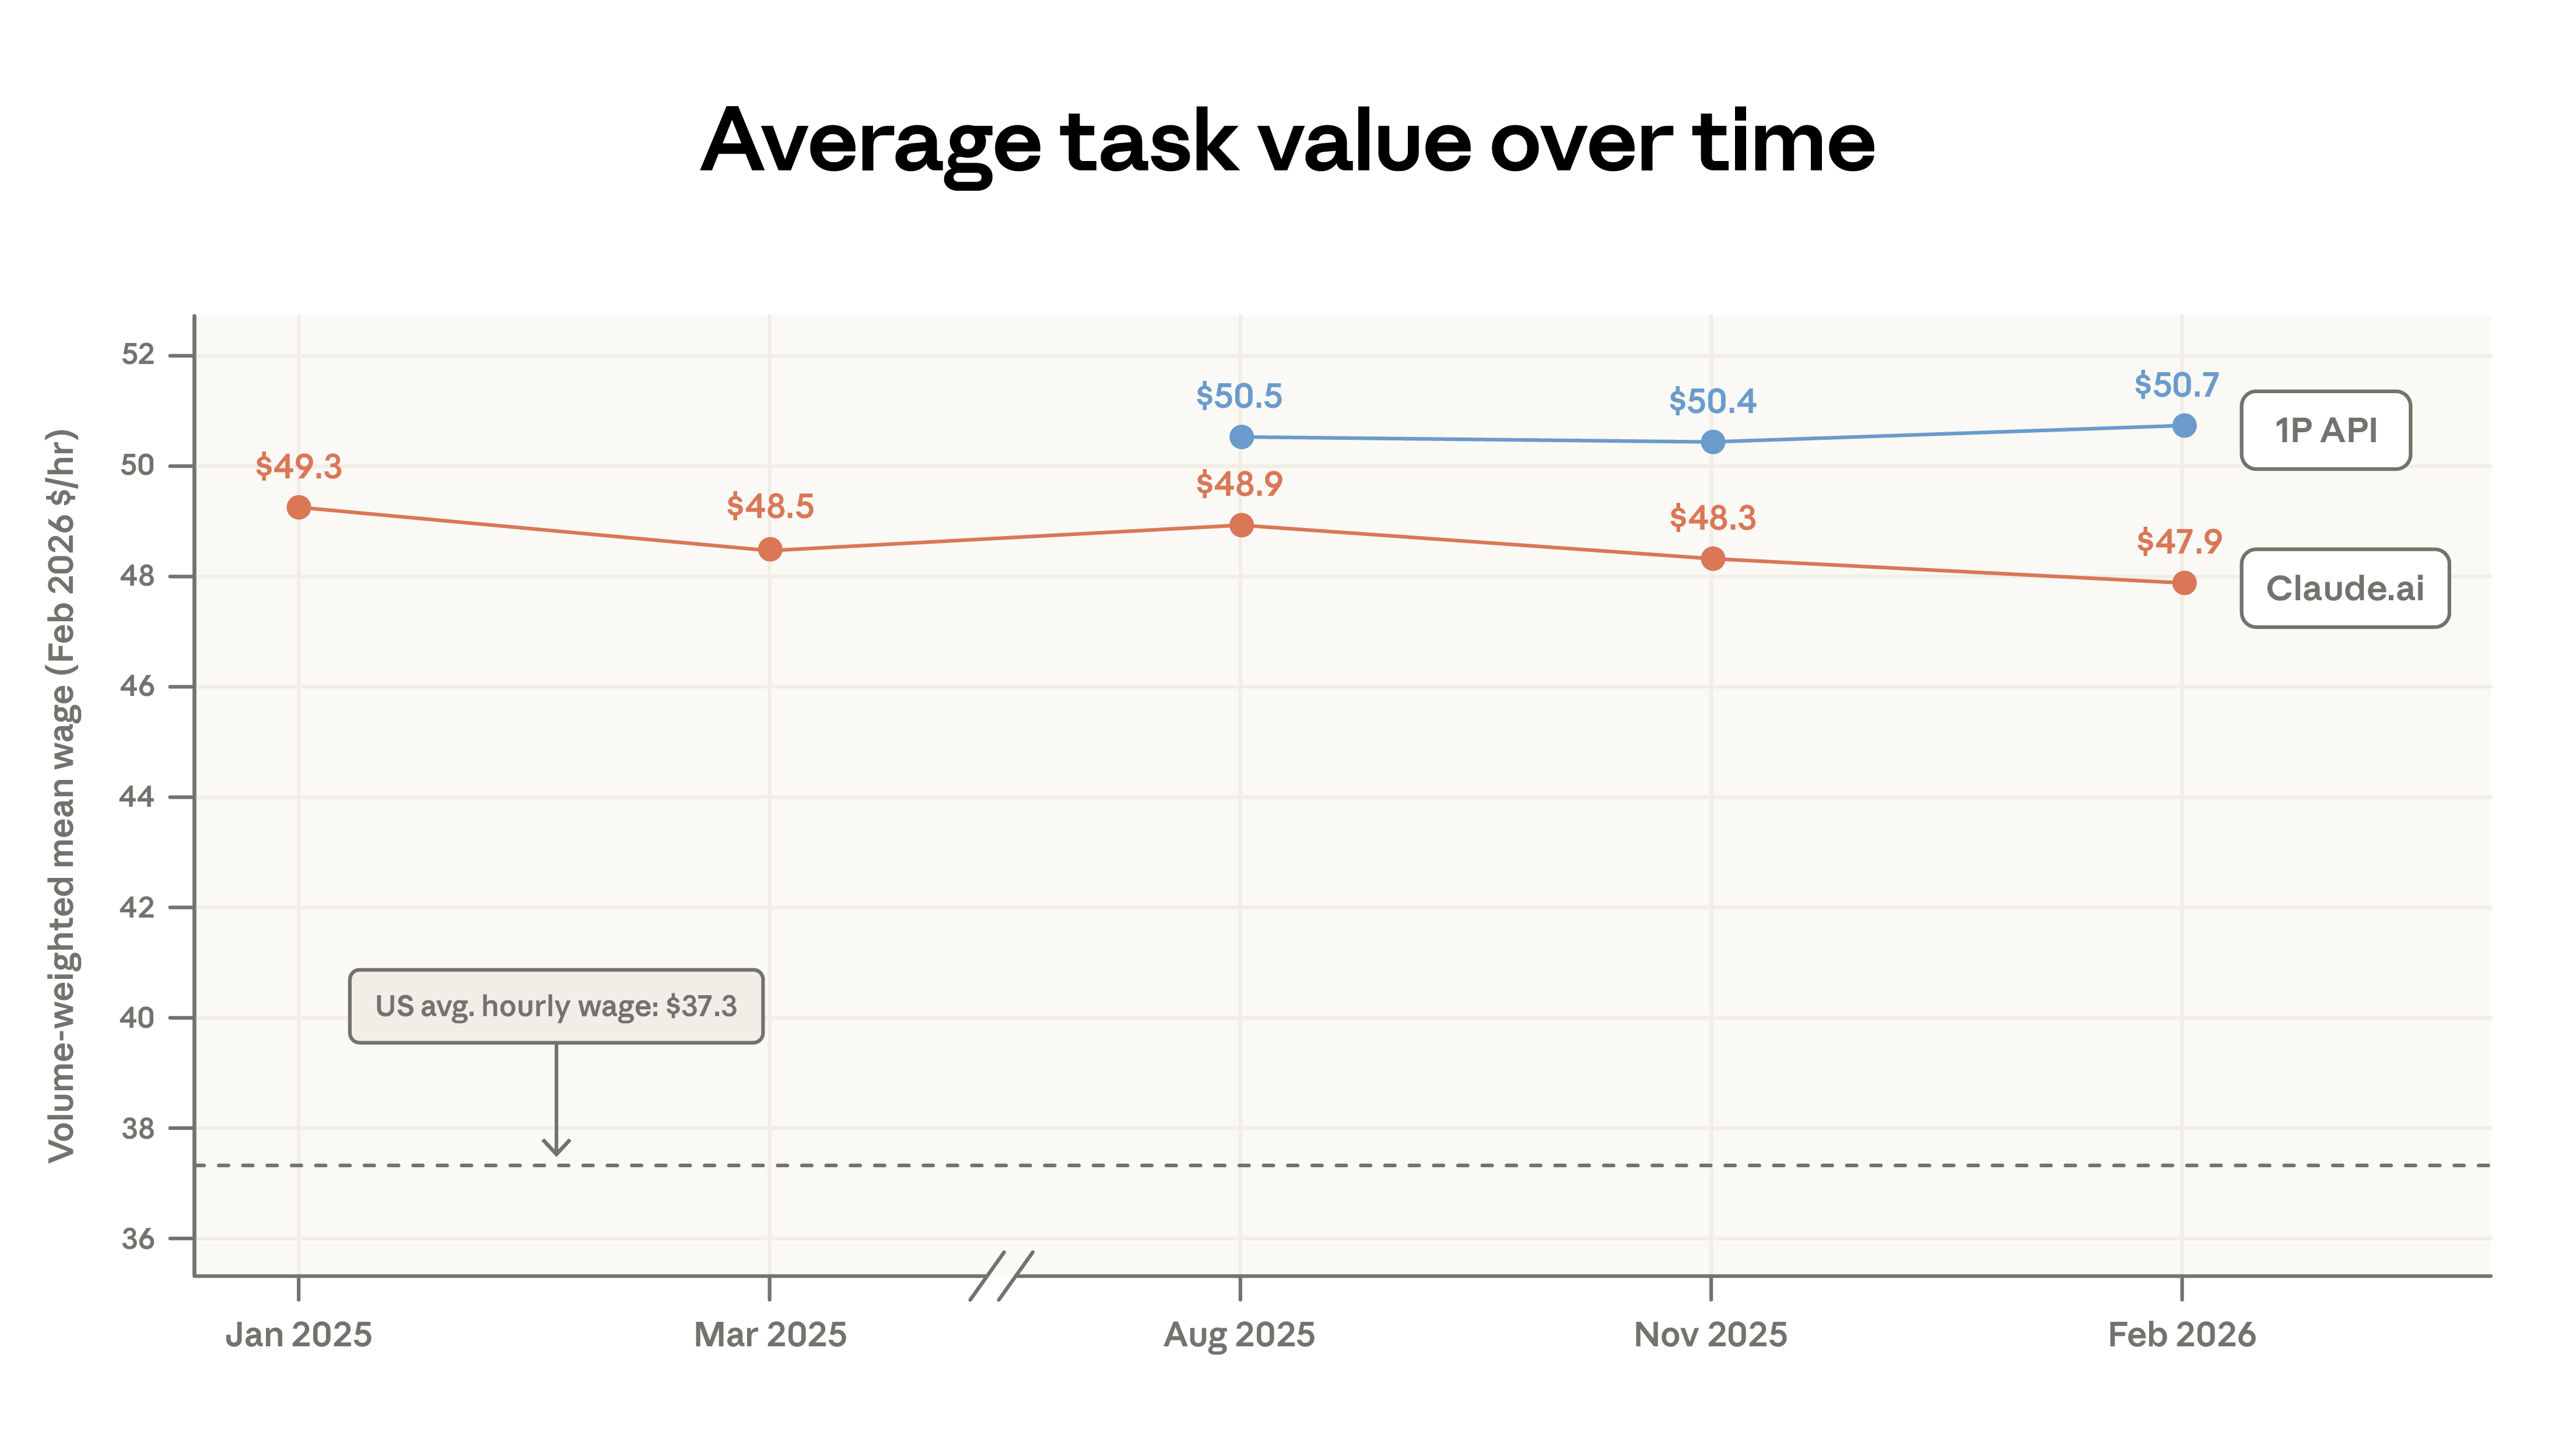
Figure 4: Convergence trend of per capita Claude usage across US states, with top five states’ share dropping from 30% to 24%, at a slower pace
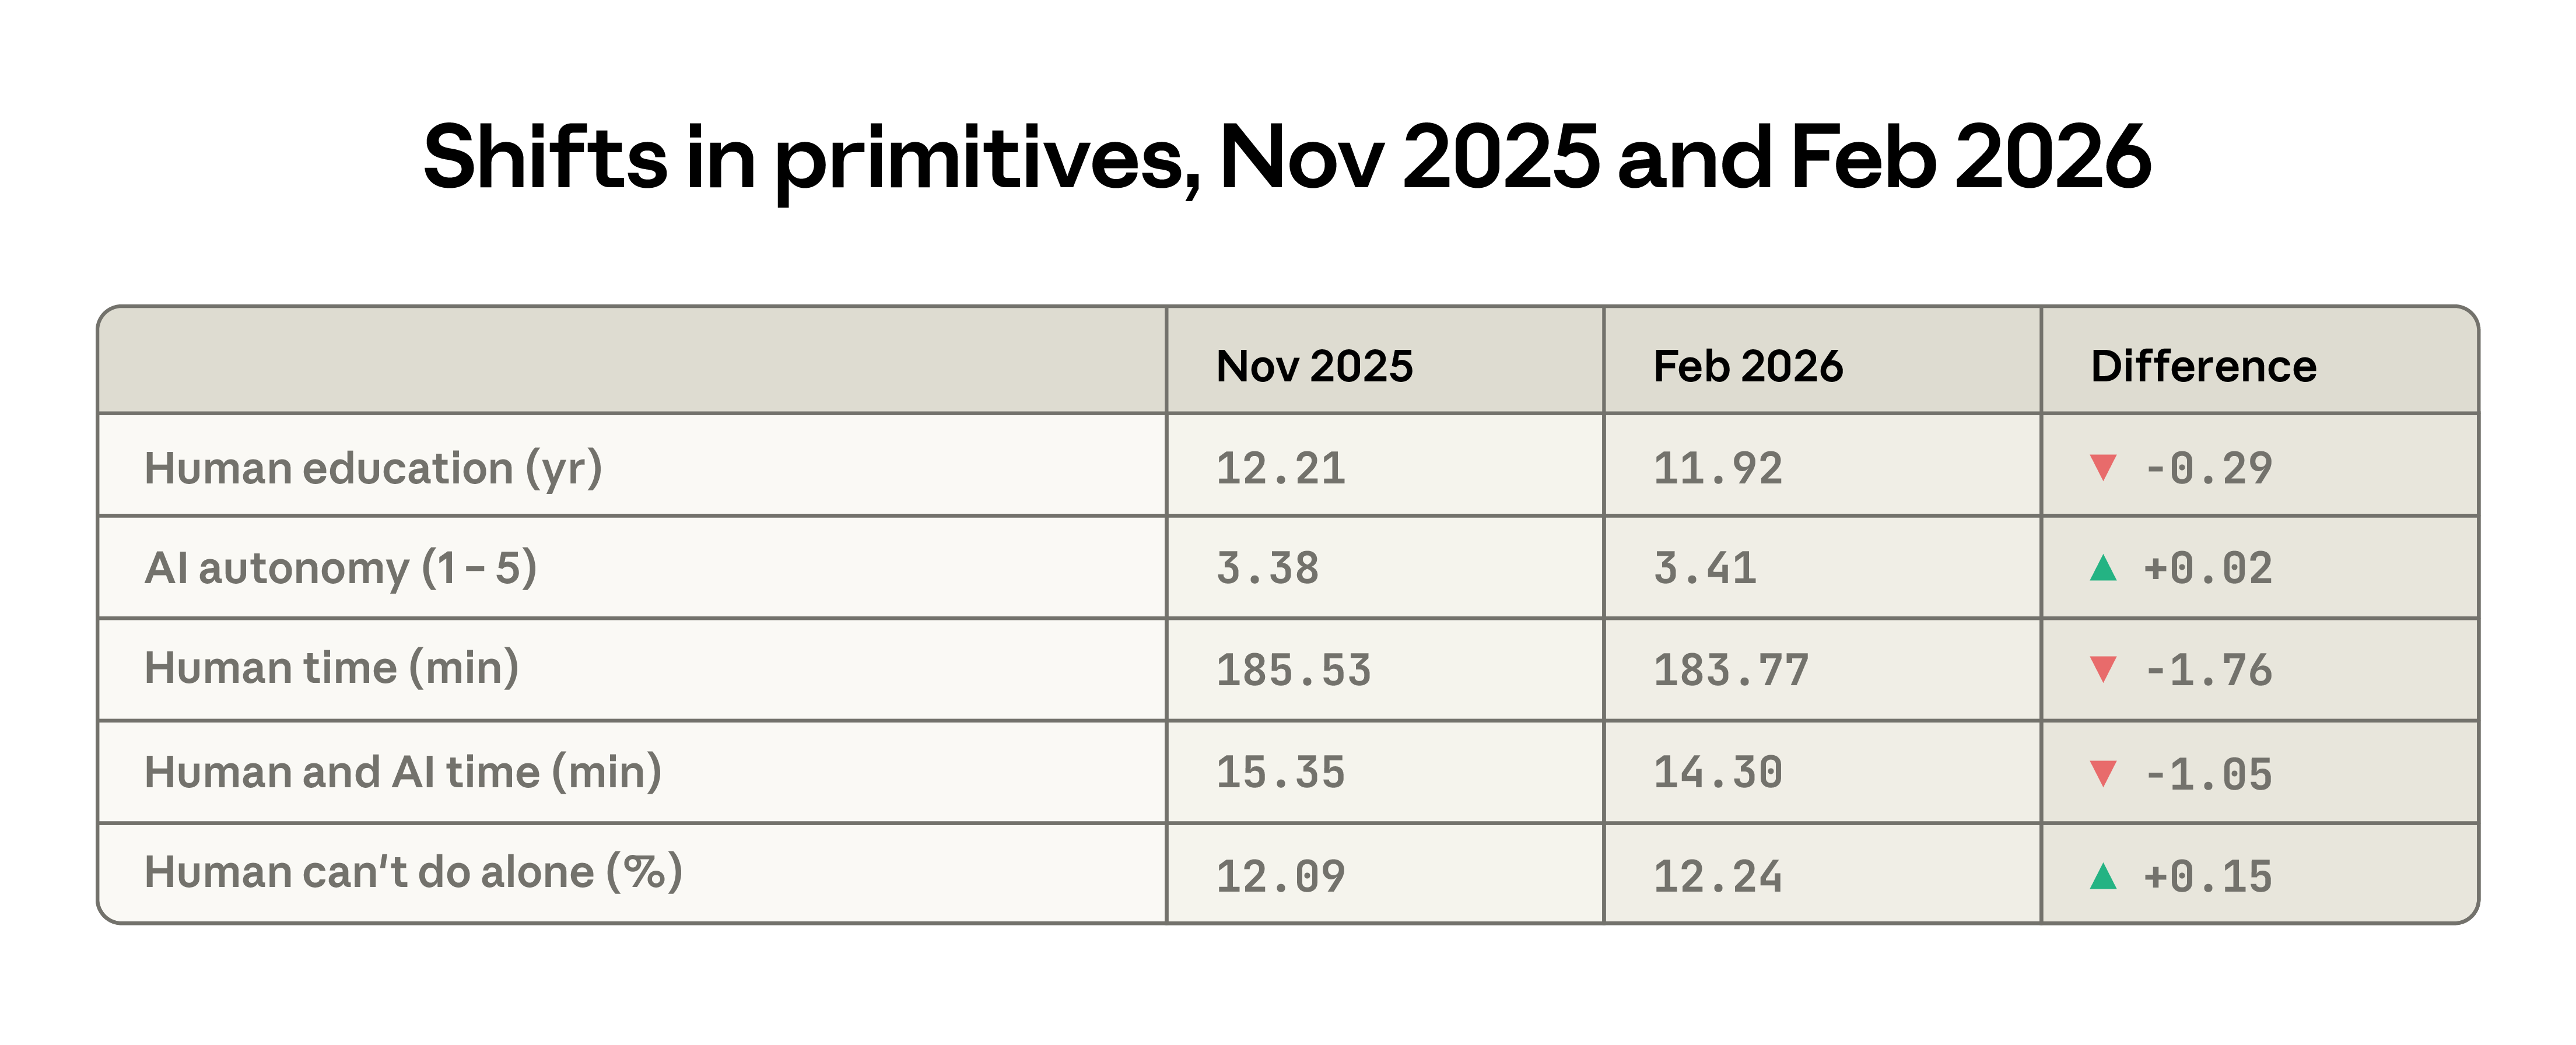
Figure 5: International Gini coefficient of Claude usage by country, indicating increased global inequality compared to previous report
Chapter 2: Learning to Use AI
This chapter explores two features reflecting how users deploy and learn to leverage AI: model selection and patterns among more experienced users.
The first is model choice, revealing insights into perceived intelligence needs. Little prior research exists on user behavior in multi-model environments where trade-offs among speed, performance, and cost are possible. The tendency to select Opus for high-value tasks likely reflects deliberate allocation of more difficult, costly tasks to the most capable model.
The second examines usage differences by experience level, based on user tenure with Claude.ai, aiming to reveal learning curves. Do users become more proficient over time? How do their usage patterns change? Evidence aligns with “learning by doing”: more experienced users perform better, collaborate more deeply, attempt more challenging tasks, and diversify their work scenarios.
Model Selection
Claude’s model series—Haiku, Sonnet, and Opus—each balance cost, speed, and performance differently. Opus has the highest context limit and excels at complex tasks but is also the most expensive per token. Cost-conscious users near usage limits tend to reserve Opus for difficult, high-value tasks, choosing alternatives for simpler work. This pattern matches our data observations.3
Among paid Claude.ai users across all models, 55% of computer and math tasks (like coding) use Opus, compared to only 45% for educational tasks.
Technical users may recognize performance advantages and proactively switch from the default Sonnet. Efficiency-minded users might use Sonnet for routine tasks to conserve quota. These differences may also reflect the relative simplicity of educational tasks or higher cost sensitivity among students.
More detailed analysis shows a correlation between higher-paying occupations and Opus use. For example, software developers’ Opus usage is 34%, while tutoring tasks are only 12%. After controlling for other factors, each $10 increase in hourly wage correlates with a 1.5 percentage point increase in Opus share in Claude.ai conversations. The sensitivity in the API is roughly twice as high: a $10 wage increase raises Opus share by 2.8 points. Users implementing automated workflows are more likely to switch models than those using the web interface.
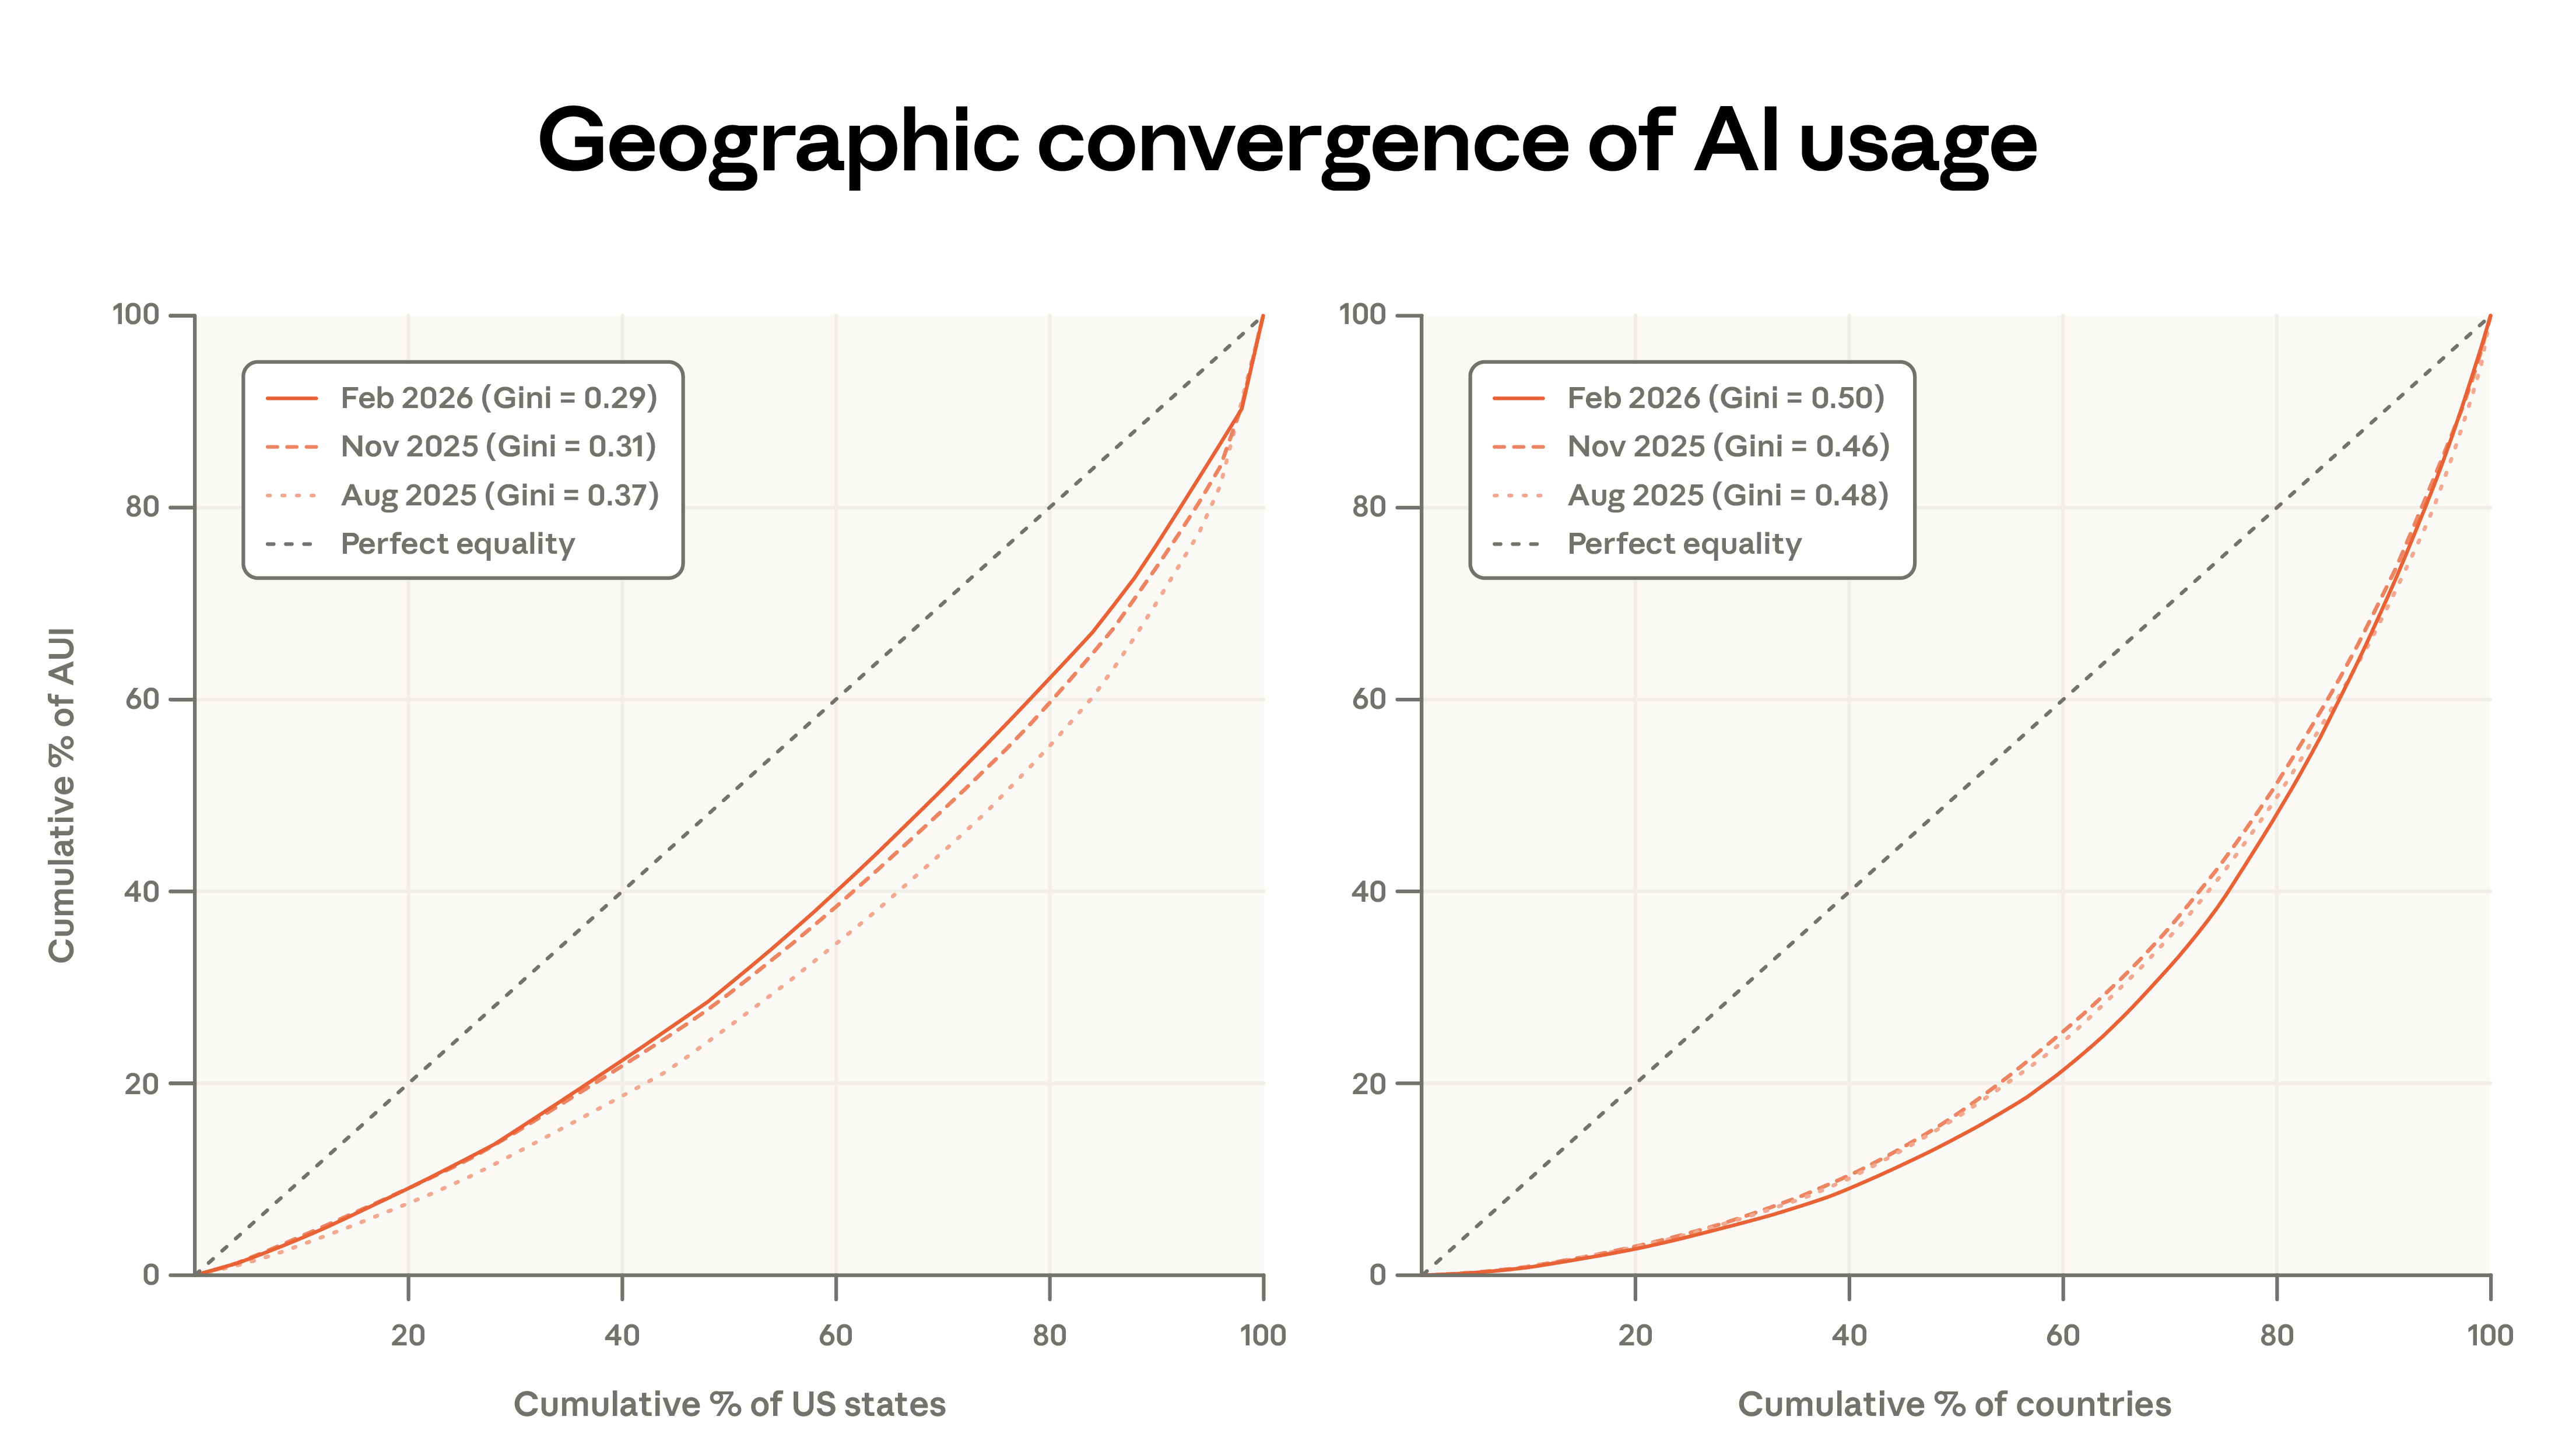
Figure 6: Opus model choice proportions by task type, showing higher-income, technical tasks (like software development) favor Opus, while educational tasks have lower Opus usage
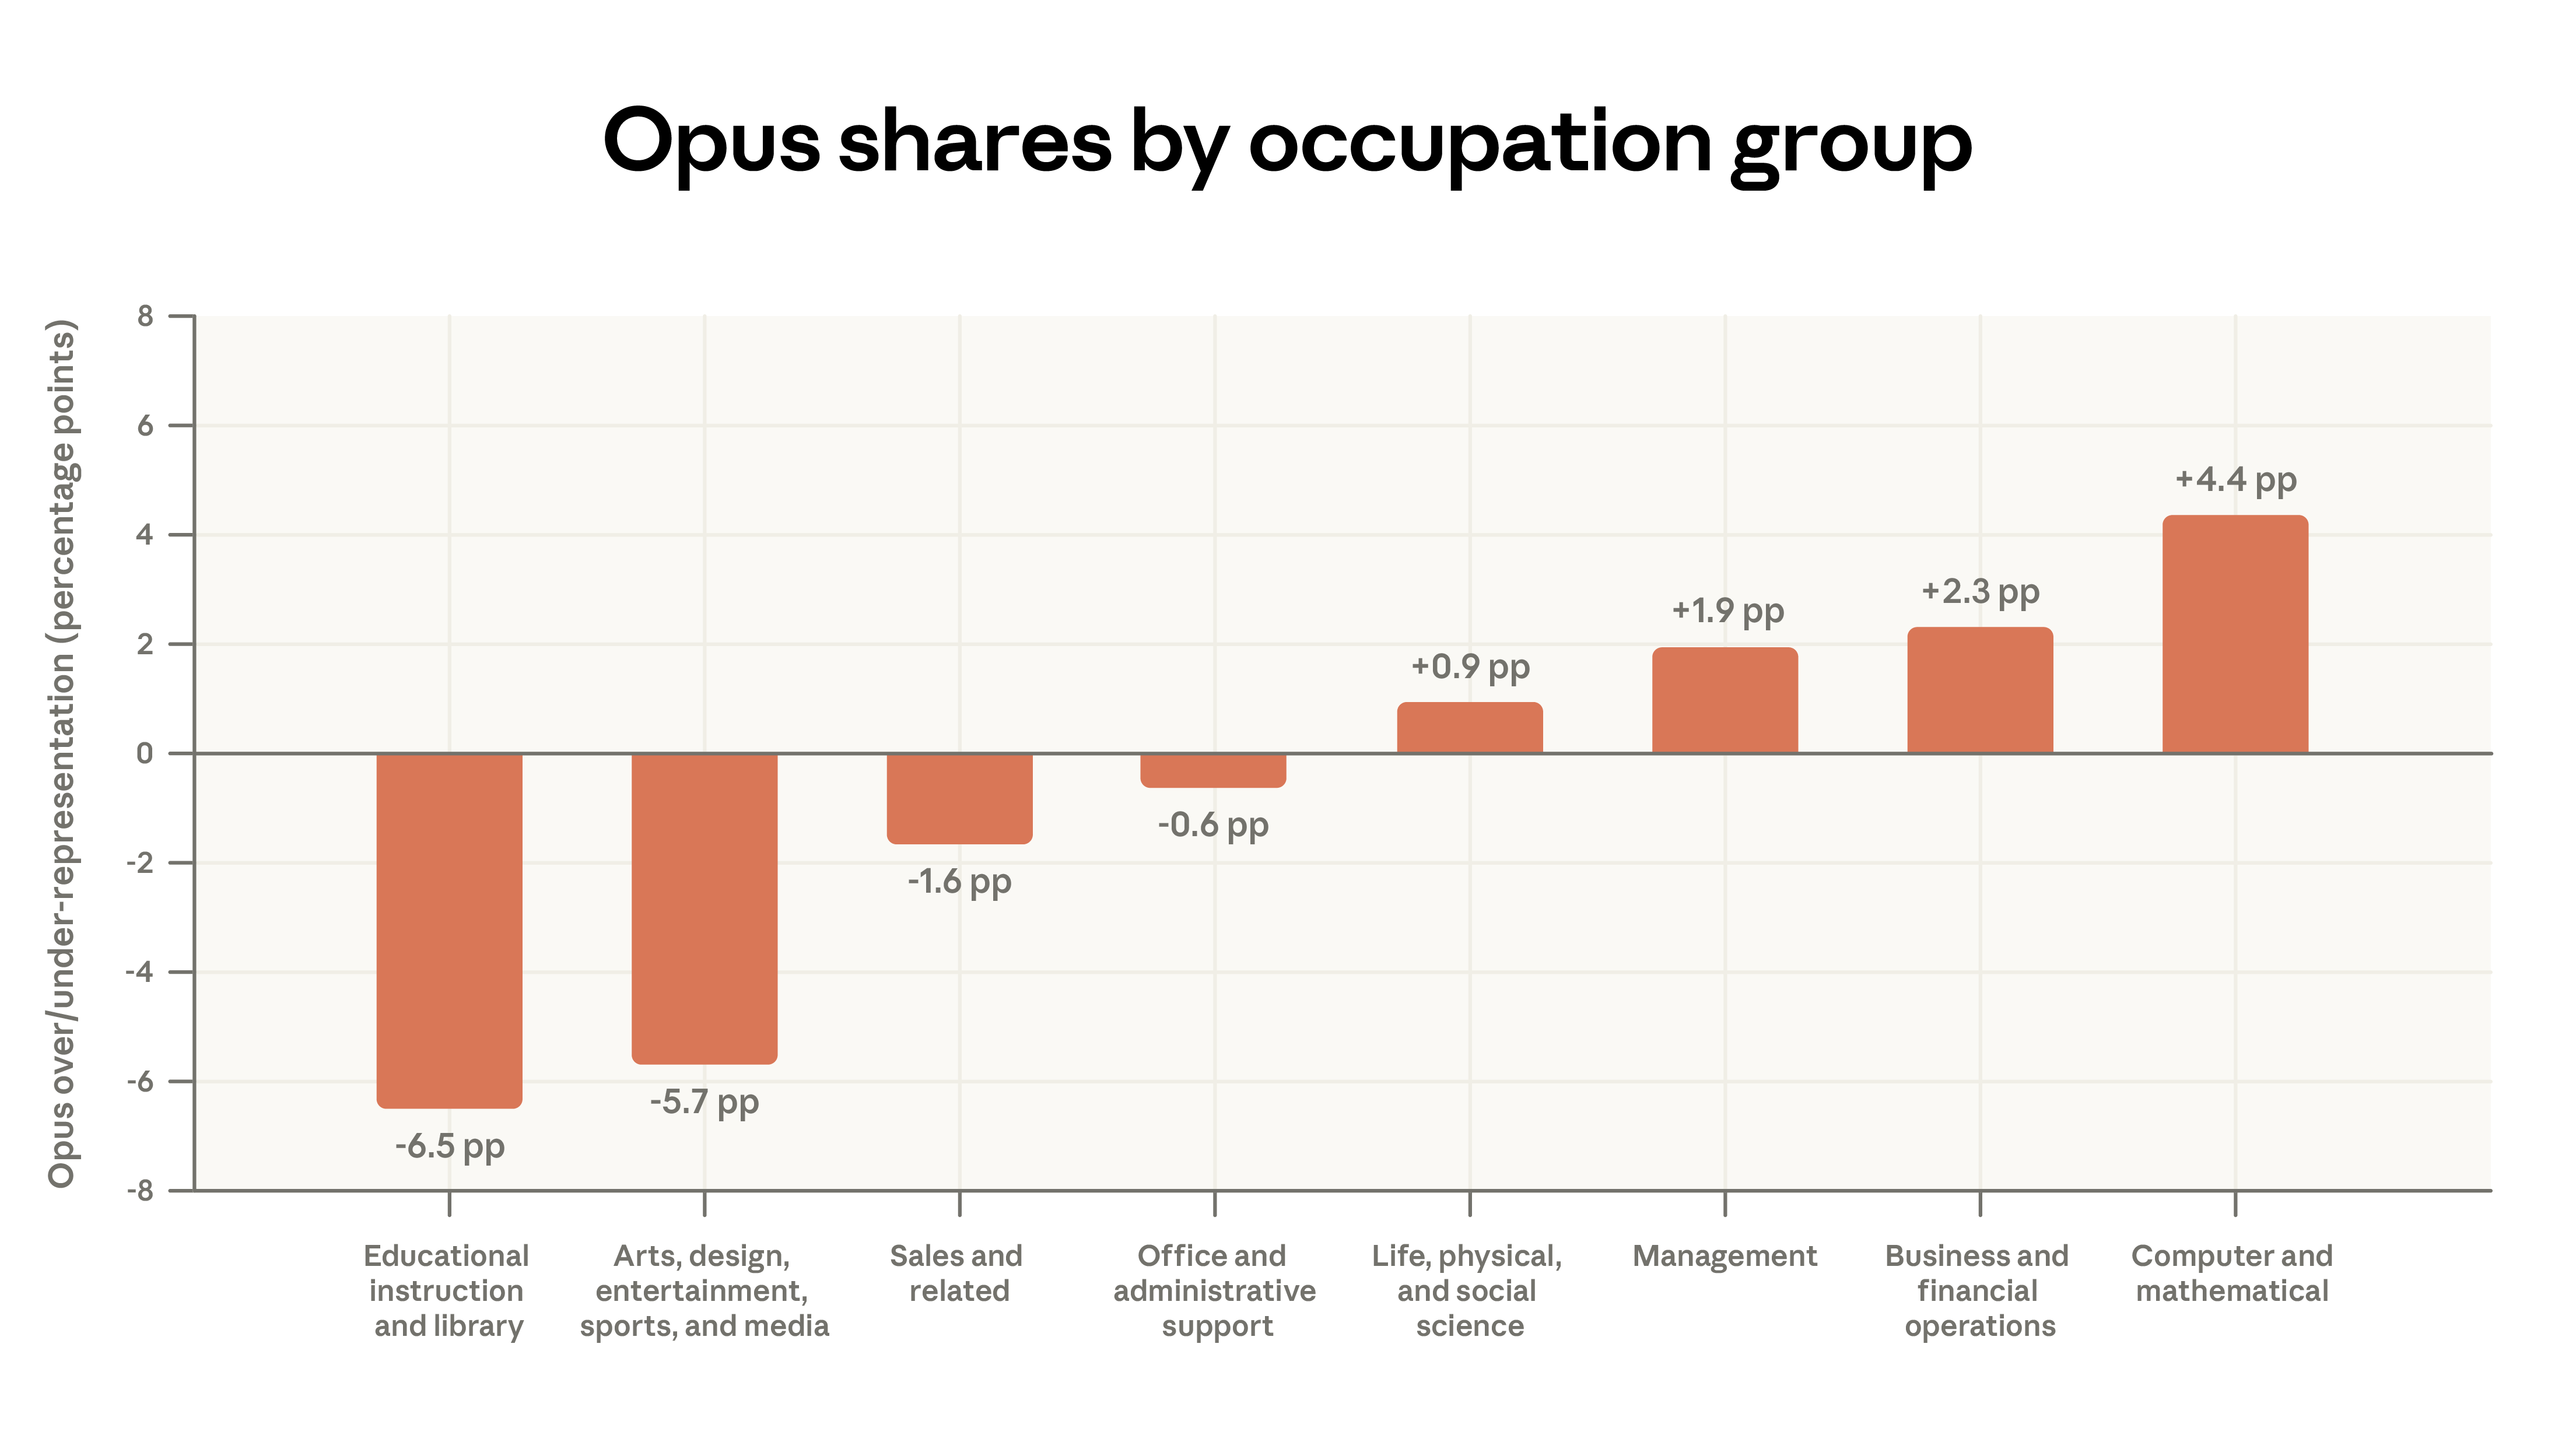
Figure 7: Correlation between occupational wages and Opus model choice, indicating that each $10 increase in hourly wage raises Opus share by about 1.5 percentage points in Claude.ai, and about twice that in API
Learning Curve
Claude’s first model launched in March 2023. Rapid growth since then has created a diverse user experience, from early adopters since the initial release to recent registrants during the measurement period. Understanding how user experience varies with tenure is crucial.
Longer-tenure users (those who joined at least 6 months before the sample) show more iterative use of Claude, with a significant reduction in delegation-based interactions. They are about 7 percentage points more likely to use Claude for work, prefer tasks requiring higher education, and have a more dispersed task distribution. The top 10 O*NET tasks account for 20.7% of their conversations, compared to 22.2% for newer users.
Their task distribution correlates with roughly one additional year of education per year of platform experience. They also use Claude less for personal queries: 38% of their conversations are personal after one year, versus 44% for recent users.
These patterns can be interpreted in multiple ways. Longer-tenure users may be a self-selected group—perhaps early adopters with higher technical skills, such as programmers. Survivor bias may also play a role: users who find Claude useful are more likely to continue using it.
Early analysis indicated that countries with lower income and education levels tend to have higher task complexity. This likely reflects early adoption patterns: initial users in any country or group are often high-value, early adopters of advanced AI applications. As adoption expands, the user base broadens to include more leisure-oriented use.
Cluster analysis of requests reveals that the highest-earning users tend to focus on tasks like AI research, git operations, manuscript editing, and startup funding. Conversely, lower-earning users often engage in haiku creation, sports score queries, and party food suggestions.
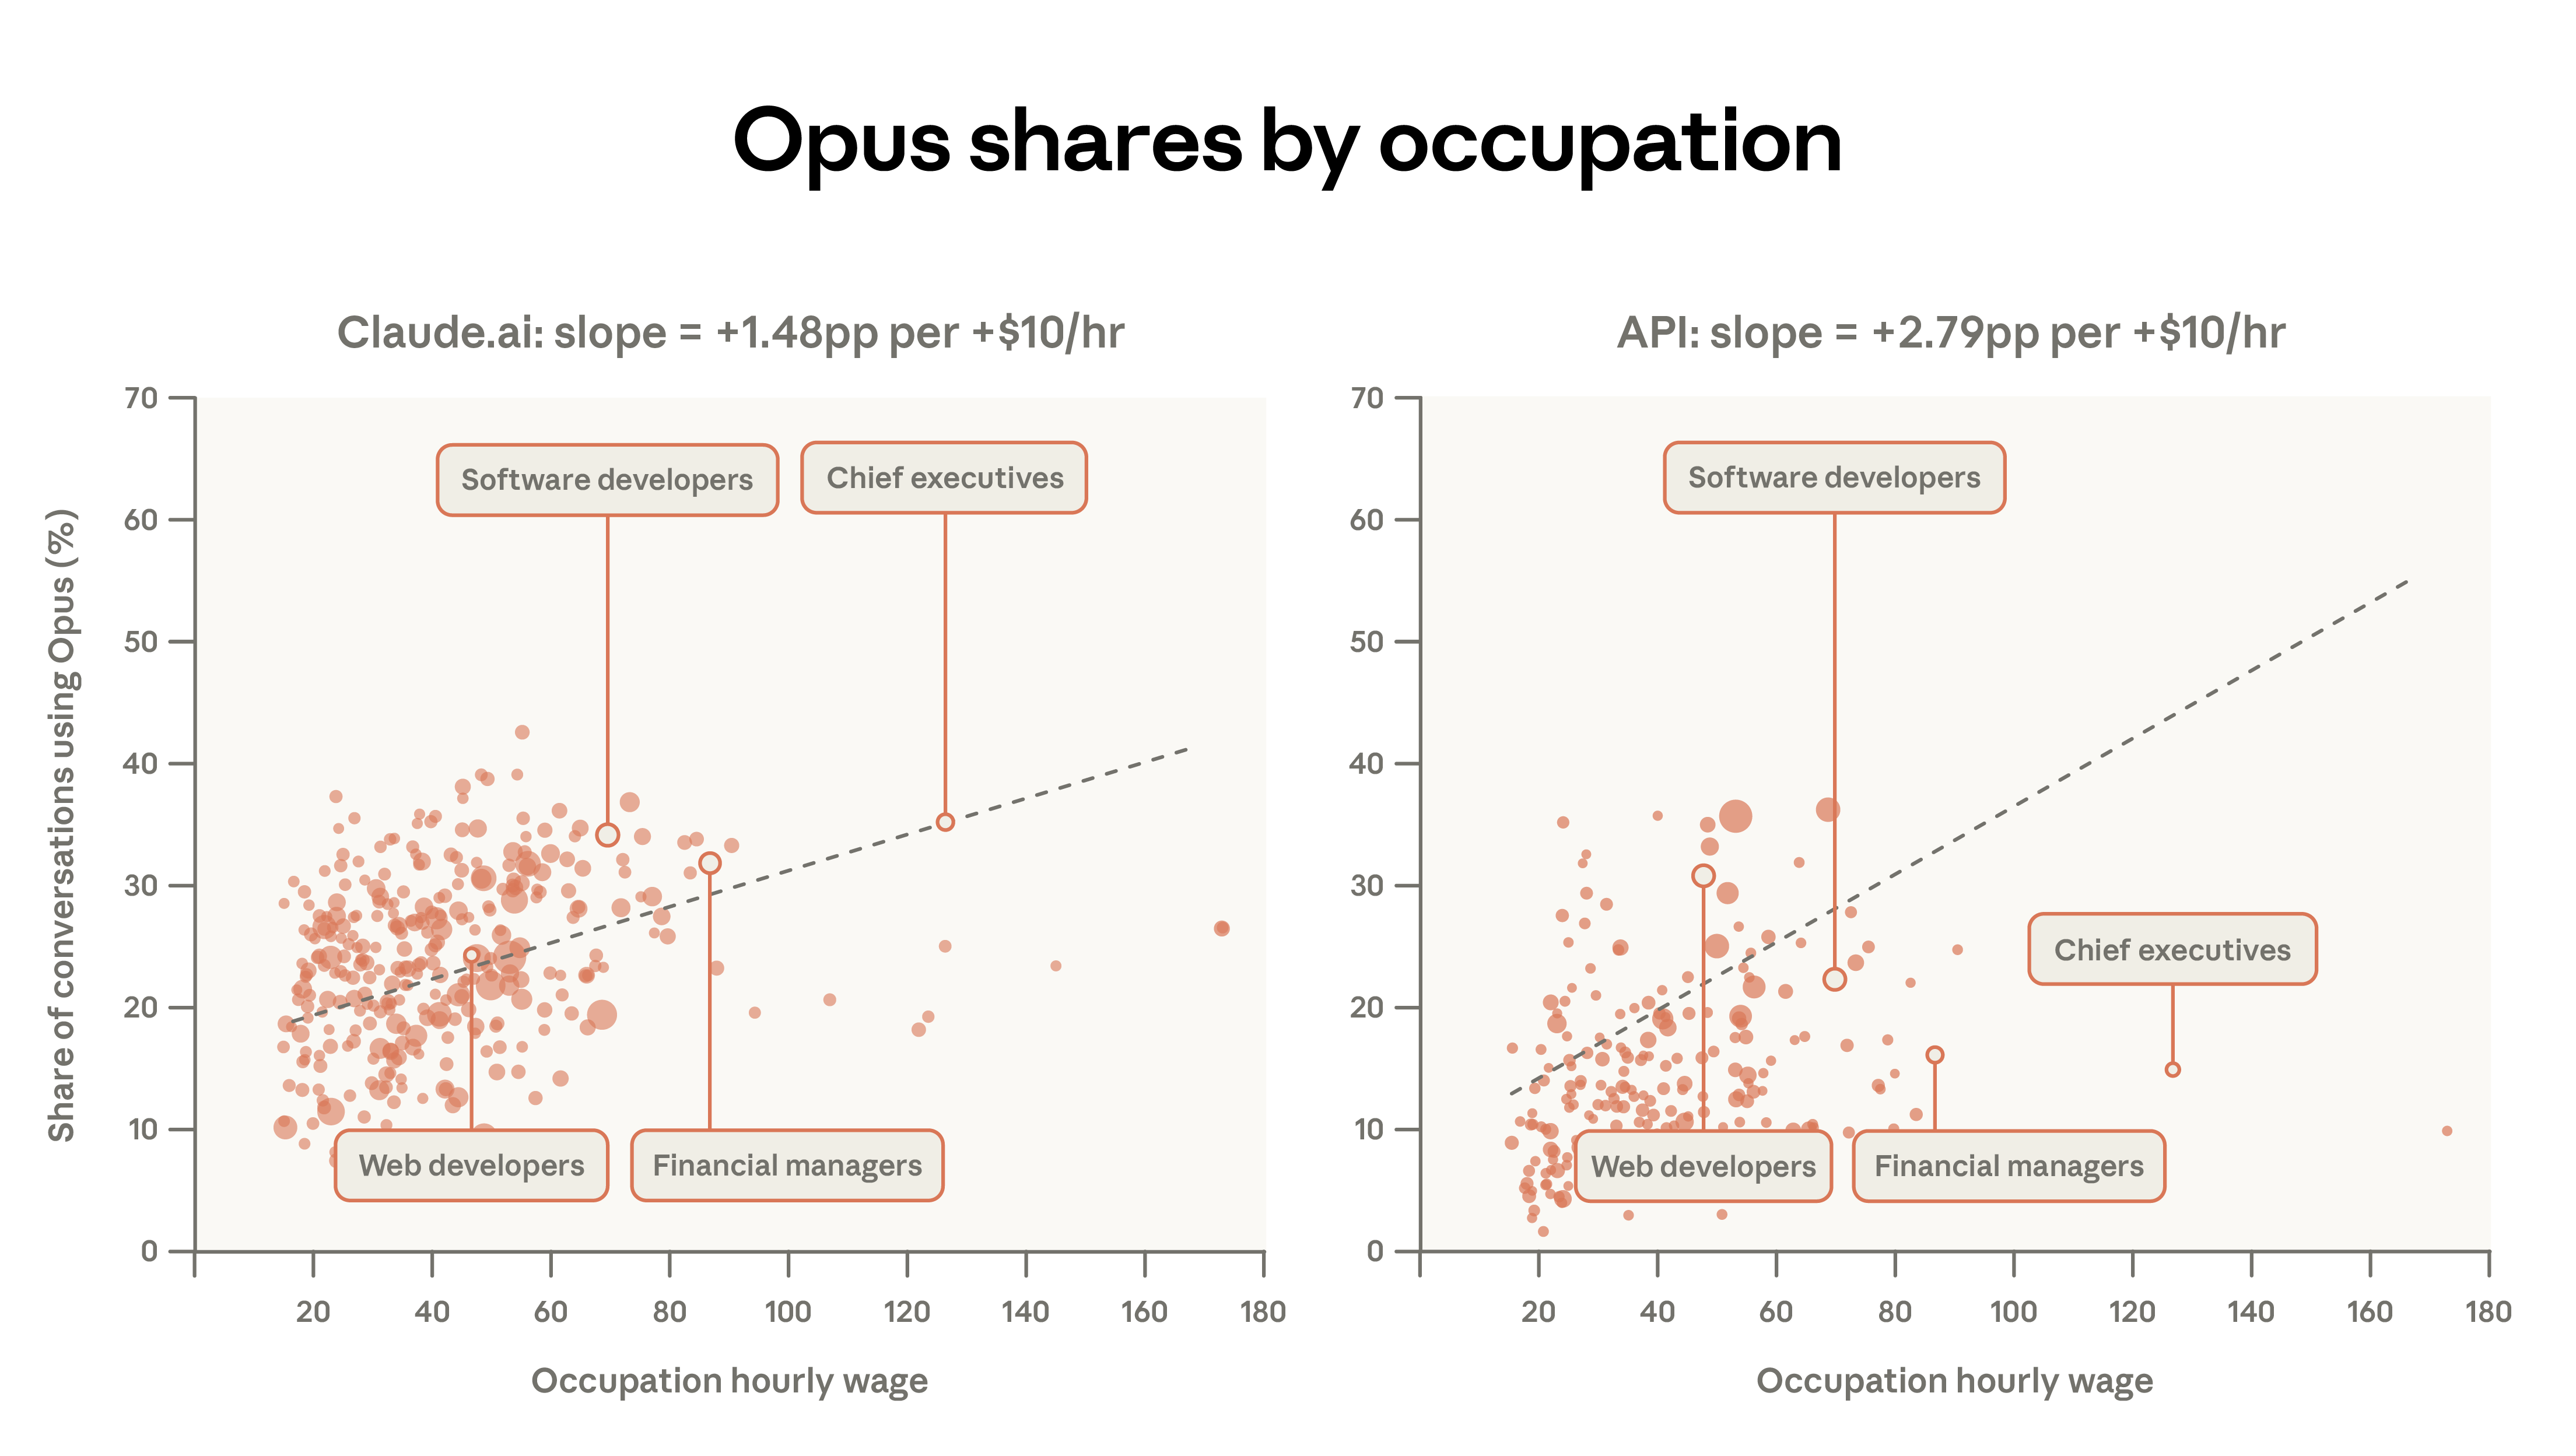
Figure 8: Relationship between user experience and task distribution, showing that long-tenure users (over 6 months) favor higher-salary, higher-education tasks, while new users focus on personal leisure queries
Experience Effects
To further explore these relationships, we analyze log-level data with dialogue-specific features. Using a simple two-variable regression—dialogue success rate as the outcome, long-tenure indicator as predictor—we find that long-tenure users are about 5 percentage points more likely to succeed in conversations.8
Success may partly reflect better prompt techniques, which can be learned. However, if more experienced users are assigned inherently more successful tasks, then task allocation itself could explain these findings.
Controlling for O*NET task categories and request clusters, comparing high- and low-tenure users performing the same task types (e.g., “performing corporate financial analysis, valuation, and modeling”), reduces the effect size to about 3 percentage points.
Further controlling for model choice, usage scenario, and geography, the effect remains slightly higher—about 4 percentage points—indicating that higher experience independently improves success rates.
These results suggest that more experienced users are more successful in Claude conversations, and this is not simply due to language or task type differences. A plausible explanation involves improved learning and prompt skills acquired over time—key factors in success.
Figure 9: Regression results showing that, after controlling for task type, model choice, language, and geography, long-tenure users still outperform by 3–4 percentage points
Discussion
This report revisits key metrics of Claude usage and introduces the analysis of model choice and conversation success. Since August 2025, API usage has become more concentrated: the top 10 O*NET tasks increased from 28% to 33%. Claude.ai’s tasks have diversified since November 2025. US geographic convergence persists but at a slower rate. Countries with lower adoption face only slight disadvantages.
The economic framework allows us to track longitudinal changes in Claude’s usage. Academic-related use has declined, while personal conversations have increased. The average input complexity on Claude.ai has slightly decreased, with dialogues showing less complex inputs and lower estimates of independent task completion time.
Overall, Claude handles complex, high-value tasks that are not representative of the broader US economy. As the user base expands, lower-wage tasks account for a slightly larger share of traffic. Task value, measured by occupational wages, has declined on Claude.ai since our first report but increased in the API. Both platforms concentrate complex tasks in the powerful Opus series, especially in the API.
Experienced users collaborate more, use Claude for work, attempt more challenging tasks, and achieve better results. This contrasts with the expectation that automation use is most advanced among the most mature users; instead, experienced users show a preference for iterative, exploratory use. These findings align with “learning by doing”: greater exposure to AI enhances capabilities.
Another explanation involves group effects or survivor bias: early adopters may have higher technical skills; persistent users are those who find Claude most useful. Rigorous regression controls suggest that these effects are not solely due to language or task differences.
The success gap may exacerbate labor market inequality. Long-standing research indicates skill-biased technological change tends to raise high-skill workers’ wages while suppressing others’. Our analysis suggests that early adopters—more skilled—interact more successfully with Claude, gaining disproportionate benefits during expansion.
Figure 10: Final integrated chart illustrating the relationships among usage inequality, learning effects, and labor market impacts
Footnotes
- Automated code-writing tasks in Claude Code are aggregated into Claude.ai traffic because they originate from Claude.ai subscriptions.
- We define “personal use” O*NET tasks as: 1) Food preparation and related services (35-0000); 2) Personal care and services (39-0000); 3) Arts, design, entertainment, sports, and media (27-0000), limited to entertainment/sports; 4) Agriculture, fishing, forestry (45-0000); 5) Building and grounds cleaning (37-0000); 6) Community and social services (21-0000), mainly personal health/family tasks. Educational tasks are excluded from personal use.
- In this analysis, we exclude free-tier Claude.ai users from the sample.
- To aggregate wages across occupations performing similar tasks, we compute a weighted average based on employment numbers and time spent on each task.
- Emerging patterns are identified by selecting O*NET tasks that: (i) appear at least 300 times in current data; (ii) have doubled in frequency compared to the previous report.
- The ranges reflect different estimates based on whether models are weighted (5 years) or unweighted (9 years) in the previous report.
- We use log-level data with the same privacy thresholds to estimate models; methodology detailed in appendix.
- Results are similar regardless of how “long experience” is defined.
- Our sampling period overlaps with the Super Bowl ad release, bringing many new users.