Trade
Basic
Futures
Futures
Hundreds of contracts settled in USDT or BTC
TradFi
Gold
Trade global traditional assets with USDT in one place
Options
Hot
Trade European-style vanilla options
Unified Account
Maximize your capital efficiency
Demo Trading
Futures Kickoff
Get prepared for your futures trading
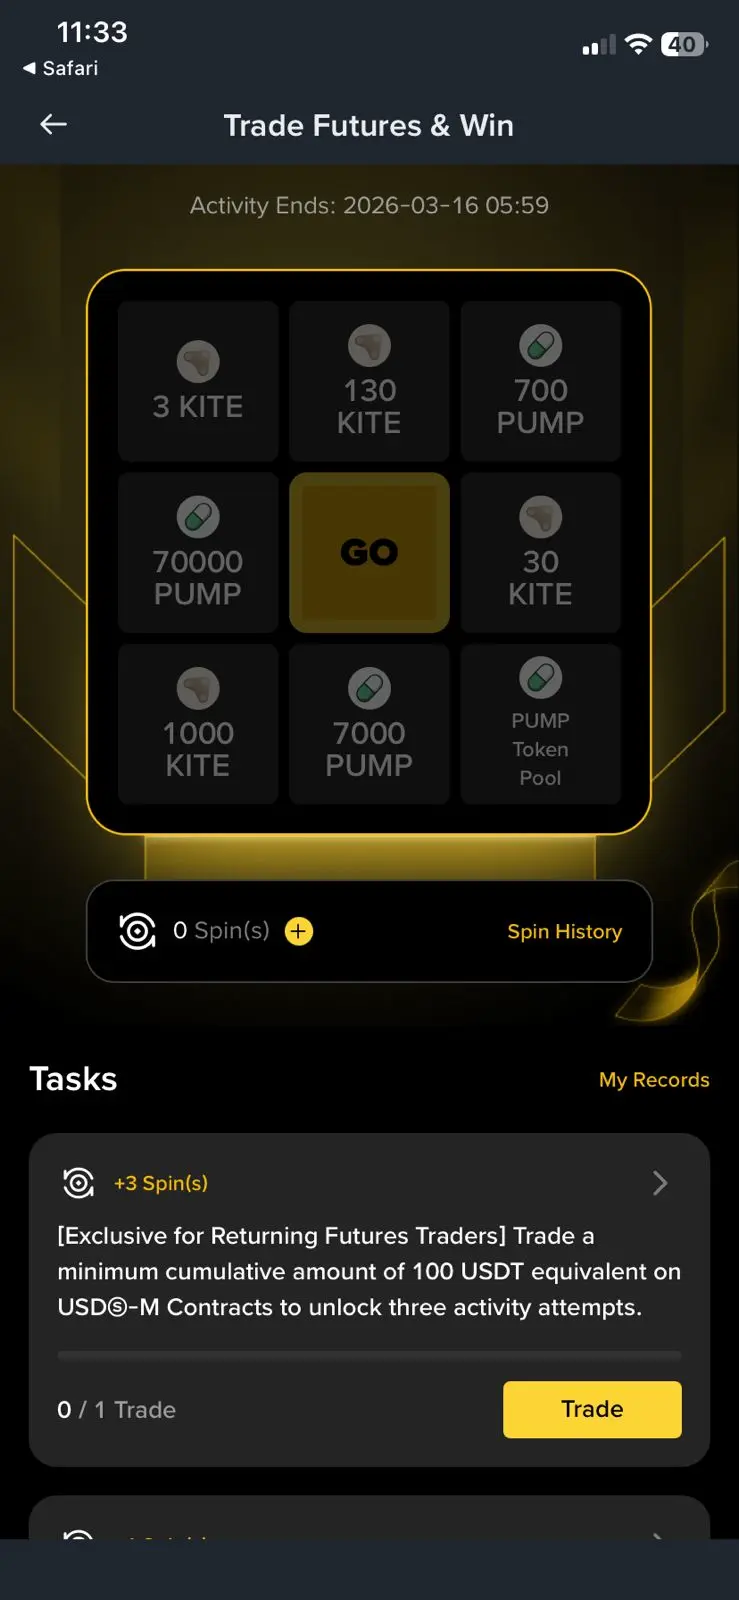
Futures Events
Participate in events to win generous rewards
Demo Trading
Use virtual funds to experience risk-free trading
Earn
Launch
CandyDrop
Collect candies to earn airdrops
Launchpool
Quick staking, earn potential new tokens
HODLer Airdrop
Hold GT and get massive airdrops for free
Launchpad
Be early to the next big token project
Alpha Points
Trade on-chain assets and enjoy airdrop rewards!
Futures Points
Earn futures points and claim airdrop rewards
Investment
Simple Earn
Earn interests with idle tokens
Auto-Invest
Auto-invest on a regular basis
Dual Investment
Buy low and sell high to take profits from price fluctuations
Soft Staking
Earn rewards with flexible staking
Crypto Loan
0 Fees
Pledge one crypto to borrow another
Lending Center
One-stop lending hub
VIP Wealth Hub
Customized wealth management empowers your assets growth
Private Wealth Management
Customized asset management to grow your digital assets
Quant Fund
Top asset management team helps you profit without hassle
Staking
Stake cryptos to earn in PoS products
Smart Leverage
New
No forced liquidation before maturity, worry-free leveraged gains
GUSD Minting
Use USDT/USDC to mint GUSD for treasury-level yields
More
CrypIQ
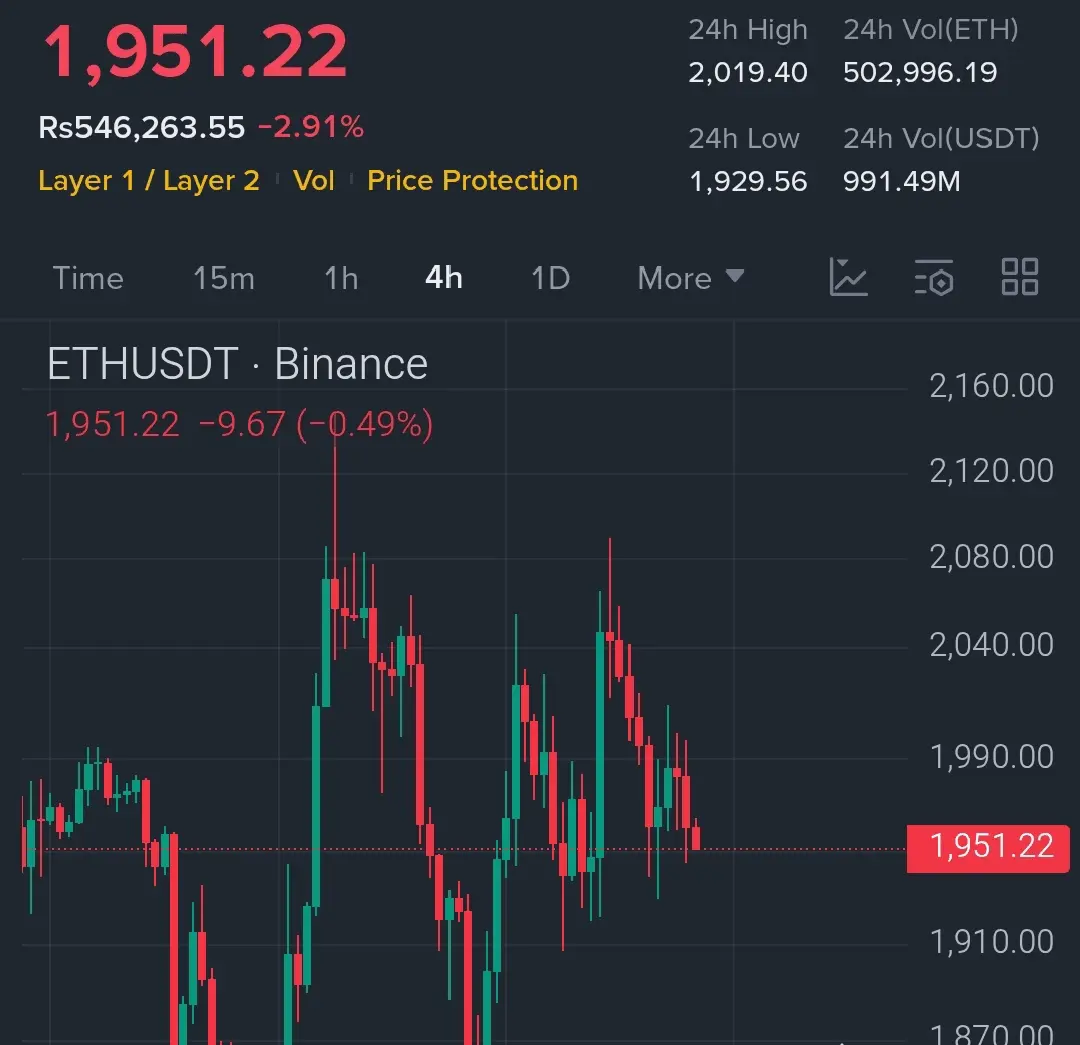
$ETH LOSING MOMENTUM....
Multiple rejections near 2000 and price slipping back to 1950....
Buyers tried… but sellers keep pushing it down.
$ETH — SHORT 🔻
Entry: 1950 – 1980
SL: 2035
TP1: 1900
TP2: 1860
TP3: 1800
Market showing weak structure and lower highs forming.
If 1900 cracks… downside can accelerate quickly.
Bulls getting tired… bears watching closely.
ETH-1,26%
- Reward
- 1
- Comment
- Repost
- Share
- Reward
- 3
- 3
- Repost
- Share
Lions_Lionish :
:
EXCLUSIVE LATEST COIN & MARKET UPDATES on GATE SQUARE ✅ FOLLOW ME NOW 🔥💰💵View More

馬币火
Malaysian Ringgit
Created By@CryptoKing2026
Listing Progress
100.00%
MC:
$5.27K
More Tokens
🚨 BREAKING: SOUTH KOREA MARKET CRASH!
Due to the Middle East war, approximately ₩1 QUADRILLION in wealth has been wiped out from the South Korean stock market in the last 48 hours—the KOSPI index is witnessing the biggest crash in its history!
Due to the Middle East war, approximately ₩1 QUADRILLION in wealth has been wiped out from the South Korean stock market in the last 48 hours—the KOSPI index is witnessing the biggest crash in its history!


- Reward
- 2
- Comment
- Repost
- Share
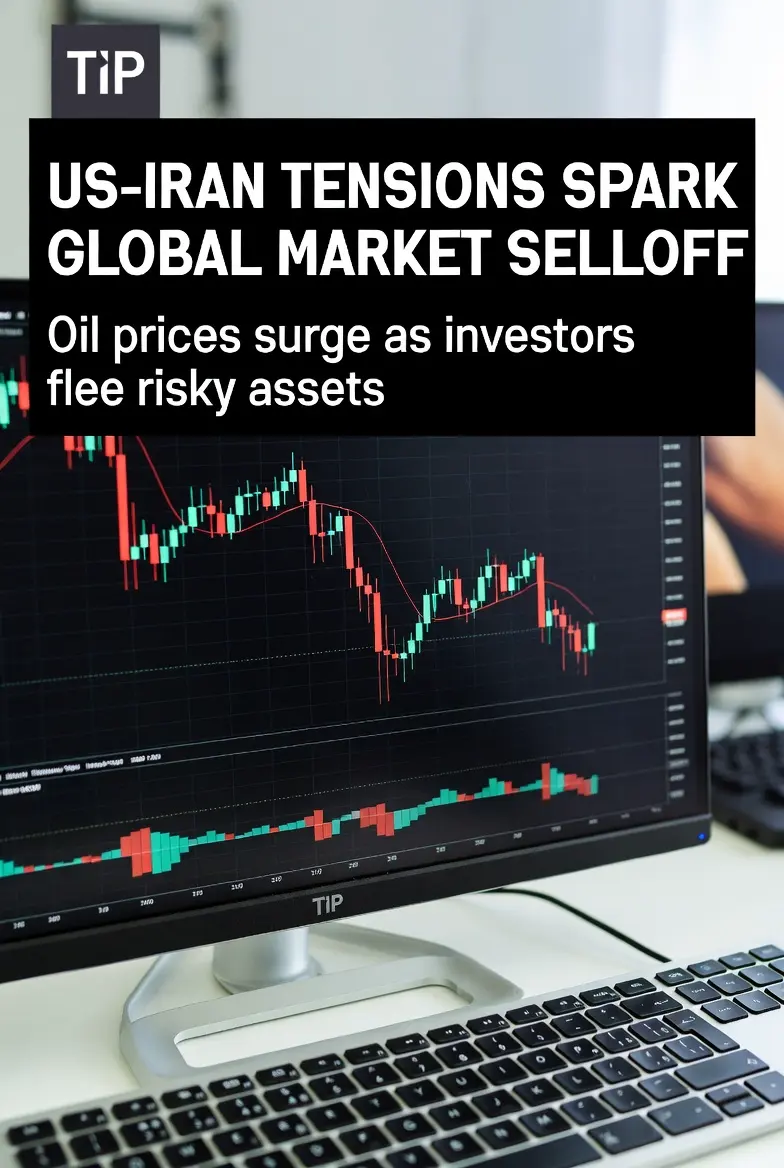
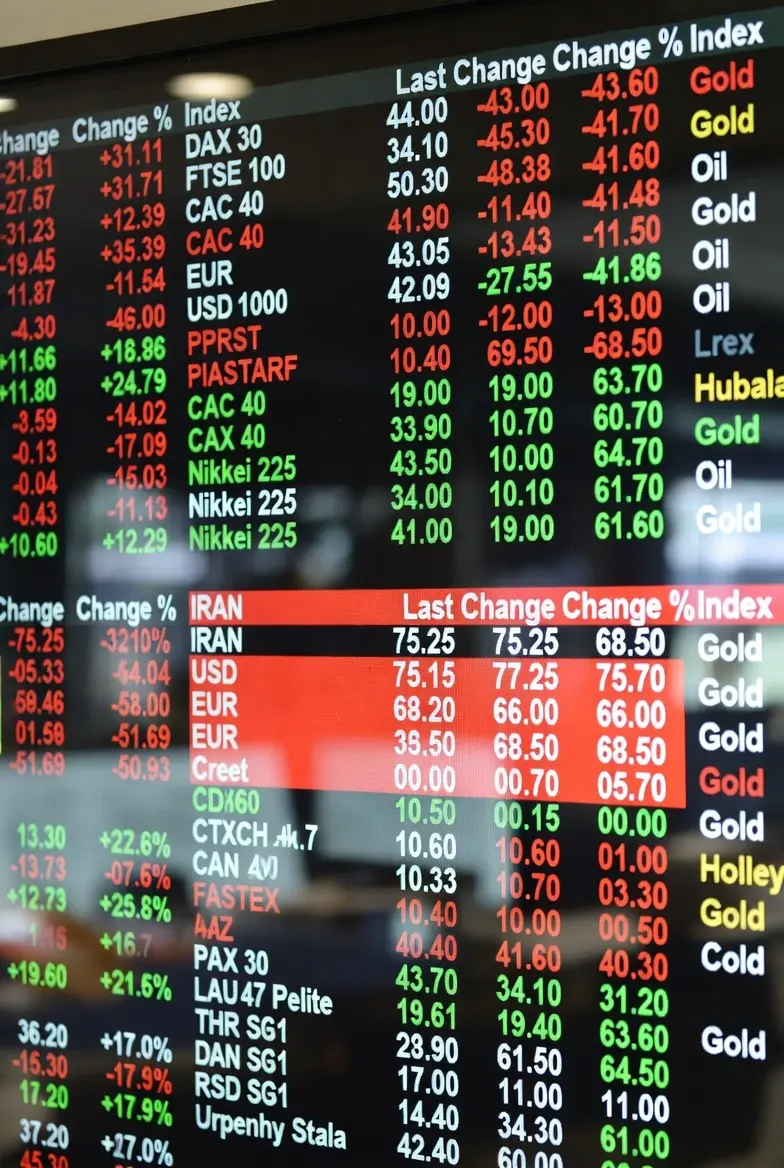
#USIranTensionsImpactMarkets: How Geopolitical Tensions Are Shaping Global Markets
Rising tensions between the United States and Iran have once again captured global attention, and financial markets are responding in real-time. From oil prices to equities and currency fluctuations, the ripple effects of geopolitical uncertainty are significant.
Oil & Energy Markets
Iran plays a crucial role in the global oil supply chain. Any escalation in tensions often triggers fears of supply disruptions, pushing crude oil prices higher. Investors in energy stocks and commodities closely watch the Middle Ea
- Reward
- 1
- Comment
- Repost
- Share
yfoxyfxtixfhlxufxufxyfztdzyfoxfyoxyfoxyoxfyxyfxhgxgicugcutcugcigcugcugcitcugcugcigcgcdtiitddtditdkgkgx
- Reward
- 2
- Comment
- Repost
- Share


- Reward
- like
- Comment
- Repost
- Share
#BuyTheDipOrWaitNow?
#BuyTheDipOrWaitNow?
Crypto markets move in cycles of optimism and fear. Every correction creates the same emotional battlefield. Some traders shout buy the dip. Others freeze and wait for confirmation. The real question is not whether price is down. The real question is whether this is opportunity or early stage distribution.
This deep dive breaks down structure, psychology, macro influence, liquidity behavior, risk management, and execution models so you can think like a professional instead of reacting like the crowd.
Understanding What A Dip Really Is
A dip is not sim

- Reward
- 4
- 5
- Repost
- Share
ShainingMoon:
LFG 🔥View More
🚨 38% OF ALTCOINS ARE NEAR ALL-TIME LOWS, WORSE THAN FTX COLLAPSE!
Nearly 4 out of 10 altcoins are trading near their ALL-TIME LOW — that’s worse than when FTX collapsed.
This is the BIGGEST ALTCOIN WIPEOUT of this cycle.
Nearly 4 out of 10 altcoins are trading near their ALL-TIME LOW — that’s worse than when FTX collapsed.
This is the BIGGEST ALTCOIN WIPEOUT of this cycle.
- Reward
- 1
- Comment
- Repost
- Share
Xue Zhiqian's PR company is very grateful to Xie Na. Originally, Xue Zhiqian was at the center of the storm, but unexpectedly, Xie Na came out to support him. Then, the ex-girlfriend revealed that Zhang Jie's ex-girlfriend was indeed cheated on. Now, everything is settled with another hammer, prompting Zhang Jie's response. Meanwhile, Xue Zhiqian is unaffected and just watching the show.
View Original


- Reward
- 2
- Comment
- Repost
- Share
- Reward
- like
- Comment
- Repost
- Share
Charge! Ahhhhhhhhhhhhhhhhhhhhhhhhhhhhhhhhhhhhhhhhhhhhhhhhhhhhhhhhhhhhhhhhhhhhhhhhhhhhhhhhhhhhhhhhhhhhhhhhhhhhhhhhhhhhhhhhhhhhhhhhhhhhhhhhhhhhhhhhhhhhhhhhhhhhhhhhhhhhhhhhhhhhhhhhhhhhhhhhhhhhhhhhhhhhhhhhhhhhhhhhhhhhhhhhhhhhhhhhhhhhhhhhhhhhhhhhhhhhhhhhhhhhhhhhhhhhhhhhhhhhhhhhhhhhhhhhhhhhhhhhhhhhhhhhhhhhhhhhhhhhhhhhhhhhhhhhhhhhhhhhhhhhhhhhhhhhhhhhhhhhhhhhhhhhhhhhhhhhhhhhhhhhhhhhhhhhhhhhhhhhhhhhhhhhhhhhhhhhhhhhhhhhhhhhhhhhhhhhhhhhhhhhhhhhhhhhhhhhhhhhhhhhhhhhhhhhhhhhhhhhhhhhhhhhhhhhhhhhhhhhhhhhhhhhhhhhhhhhhhhhhhhhhhhhhhhhhhhhhhhhhhhhhhhhhhhhhhhhhhhhhhhhhhhhhhhhhhhhhhhhhhhhhhhhhhhhhhhhhhhhhhhhhhhhhhh
BTC0,41%

- Reward
- like
- Comment
- Repost
- Share
gk
dj
Created By@Jayhenry
Subscription Progress
0.00%
MC:
$0
More Tokens


- Reward
- 8
- 2
- Repost
- Share
Dr.NicholasOfStanford:
Pai is the bestView More
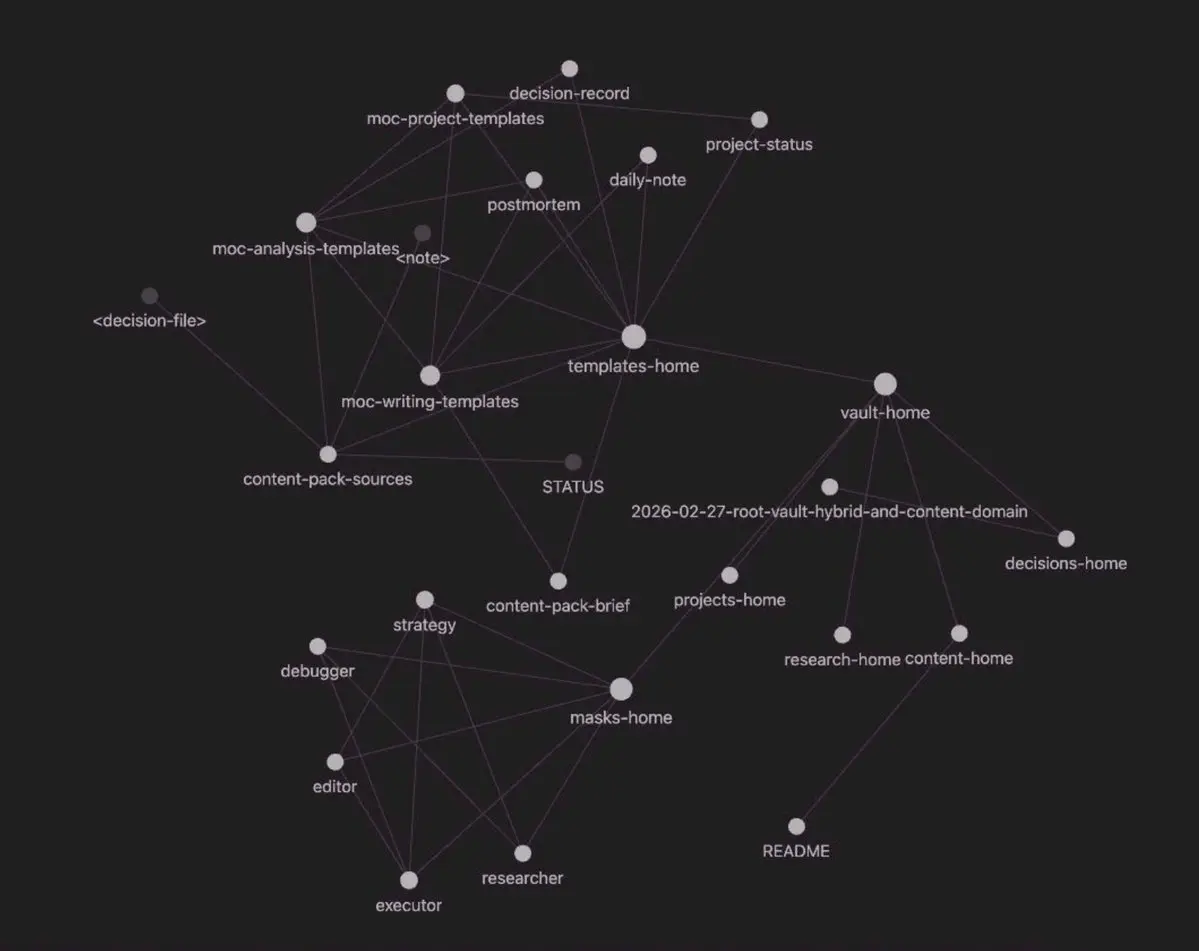
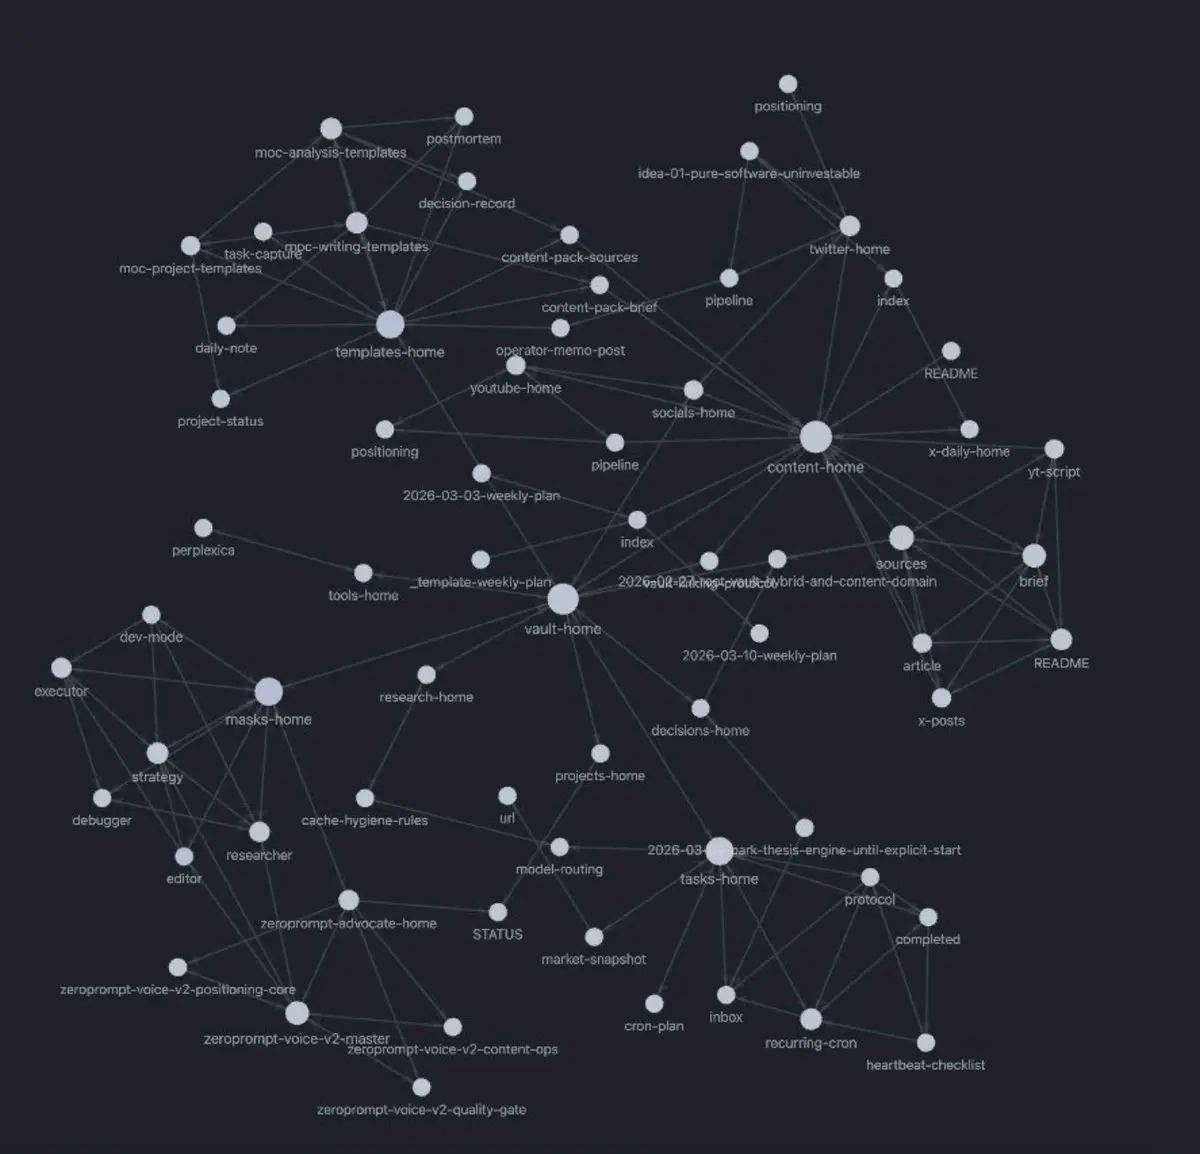
i created an obsidian vault for my openclaw 5 days ago
how it started and how it's going now
how it started and how it's going now
- Reward
- like
- Comment
- Repost
- Share
BTC Market Structure: Support, Resistance & Liquidity Zones (Educational Analysis)”
218
- Reward
- like
- Comment
- Repost
- Share
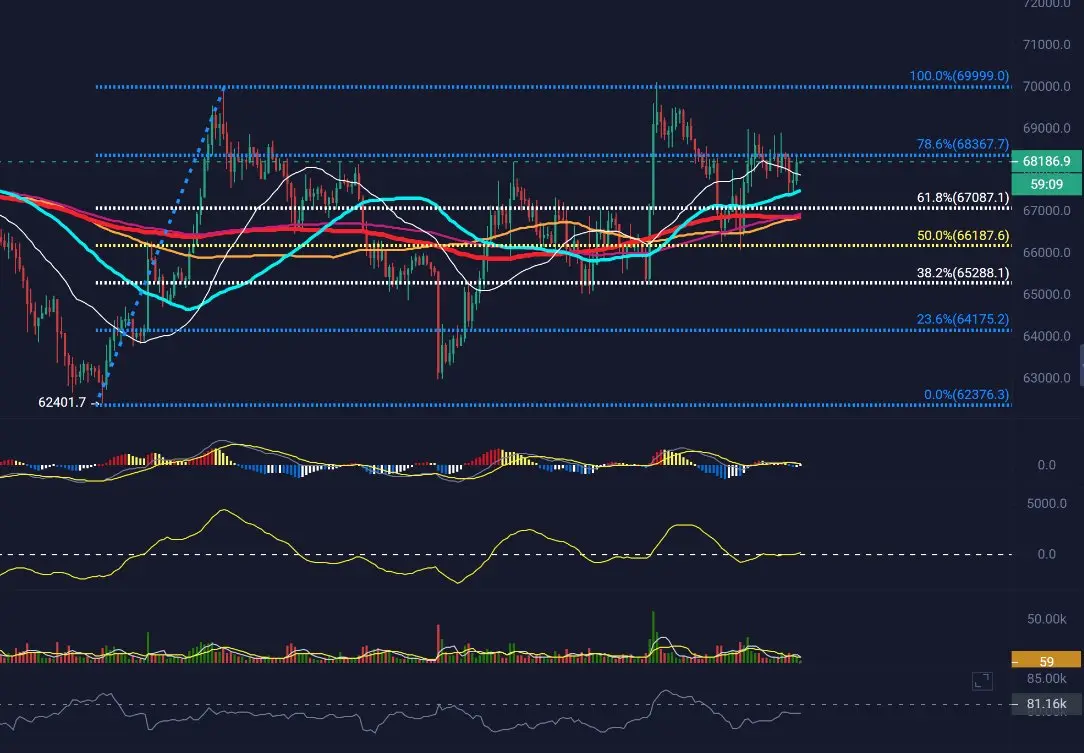
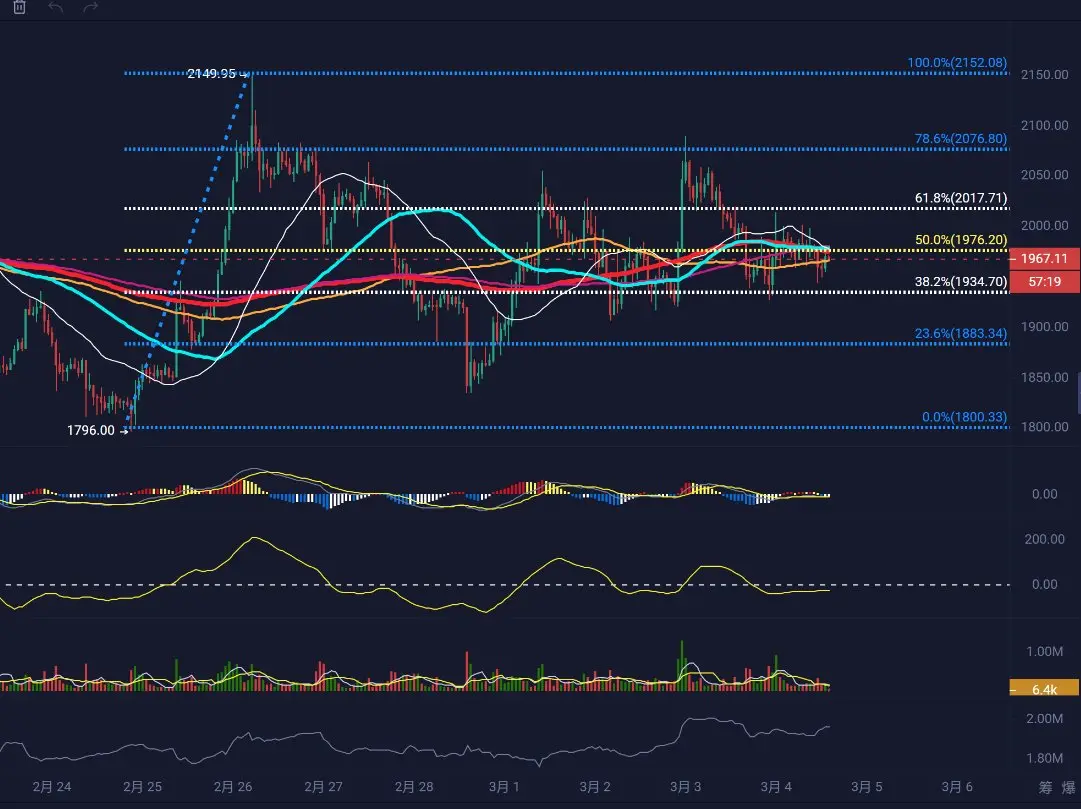
#BTC
Some friends asked about the market, but actually, the current chart isn't complicated.
On the hourly chart, Bitcoin is stronger than Ethereum.
BTC is almost reaching its previous high,
ETH is still bouncing around near 0.78,
a typical case of mud that won't stick to the wall.
In reality,
since February 5th, it's mainly been a daily chart oscillation.
No trend, just fluctuations.
Recently, the global situation isn't very stable,
Trump has issued countless orders in the financial markets, with loud rhetoric and the use of weapons.
With this kind of move, market volatility spikes,
and the m
View OriginalSome friends asked about the market, but actually, the current chart isn't complicated.
On the hourly chart, Bitcoin is stronger than Ethereum.
BTC is almost reaching its previous high,
ETH is still bouncing around near 0.78,
a typical case of mud that won't stick to the wall.
In reality,
since February 5th, it's mainly been a daily chart oscillation.
No trend, just fluctuations.
Recently, the global situation isn't very stable,
Trump has issued countless orders in the financial markets, with loud rhetoric and the use of weapons.
With this kind of move, market volatility spikes,
and the m
- Reward
- 2
- Comment
- Repost
- Share
[BTC ETH market prediction]
506
- Reward
- like
- Comment
- Repost
- Share
🏦 Trump Urges Banks to Support the CLARITY Act
Donald Trump held a closed-door meeting with Coinbase CEO Brian Armstrong at the White House, after which he called on banks to support a key piece of legislation regulating the crypto market.
🪙 The president criticized banks for resisting crypto initiatives and warned that delaying reforms could lead to the leakage of innovation to other countries, including China.
The CLARITY Act, which aims to define regulations for digital assets and delineate the powers of the SEC and CFTC, is currently blocked in the Senate due to disputes over the profita
View OriginalDonald Trump held a closed-door meeting with Coinbase CEO Brian Armstrong at the White House, after which he called on banks to support a key piece of legislation regulating the crypto market.
🪙 The president criticized banks for resisting crypto initiatives and warned that delaying reforms could lead to the leakage of innovation to other countries, including China.
The CLARITY Act, which aims to define regulations for digital assets and delineate the powers of the SEC and CFTC, is currently blocked in the Senate due to disputes over the profita

- Reward
- 1
- Comment
- Repost
- Share
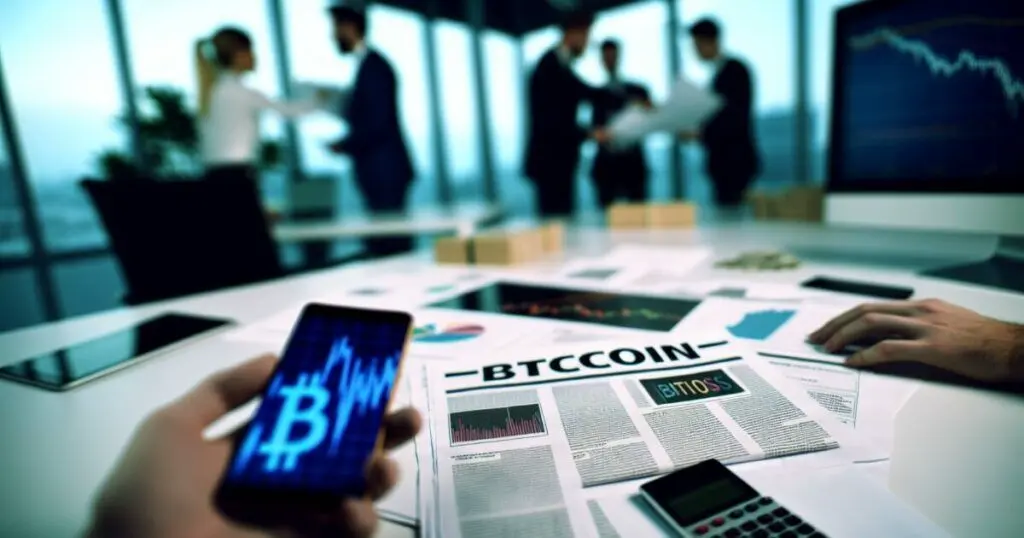
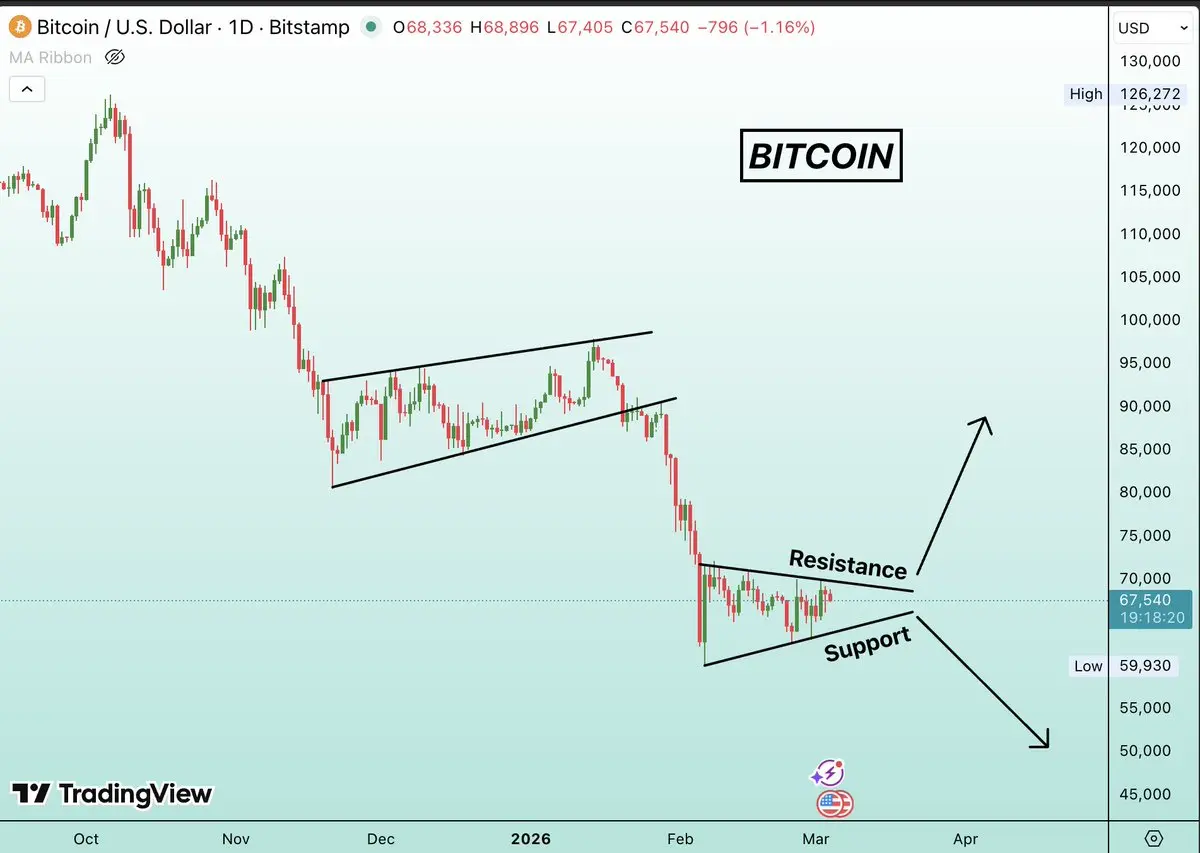
This Bitcoin chart is telling two stories at once.
Let me break it down.
First, Bitcoin formed a rising wedge from November to January, then fell from $95,000 all the way down to $59,930 in February—a 37% drop in weeks.
Now we’re once again at the most critical point on the entire chart.
BTC is sitting at $67,551, squeezed inside a bearish symmetric triangle.
Resistance at $70,000. Support at $60,000.
This is a make-or-break zone.
Scenario 1 (bull case): BTC holds support, macro fear cools, Trump’s Genius Act passes, institutional money re-enters. Target: $85,000–$90,000 by April.
Scenario
BTC0,41%
- Reward
- 2
- Comment
- Repost
- Share
Load More
Join 40M users in our growing community
⚡️ Join 40M users in the crypto craze discussion
💬 Engage with your favorite top creators
👍 See what interests you
Trending Topics
View More40.08K Popularity
42.65M Popularity
414.07K Popularity
272.17K Popularity
1.11M Popularity
Hot Gate Fun
View More- MC:$2.38KHolders:00.00%
- MC:$0.1Holders:10.00%
- MC:$2.36KHolders:10.00%
- MC:$2.38KHolders:10.00%
- MC:$2.4KHolders:20.07%
News
View MoreIran conflict escalation drives surge in Bitcoin demand, with large amounts of funds withdrawing from platforms and moving into personal wallets
2 m
Visa expands stablecoin payment footprint: partners with Bridge to issue stablecoin cards, planning to cover over 100 countries
4 m
Tether reinvests 5 million Swiss Francs to advance Plan ₿ Phase 2, with Lugano, Switzerland, accelerating the development of the Bitcoin city
6 m
Byreal advances towards Agent-Native DEX, the first open-source AI Skill supporting strategy replication
9 m
Gate launches the new Gate Card, with cashback and level system fully upgraded
12 m
Pin