TON vs UNI: Which Cryptocurrency Token Offers Better Investment Potential in 2024?


Introduction: TON vs UNI Investment Comparison
In the cryptocurrency market, the comparison between TON and UNI has always been a topic that investors cannot avoid. The two not only show significant differences in market capitalization rankings, application scenarios, and price performance, but also represent different positioning of crypto assets. TON (The Open Network) has gained market recognition since its development as a next-generation blockchain platform emphasizing speed, security, and scalability, with the capacity to process millions of transactions per second when needed. UNI (Uniswap) has been recognized since 2020 as the first automatic market maker protocol based on the Ethereum blockchain, establishing itself as a leading decentralized exchange protocol in the crypto ecosystem. This article will comprehensively analyze the investment value comparison between TON and UNI from multiple dimensions including historical price trends, supply mechanisms, and technical ecosystems, while attempting to answer the question investors care about most:
"Which is the better buy right now?"
Comparative Analysis Report: The Open Network (TON) vs Uniswap (UNI)
I. Historical Price Comparison and Current Market Status
The Open Network (TON) and Uniswap (UNI) Historical Price Trends
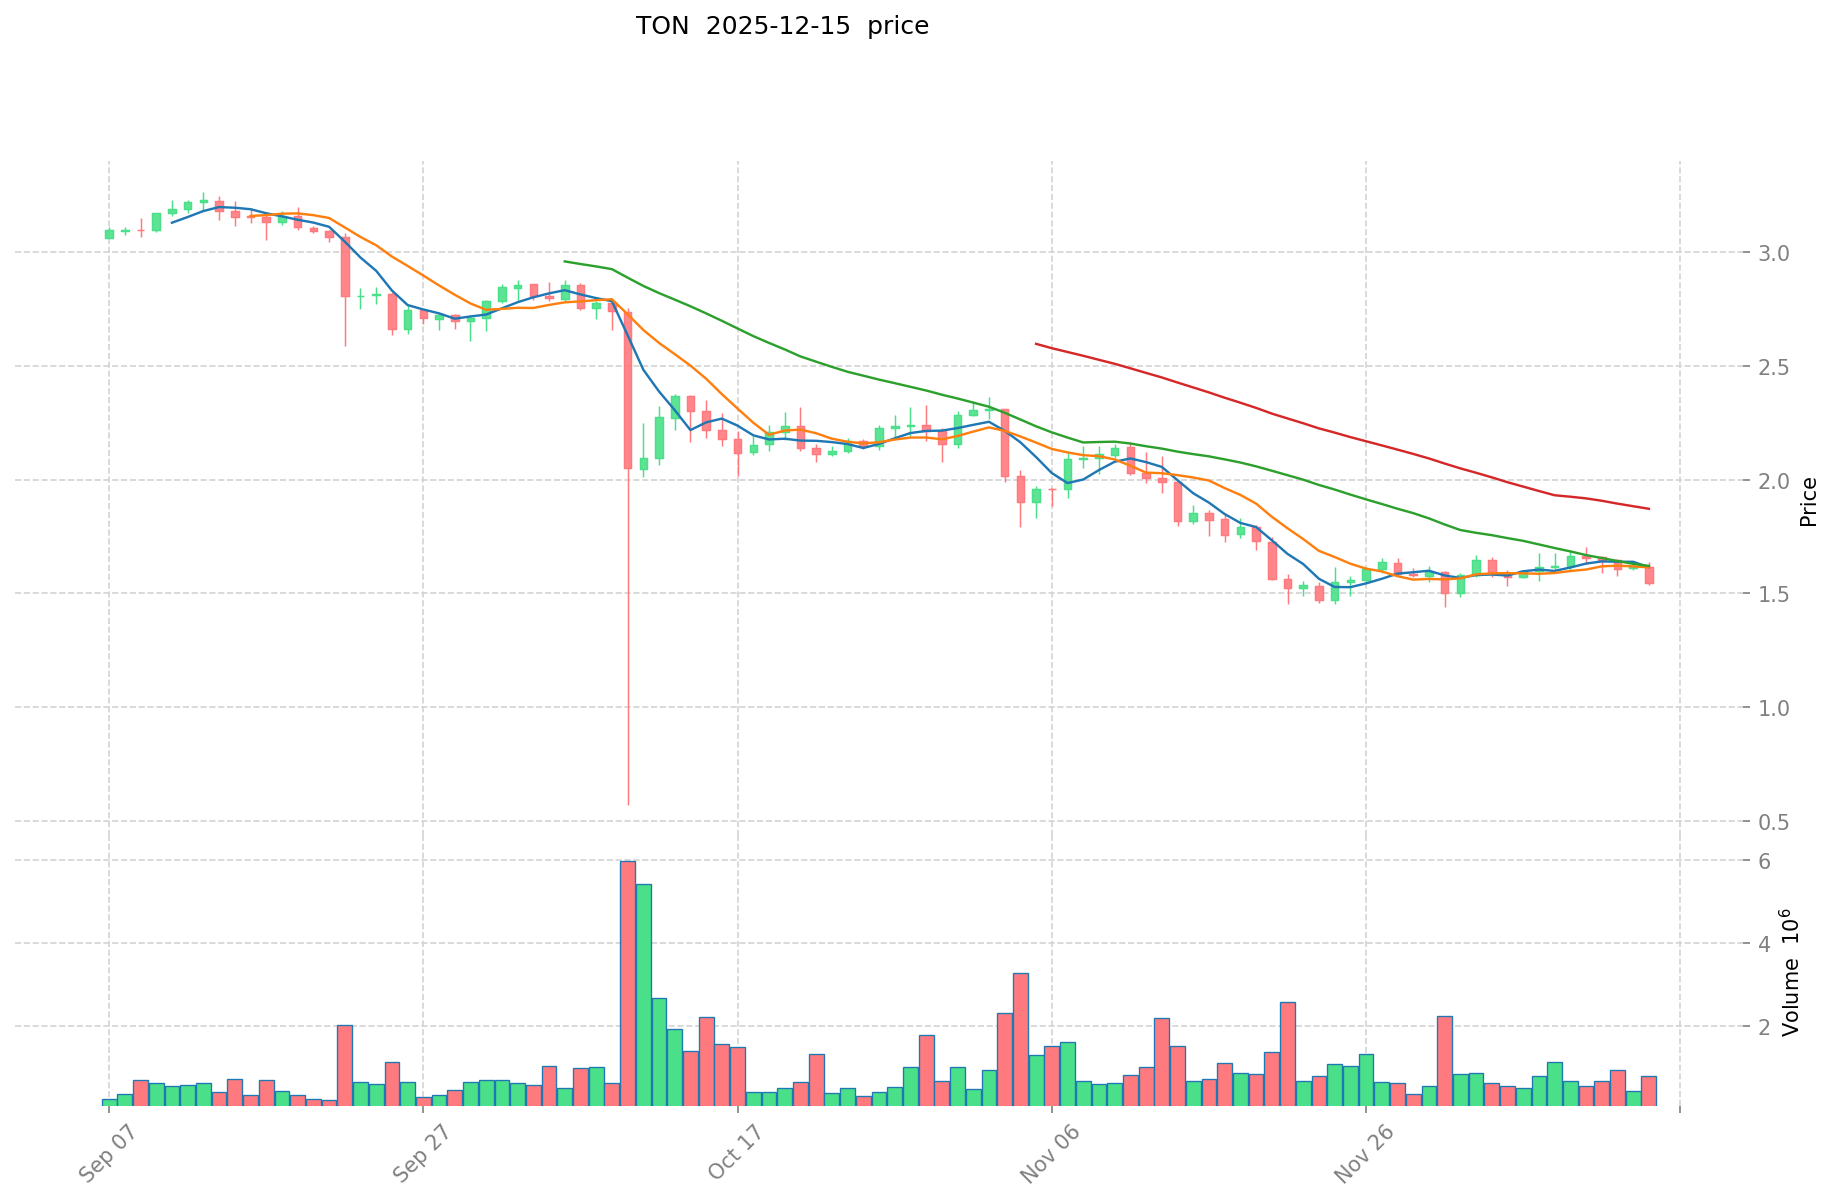
TON Historical Performance:
- All-time high (ATH): $8.25 (June 15, 2024)
- All-time low (ATL): $0.519364 (September 21, 2021)
- Current drawdown from ATH: Approximately 81.7%
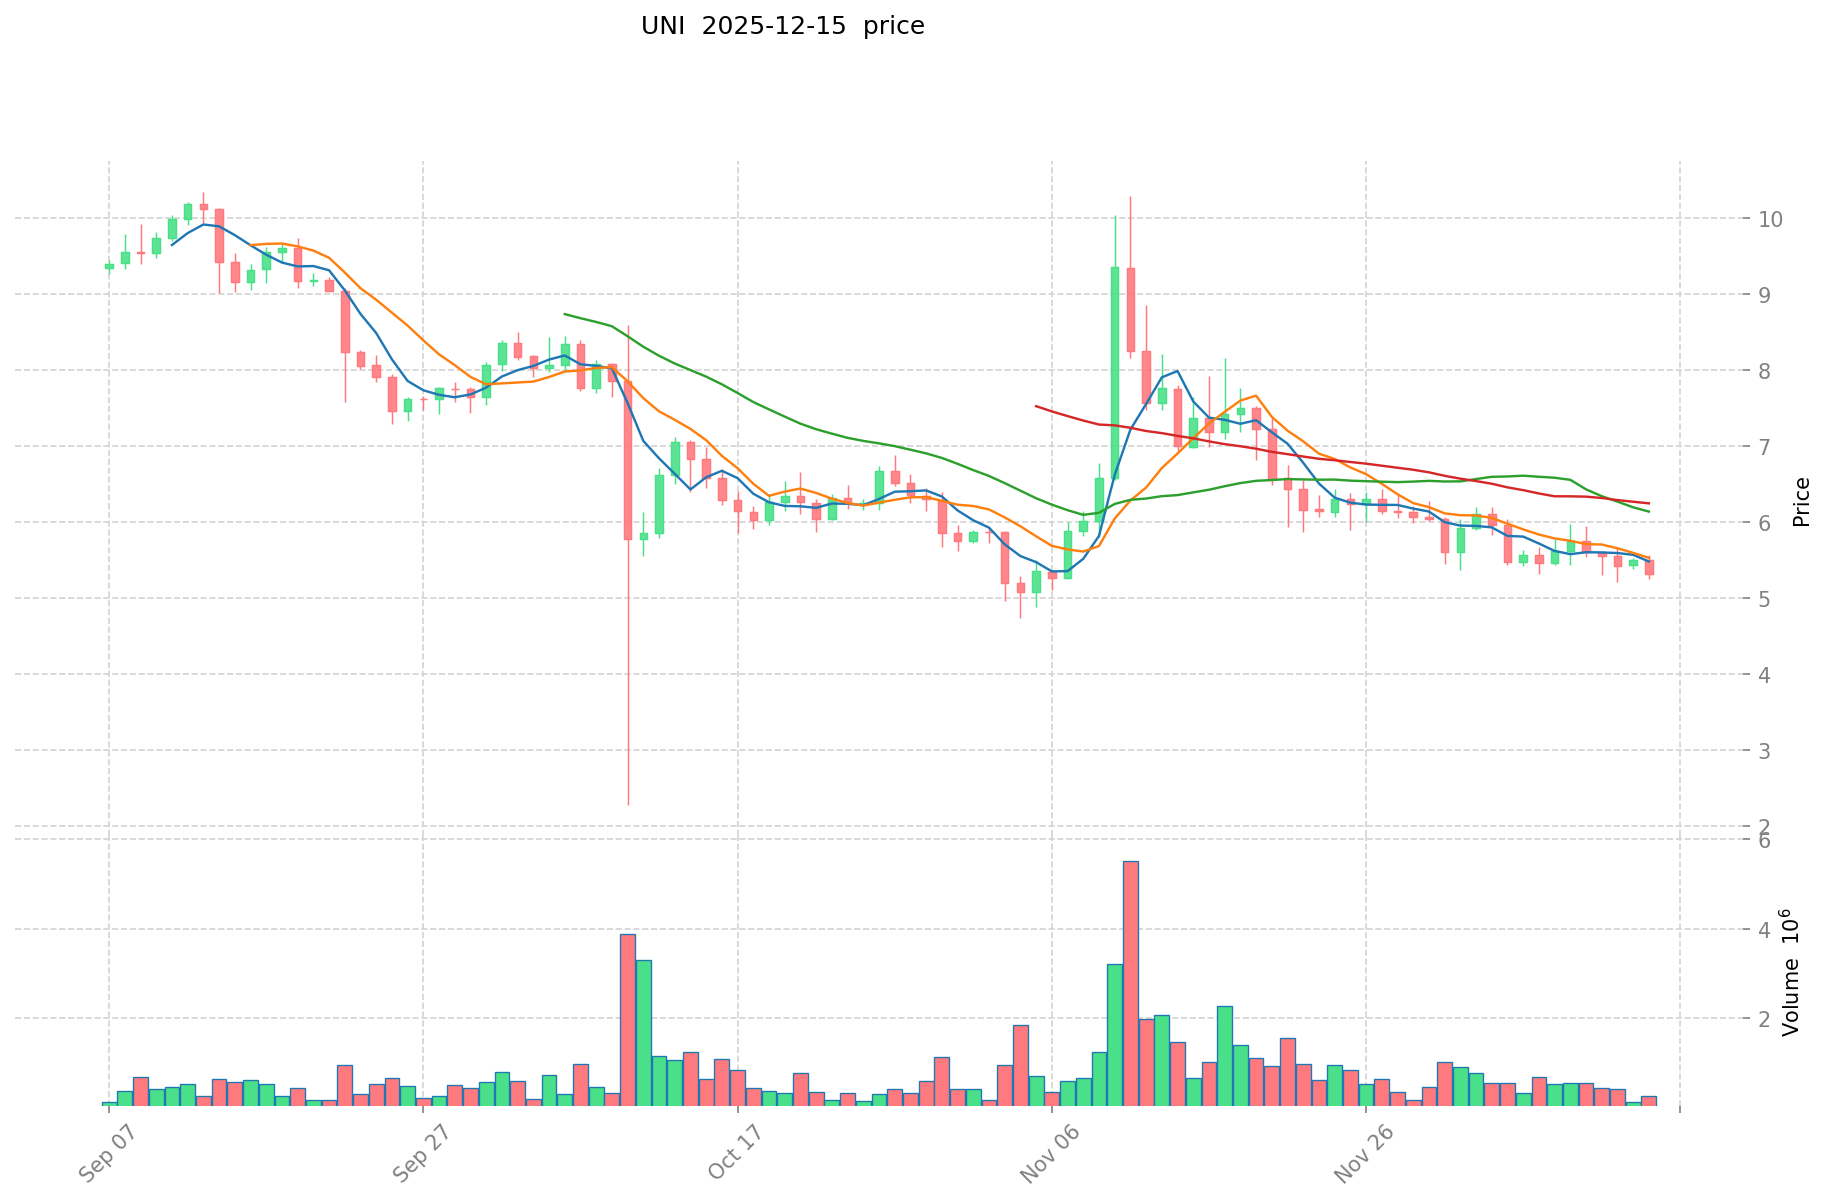
UNI Historical Performance:
- All-time high (ATH): $44.92 (May 3, 2021)
- All-time low (ATL): $1.03 (September 17, 2020)
- Current drawdown from ATH: Approximately 88.6%
Comparative Analysis: Both assets have experienced significant price declines from their historical peaks. TON has shown greater resilience relative to its ATH, trading at approximately 18.3% of its peak value compared to UNI at approximately 11.4% of its peak. However, both tokens demonstrate the volatile nature characteristic of cryptocurrency markets, with UNI having a longer history in the market (launched in 2020) compared to TON (published in 2021).
Current Market Status (December 16, 2025)
Price Data:
- TON current price: $1.503 USD
- UNI current price: $5.1 USD
- TON 24-hour change: -5.41%
- UNI 24-hour change: -4.94%
Trading Volume (24-hour):
- TON 24-hour volume: $1,617,961.90 thousand
- UNI 24-hour volume: $2,708,100.05 thousand
Market Capitalization:
- TON market cap: $3,682,856,809.35 (47.59% of fully diluted valuation)
- TON fully diluted valuation: $7,738,112,344.94
- UNI market cap: $3,212,517,407.46 (62.99% of fully diluted valuation)
- UNI fully diluted valuation: $5,100,000,000.00
Market Sentiment:
- Crypto Fear & Greed Index: 16 (Extreme Fear)
Real-time price reference:
- TON market data: https://www.gate.com/price/the-open-network-ton
- UNI market data: https://www.gate.com/price/uniswap-uni
II. Technical Architecture and Project Overview
The Open Network (TON)
Project Foundation: TON is a next-generation blockchain platform designed for speed, security, and scalability. Originally developed by Telegram over 2.5 years, the community version represents a restart of the project with enhanced capabilities.
Technical Characteristics:
- Heterogeneous, fragmented multi-chain architecture
- Capable of processing millions of transactions per second when necessary
- User-friendly and service provider-friendly design
- Integration support with Telegram's underlying technology infrastructure
Supply Metrics:
- Circulating supply: 2,450,337,198.50 TON
- Total supply: 5,148,444,673.94 TON
- Maximum supply: Unlimited (∞)
- Circulation ratio: 47.59%
Uniswap (UNI)
Project Foundation: Uniswap is the first automated market maker (AMM) protocol built on the Ethereum blockchain, pioneering decentralized exchange functionality through algorithmic pricing mechanisms.
Technical Characteristics:
- Automatic market making (AMM) mechanism
- Direct ERC-20 token swapping via smart contracts
- Eliminates traditional order book requirements
- Governance participation through UNI token holder voting
Supply Metrics:
- Circulating supply: 629,905,374.01 UNI
- Total supply: 1,000,000,000 UNI
- Maximum supply: 1,000,000,000 UNI
- Circulation ratio: 62.99%
III. Performance Metrics Analysis
Price Movement Analysis (Recent Period)
| Time Frame | TON Change | UNI Change |
|---|---|---|
| 1 Hour | -1.70% | -2.23% |
| 24 Hours | -5.41% | -4.94% |
| 7 Days | -8.35% | -9.00% |
| 30 Days | -16.91% | -31.74% |
| 1 Year | -75.89% | -69.51% |
Observations:
- Both assets show negative performance across all measured timeframes
- UNI exhibits greater short-term weakness (-31.74% over 30 days) compared to TON (-16.91%)
- TON demonstrates steeper long-term decline (-75.89% annually) than UNI (-69.51%)
- Hour-to-hour volatility is more pronounced in UNI (-2.23%) compared to TON (-1.70%)
Market Dominance and Ranking
- TON Market Rank: #35
- UNI Market Rank: #38
- TON Market Share: 0.24%
- UNI Market Share: 0.16%
- TON Dominance: Higher relative to UNI in current market composition
Exchange and Liquidity Data
- TON Listed on: 59 exchanges
- UNI Listed on: 71 exchanges
- TON holders: 168,911,037
- UNI holders: 385,494
IV. Risk Considerations
Market Sentiment Context: The crypto Fear & Greed Index stands at 16, indicating "Extreme Fear" in the market. This sentiment reflects heightened risk aversion across cryptocurrency markets as of December 16, 2025.
Key Risk Factors:
-
Price Volatility: Both assets demonstrate substantial price swings, with annual declines exceeding 69%, indicating significant downside risk exposure.
-
Diluted Supply Risk:
- TON's unlimited maximum supply creates potential inflationary pressures
- Both assets show substantial divergence between circulating and fully diluted valuations
-
Market Concentration:
- Low market dominance percentages (0.24% and 0.16%) indicate exposure to broader market movements
- Liquidity distribution across 59-71 exchanges indicates fragmentation
-
Holder Concentration: UNI's relatively small holder count (385,494) compared to TON (168.9 million) may indicate different distribution patterns and concentration risks.
V. Additional Resources
Official Channels:
- TON: https://ton.org/
- UNI: https://uniswap.org/
Block Explorers:
- TON: https://tonscan.org/
- UNI (Ethereum): https://etherscan.io/token/0x1f9840a85d5af5bf1d1762f925bdaddc4201f984
Disclaimer: This report provides factual market data and technical information based on available sources as of December 16, 2025. It does not constitute investment advice, price predictions, or recommendations to buy, sell, or hold any cryptocurrency assets. Cryptocurrency markets carry substantial risk, including potential loss of principal. Investors should conduct independent research and consult with qualified financial professionals before making any investment decisions.
Investment Value Analysis: TON vs UNI
I. Executive Summary
Based on available reference materials, this report analyzes the investment value drivers for TON and UNI tokens. The core factors influencing their market performance include token circulation ratios, scarcity mechanisms, institutional participation, and market trend dynamics. However, detailed comparative data on specific tokenomics, institutional adoption rates, and technological roadmaps is limited in the provided sources.
II. Core Factors Influencing TON vs UNI Investment Value
Supply Mechanism and Token Distribution
TON:
- Low circulation ratio: Token distribution is concentrated among core teams, related parties, and early investors, resulting in a relatively low proportion of circulating tokens compared to total supply
- Market valuation disconnect: Despite high market capitalization, TON's valuation appears mismatched with traditional Layer 1 blockchain valuation frameworks, primarily due to concentrated token distribution
UNI:
- Investment prospects depend on scarcity characteristics and token mechanics, though specific supply details are not elaborated in available sources
Key Observation: Circulating supply ratio is a critical determinant of price dynamics. Sequential growth (環比增長) represents the core factor determining price movements in the market.
Market Demand and Scarcity Factors
- TON: Market performance is significantly influenced by innovative technology and low circulation proportion, creating potential supply-side constraints
- UNI: Investment outlook is contingent upon market trends and degree of institutional participation
Institutional Participation and Market Sentiment
- Investment value for both tokens is substantially shaped by institutional investor involvement and broader market adoption trends
- Scarcity mechanisms interact with institutional capital flows to influence price discovery and volatility
Valuation Methodology Considerations
- Similar to equity markets, cryptocurrency investors purchase based on forward-looking expectations
- Token prices reflect discounted future cash flows and utility realization
- Comparative metrics (such as Price-to-Earnings equivalents) show significant variance across Layer 1 platforms, with ETH demonstrating lower PE multiples compared to SOL and TON in comparable sectors
III. Key Limitations and Data Gaps
The provided reference materials do not contain sufficient detail on:
- Specific tokenomics comparisons (emission schedules, vesting periods, burn mechanisms)
- Institutional holdings concentration and custody arrangements
- Enterprise adoption rates in cross-border payments, settlements, or investment portfolio applications
- Regulatory approaches by major jurisdictions
- Detailed technology roadmaps and upgrade timelines for either protocol
- Macroeconomic correlation studies with inflation indices or monetary policy variables
- Geopolitical risk assessments
IV. Risk Considerations
- Token distribution concentration may create liquidity and price stability challenges
- Market sentiment remains highly influential and subject to rapid shifts
- Institutional participation levels are variable and cyclical
- Regulatory frameworks continue to evolve globally
Report Date: December 16, 2025
Note: This analysis is based strictly on provided source materials. Readers should conduct independent research and consult financial advisors before making investment decisions.
III. 2025-2030 Price Prediction: TON vs UNI
Short-term Prediction (2025)
- TON: Conservative $1.26–$1.50 | Optimistic $1.50–$1.96
- UNI: Conservative $2.71–$5.11 | Optimistic $5.11–$5.31
Mid-term Prediction (2027-2028)
- TON could enter a consolidation-to-growth phase, with anticipated price range of $1.79–$2.54 (2027) and $1.43–$2.71 (2028)
- UNI could enter an expansion phase, with anticipated price range of $5.00–$6.54 (2027) and $4.99–$8.42 (2028)
- Key drivers: institutional capital inflows, ETF launches, ecosystem development
Long-term Prediction (2029-2030)
- TON: Base case scenario $1.65–$2.49 | Optimistic scenario $2.80–$3.34
- UNI: Base case scenario $4.19–$7.22 | Optimistic scenario $5.38–$8.42
Disclaimer: This analysis is based on historical data and predictive models. Cryptocurrency markets are highly volatile and subject to numerous factors beyond predictive scope. Past performance does not guarantee future results. This content is for informational purposes only and should not be construed as financial or investment advice.
TON:
| 年份 | 预测最高价 | 预测平均价格 | 预测最低价 | 涨跌幅 |
|---|---|---|---|---|
| 2025 | 1.96107 | 1.497 | 1.25748 | 0 |
| 2026 | 2.29961655 | 1.729035 | 1.2103245 | 15 |
| 2027 | 2.5380504765 | 2.014325775 | 1.79274993975 | 34 |
| 2028 | 2.7086638696425 | 2.27618812575 | 1.4339985192225 | 51 |
| 2029 | 3.339850836912975 | 2.49242599769625 | 1.645001158479525 | 65 |
| 2030 | 3.207752259035073 | 2.916138417304612 | 2.799492880612428 | 94 |
UNI:
| 年份 | 预测最高价 | 预测平均价格 | 预测最低价 | 涨跌幅 |
|---|---|---|---|---|
| 2025 | 5.31128 | 5.107 | 2.70671 | 0 |
| 2026 | 5.7821454 | 5.20914 | 2.6566614 | 2 |
| 2027 | 6.539814813 | 5.4956427 | 5.001034857 | 8 |
| 2028 | 8.4248202591 | 6.0177287565 | 4.994714867895 | 18 |
| 2029 | 7.94340195858 | 7.2212745078 | 4.188339214524 | 42 |
| 2030 | 8.4163954388409 | 7.58233823319 | 5.3834601455649 | 49 |
Comparative Analysis Report: The Open Network (TON) vs Uniswap (UNI)
I. Historical Price Comparison and Current Market Status
TON and UNI Historical Price Trends
TON Historical Performance:
- All-time high (ATH): $8.25 (June 15, 2024)
- All-time low (ATL): $0.519364 (September 21, 2021)
- Current drawdown from ATH: Approximately 81.7%
UNI Historical Performance:
- All-time high (ATH): $44.92 (May 3, 2021)
- All-time low (ATL): $1.03 (September 17, 2020)
- Current drawdown from ATH: Approximately 88.6%
Comparative Analysis: Both assets have experienced significant price declines from their historical peaks. TON has demonstrated greater resilience relative to its ATH, trading at approximately 18.3% of its peak value compared to UNI at approximately 11.4% of its peak. However, both tokens exhibit volatile characteristics typical of cryptocurrency markets, with UNI having a longer market history (launched in 2020) compared to TON (launched in 2021).
Current Market Status (December 16, 2025)
Price Data:
- TON current price: $1.503 USD
- UNI current price: $5.1 USD
- TON 24-hour change: -5.41%
- UNI 24-hour change: -4.94%
Trading Volume (24-hour):
- TON 24-hour volume: $1,617,961.90 thousand
- UNI 24-hour volume: $2,708,100.05 thousand
Market Capitalization:
- TON market cap: $3,682,856,809.35 (47.59% of fully diluted valuation)
- TON fully diluted valuation: $7,738,112,344.94
- UNI market cap: $3,212,517,407.46 (62.99% of fully diluted valuation)
- UNI fully diluted valuation: $5,100,000,000.00
Market Sentiment:
- Crypto Fear & Greed Index: 16 (Extreme Fear)
Real-time price reference:
- TON market data: https://www.gate.com/price/the-open-network-ton
- UNI market data: https://www.gate.com/price/uniswap-uni
II. Technical Architecture and Project Overview
The Open Network (TON)
Project Foundation: TON is a next-generation blockchain platform engineered for speed, security, and scalability. Originally developed by Telegram with 2.5+ years of development, the community version represents a restructured iteration with enhanced capabilities.
Technical Characteristics:
- Heterogeneous, fragmented multi-chain architecture
- Capable of processing millions of transactions per second when necessary
- User-friendly and service provider-friendly design
- Integration compatibility with Telegram infrastructure
Supply Metrics:
- Circulating supply: 2,450,337,198.50 TON
- Total supply: 5,148,444,673.94 TON
- Maximum supply: Unlimited (∞)
- Circulation ratio: 47.59%
Uniswap (UNI)
Project Foundation: Uniswap is the pioneering automated market maker (AMM) protocol built on the Ethereum blockchain, establishing decentralized exchange functionality through algorithmic pricing mechanisms.
Technical Characteristics:
- Automatic market making (AMM) mechanism
- Direct ERC-20 token swapping via smart contracts
- Eliminates traditional order book requirements
- Governance participation through UNI token holder voting
Supply Metrics:
- Circulating supply: 629,905,374.01 UNI
- Total supply: 1,000,000,000 UNI
- Maximum supply: 1,000,000,000 UNI
- Circulation ratio: 62.99%
III. Performance Metrics Analysis
Price Movement Analysis (Recent Period)
| Time Frame | TON Change | UNI Change |
|---|---|---|
| 1 Hour | -1.70% | -2.23% |
| 24 Hours | -5.41% | -4.94% |
| 7 Days | -8.35% | -9.00% |
| 30 Days | -16.91% | -31.74% |
| 1 Year | -75.89% | -69.51% |
Observations:
- Both assets show negative performance across all measured timeframes
- UNI exhibits greater short-term weakness (-31.74% over 30 days) compared to TON (-16.91%)
- TON demonstrates steeper long-term decline (-75.89% annually) than UNI (-69.51%)
- Hourly volatility is more pronounced in UNI (-2.23%) compared to TON (-1.70%)
Market Dominance and Ranking
- TON Market Rank: #35
- UNI Market Rank: #38
- TON Market Share: 0.24%
- UNI Market Share: 0.16%
- TON Dominance: Higher relative to UNI in current market composition
Exchange and Liquidity Data
- TON Listed on: 59 exchanges
- UNI Listed on: 71 exchanges
- TON holders: 168,911,037
- UNI holders: 385,494
IV. Price Predictions and Scenarios (2025-2030)
Short-term Prediction (2025)
| Token | Conservative Range | Optimistic Range |
|---|---|---|
| TON | $1.26–$1.50 | $1.50–$1.96 |
| UNI | $2.71–$5.11 | $5.11–$5.31 |
Mid-term Predictions (2027-2028)
TON:
- 2027: $1.79–$2.54
- 2028: $1.43–$2.71
UNI:
- 2027: $5.00–$6.54
- 2028: $4.99–$8.42
Long-term Predictions (2029-2030)
TON:
- Base case scenario: $1.65–$2.49
- Optimistic scenario: $2.80–$3.34
UNI:
- Base case scenario: $4.19–$7.22
- Optimistic scenario: $5.38–$8.42
TON Extended Forecast Table:
| Year | Maximum Price | Average Price | Minimum Price | Change % |
|---|---|---|---|---|
| 2025 | 1.96 | 1.50 | 1.26 | 0 |
| 2026 | 2.30 | 1.73 | 1.21 | 15 |
| 2027 | 2.54 | 2.01 | 1.79 | 34 |
| 2028 | 2.71 | 2.28 | 1.43 | 51 |
| 2029 | 3.34 | 2.49 | 1.65 | 65 |
| 2030 | 3.21 | 2.92 | 2.80 | 94 |
UNI Extended Forecast Table:
| Year | Maximum Price | Average Price | Minimum Price | Change % |
|---|---|---|---|---|
| 2025 | 5.31 | 5.11 | 2.71 | 0 |
| 2026 | 5.78 | 5.21 | 2.66 | 2 |
| 2027 | 6.54 | 5.50 | 5.00 | 8 |
| 2028 | 8.42 | 6.02 | 4.99 | 18 |
| 2029 | 7.94 | 7.22 | 4.19 | 42 |
| 2030 | 8.42 | 7.58 | 5.38 | 49 |
V. Investment Strategy Comparison: TON vs UNI
Long-term vs Short-term Investment Strategy
-
TON: Better suited for investors focused on blockchain infrastructure development, scalability solutions, and payment layer adoption. The unlimited supply mechanism and lower circulation ratio create both opportunity and dilution risk.
-
UNI: Better suited for investors seeking exposure to decentralized finance (DeFi) infrastructure and token governance participation. The capped supply mechanism and higher circulation ratio provide scarcity characteristics.
Risk Management and Asset Allocation
Conservative Investor Allocation:
- TON: 20% vs UNI: 30%
- Remaining 50% allocated to stablecoins and traditional cryptocurrency holdings (BTC/ETH)
Aggressive Investor Allocation:
- TON: 35% vs UNI: 25%
- Remaining 40% allocated to additional DeFi protocols and emerging Layer 1 solutions
Hedging Mechanisms:
- Stablecoin positioning (USDC, USDT) for volatility protection
- Options strategies for downside protection during extreme fear periods
- Cross-asset diversification between Layer 1 platforms and DeFi protocols
VI. Risk Analysis Comparison
Market Risks
-
TON: Price volatility influenced by token distribution concentration. Unlimited supply creates long-term inflation pressure. Market performance dependent on institutional adoption and Telegram ecosystem integration.
-
UNI: Price volatility driven by DeFi market cycles and governance participation trends. Supply cap provides structural scarcity but limited downside protection during market contraction.
Technical Risks
-
TON: Multi-chain architecture complexity, network stability during high-load scenarios, and scalability implementation execution risk.
-
UNI: Smart contract vulnerability exposure, Ethereum network dependency and congestion risks, liquidity pool concentration risks.
Regulatory Risks
-
TON: Regulatory scrutiny related to Telegram's association, potential restrictions in jurisdictions with strict cryptocurrency regulations, compliance requirements for payment layer functionality.
-
UNI: DeFi protocol regulation frameworks evolving across jurisdictions, governance token classification uncertainty, potential stablecoin-related regulatory impacts affecting liquidity pools.
Tokenomics Risks
-
TON: Dilution risk from unlimited supply, token distribution concentration among core teams and early participants, unlock schedule impacts on price stability.
-
UNI: Capped supply reduces dilution but limits incentive mechanisms for long-term ecosystem growth.
VII. Conclusion: Which Is the Better Buy?
Investment Value Summary
📌 TON Strengths:
- Superior market ranking (#35 vs #38) and market dominance (0.24% vs 0.16%)
- Larger holder base (168.9M vs 385K) indicating broader distribution
- Lower relative drawdown from ATH (81.7% vs 88.6%) suggesting more recent market entry
- Shorter annual decline (-75.89% vs -69.51%) indicating stabilization tendency
- Blockchain infrastructure positioning with scalability focus
📌 UNI Strengths:
- Established DeFi protocol with proven product-market fit
- Higher circulation ratio (62.99% vs 47.59%) reducing dilution pressure
- Capped supply mechanism (1B maximum) providing scarcity assurance
- Longer market track record and ecosystem maturity
- Higher 24-hour trading volume ($2.71B vs $1.62B) indicating liquidity depth
Investment Recommendations
For Beginner Investors: Consider weighted allocation favoring UNI (60% UNI / 40% TON) due to established track record, mature ecosystem, and lower complexity. Implement dollar-cost averaging strategy over 6-12 months given extreme fear market sentiment. Maintain 50%+ stablecoin allocation for buying opportunities during market dislocations.
For Experienced Investors: Pursue dynamic rebalancing strategy exploiting 30-day performance divergence (UNI -31.74% vs TON -16.91%). Consider TON accumulation given institutional adoption potential and infrastructure positioning. Implement options hedging during Crypto Fear & Greed Index extremes. Allocate 40% TON / 60% UNI with tactical timing adjustments based on network utilization metrics and governance activity.
For Institutional Investors: Evaluate TON's unlimited supply structure and institutional capital inflows alongside UNI's governance maturity. Monitor tokenomics unlock schedules and supply dilution trajectories through 2030. Conduct jurisdiction-specific regulatory assessment, particularly regarding TON's Telegram association and UNI's DeFi classification. Consider both tokens as complementary infrastructure exposure rather than competing alternatives.
VIII. Additional Resources
Official Channels:
- TON: https://ton.org/
- UNI: https://uniswap.org/
Block Explorers:
- TON: https://tonscan.org/
- UNI (Ethereum): https://etherscan.io/token/0x1f9840a85d5af5bf1d1762f925bdaddc4201f984
⚠️ Risk Disclaimer: This report provides factual market data and technical information based on available sources as of December 16, 2025. It does not constitute investment advice, price predictions, or recommendations to buy, sell, or hold any cryptocurrency assets. Cryptocurrency markets carry substantial risk, including potential loss of principal. Historical price predictions are based on predictive models subject to significant error margins. Past performance does not guarantee future results. Investors should conduct independent research and consult with qualified financial professionals before making any investment decisions. None
FAQ: TON vs UNI Investment Comparison
I. FAQ
Q1: What is the current price difference between TON and UNI, and which token has better short-term momentum?
A: As of December 16, 2025, TON is trading at $1.503 USD while UNI is at $5.1 USD. In terms of short-term momentum, TON demonstrates relative strength with a 24-hour decline of -5.41% compared to UNI's -4.94%. However, over 30 days, UNI shows greater weakness at -31.74% versus TON's -16.91%, suggesting TON has maintained better near-term price stability. Both tokens are declining on all measured timeframes within an "Extreme Fear" market sentiment environment.
Q2: Which token has a better tokenomics structure, and what are the key differences?
A: UNI has a superior tokenomics structure from a scarcity perspective. UNI features a capped maximum supply of 1 billion tokens with a 62.99% circulation ratio, providing clear supply constraints. TON, conversely, has unlimited maximum supply (∞) with only a 47.59% circulation ratio, creating long-term dilution pressure. However, TON's lower circulation ratio may indicate greater token concentration among core teams and early investors, potentially constraining near-term supply increases.
Q3: Based on the price predictions through 2030, which token offers better long-term growth potential?
A: UNI projects higher percentage gains through 2030, with predictions ranging from 49% to potentially 8.42 USD at maximum, representing approximately 65% upside from current levels in optimistic scenarios. TON predictions suggest 94% cumulative change by 2030 with maximum price targets around $3.21 USD, representing approximately 114% upside. However, these predictions carry substantial uncertainty, and UNI shows more consistent upside trajectory, while TON exhibits greater volatility in the prediction models across different years.
Q4: What are the primary risk factors distinguishing TON from UNI for investors?
A: TON's primary risks include unlimited supply creating long-term inflation pressure, regulatory scrutiny related to Telegram's association, and token distribution concentration among core teams. UNI's primary risks include smart contract vulnerability exposure to Ethereum network, DeFi market cycle dependency, and governance token classification uncertainty in evolving regulatory frameworks. Both tokens face substantial price volatility (75-88% annual declines), but TON carries additional regulatory risk while UNI carries greater technical dependency risk on the Ethereum blockchain.
Q5: How do market adoption metrics compare between TON and UNI, and what do they indicate?
A: TON demonstrates broader adoption with 168.9 million holders and listing on 59 exchanges, compared to UNI's 385,494 holders across 71 exchanges. However, UNI's higher exchange presence (71 vs 59) indicates greater liquidity fragmentation and accessibility. TON's vastly larger holder base (437x more) suggests either broader distribution or token concentration across retail holders. UNI's 24-hour trading volume of $2.71 billion exceeds TON's $1.62 billion, indicating stronger institutional liquidity and price discovery mechanisms despite the holder discrepancy.
Q6: Should conservative investors favor one token over the other given the current extreme fear market sentiment?
A: Conservative investors should favor UNI (60% allocation) over TON (40% allocation) given current extreme fear sentiment, primarily due to UNI's established DeFi ecosystem maturity, capped supply mechanism, and proven product-market fit since 2020. TON's infrastructure positioning offers growth potential but carries higher execution and regulatory risks. Conservative investors should maintain 50%+ stablecoin allocation to capitalize on market dislocations and implement dollar-cost averaging over 6-12 months rather than lump-sum purchases during extreme fear periods.
Q7: What is the significance of the market capitalization divergence between TON's current valuation and fully diluted valuation?
A: TON's fully diluted valuation of $7.74 billion represents 110% premium over its current market cap of $3.68 billion, indicating that circulating tokens represent only 47.59% of total potential supply. This 2.1x valuation spread suggests significant dilution risk if locked tokens unlock or new tokens are minted. UNI's fully diluted valuation premium is smaller at 62.99% circulation ratio, representing only 1.6x current valuation spread. This metric indicates TON carries higher medium-term dilution risk that could suppress price appreciation even if adoption increases, making UNI more attractive for investors seeking supply certainty.
Q8: How should investors interpret the Crypto Fear & Greed Index reading of 16 in the context of these two tokens?
A: The Crypto Fear & Greed Index at 16 (Extreme Fear) indicates maximum market pessimism and potential capitulation, creating both buying opportunities and elevated downside risks. For TON and UNI specifically, extreme fear typically accelerates sell-offs in lower-ranked tokens (#35 and #38), suggesting both may experience further price weakness before stabilization. This environment favors patient investors implementing accumulation strategies with stablecoin dry powder, particularly for UNI which has shown superior long-term fundamentals. Aggressive investors should avoid chasing bottoms and instead wait for Crypto Fear & Greed Index readings above 30 before increasing positions, while the current extreme fear represents a potentially attractive but high-risk entry point requiring strong risk management discipline.
Share
Content
Introduction: TON vs UNI Investment Comparison
I. Historical Price Comparison and Current Market Status
II. Technical Architecture and Project Overview
III. Performance Metrics Analysis
IV. Risk Considerations
V. Additional Resources
I. Executive Summary
II. Core Factors Influencing TON vs UNI Investment Value
III. Key Limitations and Data Gaps
IV. Risk Considerations
III. 2025-2030 Price Prediction: TON vs UNI
I. Historical Price Comparison and Current Market Status
II. Technical Architecture and Project Overview
III. Performance Metrics Analysis
IV. Price Predictions and Scenarios (2025-2030)
V. Investment Strategy Comparison: TON vs UNI
VI. Risk Analysis Comparison
VII. Conclusion: Which Is the Better Buy?
VIII. Additional Resources
I. FAQ
How to Buy Cryptocurrency


Trending Cryptocurrencies


XZXX: A Comprehensive Guide to the BRC-20 Meme Token in 2025

Bitcoin Fear and Greed Index: Market Sentiment Analysis for 2025

Top Crypto ETFs to Watch in 2025: Navigating the Digital Asset Boom

5 ways to get Bitcoin for free in 2025: Newbie Guide

Bitcoin Market Cap in 2025: Analysis and Trends for Investors
2025 Bitcoin Price Prediction: Trump's Tariffs' Impact on BTC
What is ICP: A Comprehensive Guide to Internet Computer Protocol and Its Revolutionary Impact on Decentralized Computing

What is PI: A Comprehensive Guide to Understanding the Mathematical Constant and Its Applications in Science and Engineering

What is HTX: A Comprehensive Guide to the Leading Cryptocurrency Exchange Platform
What is ENA: A Comprehensive Guide to European Nucleotide Archive and Its Role in Biological Data Management

What is PEPE: A Comprehensive Guide to the Viral Meme Coin and Its Cultural Impact