Bitcoin traded at $70,795 on March 14, 2026, with a market capitalization of $1.41 trillion and 24-hour trading volume of $49.48 billion. The cryptocurrency moved within an intraday range between $70,416 and $73,838 while technical indicators across major timeframes reflected a neutral market structure.
Bitcoin Chart Outlook
On the daily chart, bitcoin continues to trade inside a consolidation range following a rejection near the $74,000 resistance zone. Current price levels around $70,467 on Bitstamp place the asset in the middle of a broader visible trading band between approximately $63,000 and $77,500.
Market structure reflects sideways movement with declining volatility after the rejection near recent highs. Key resistance remains between $73,800 and $74,000, while mid-range resistance sits near $71,200. Support is identified around $69,500, with stronger structural support near $66,000. As long as the price remains above the $69,500 level, the broader bias remains neutral to slightly upward within the existing range.
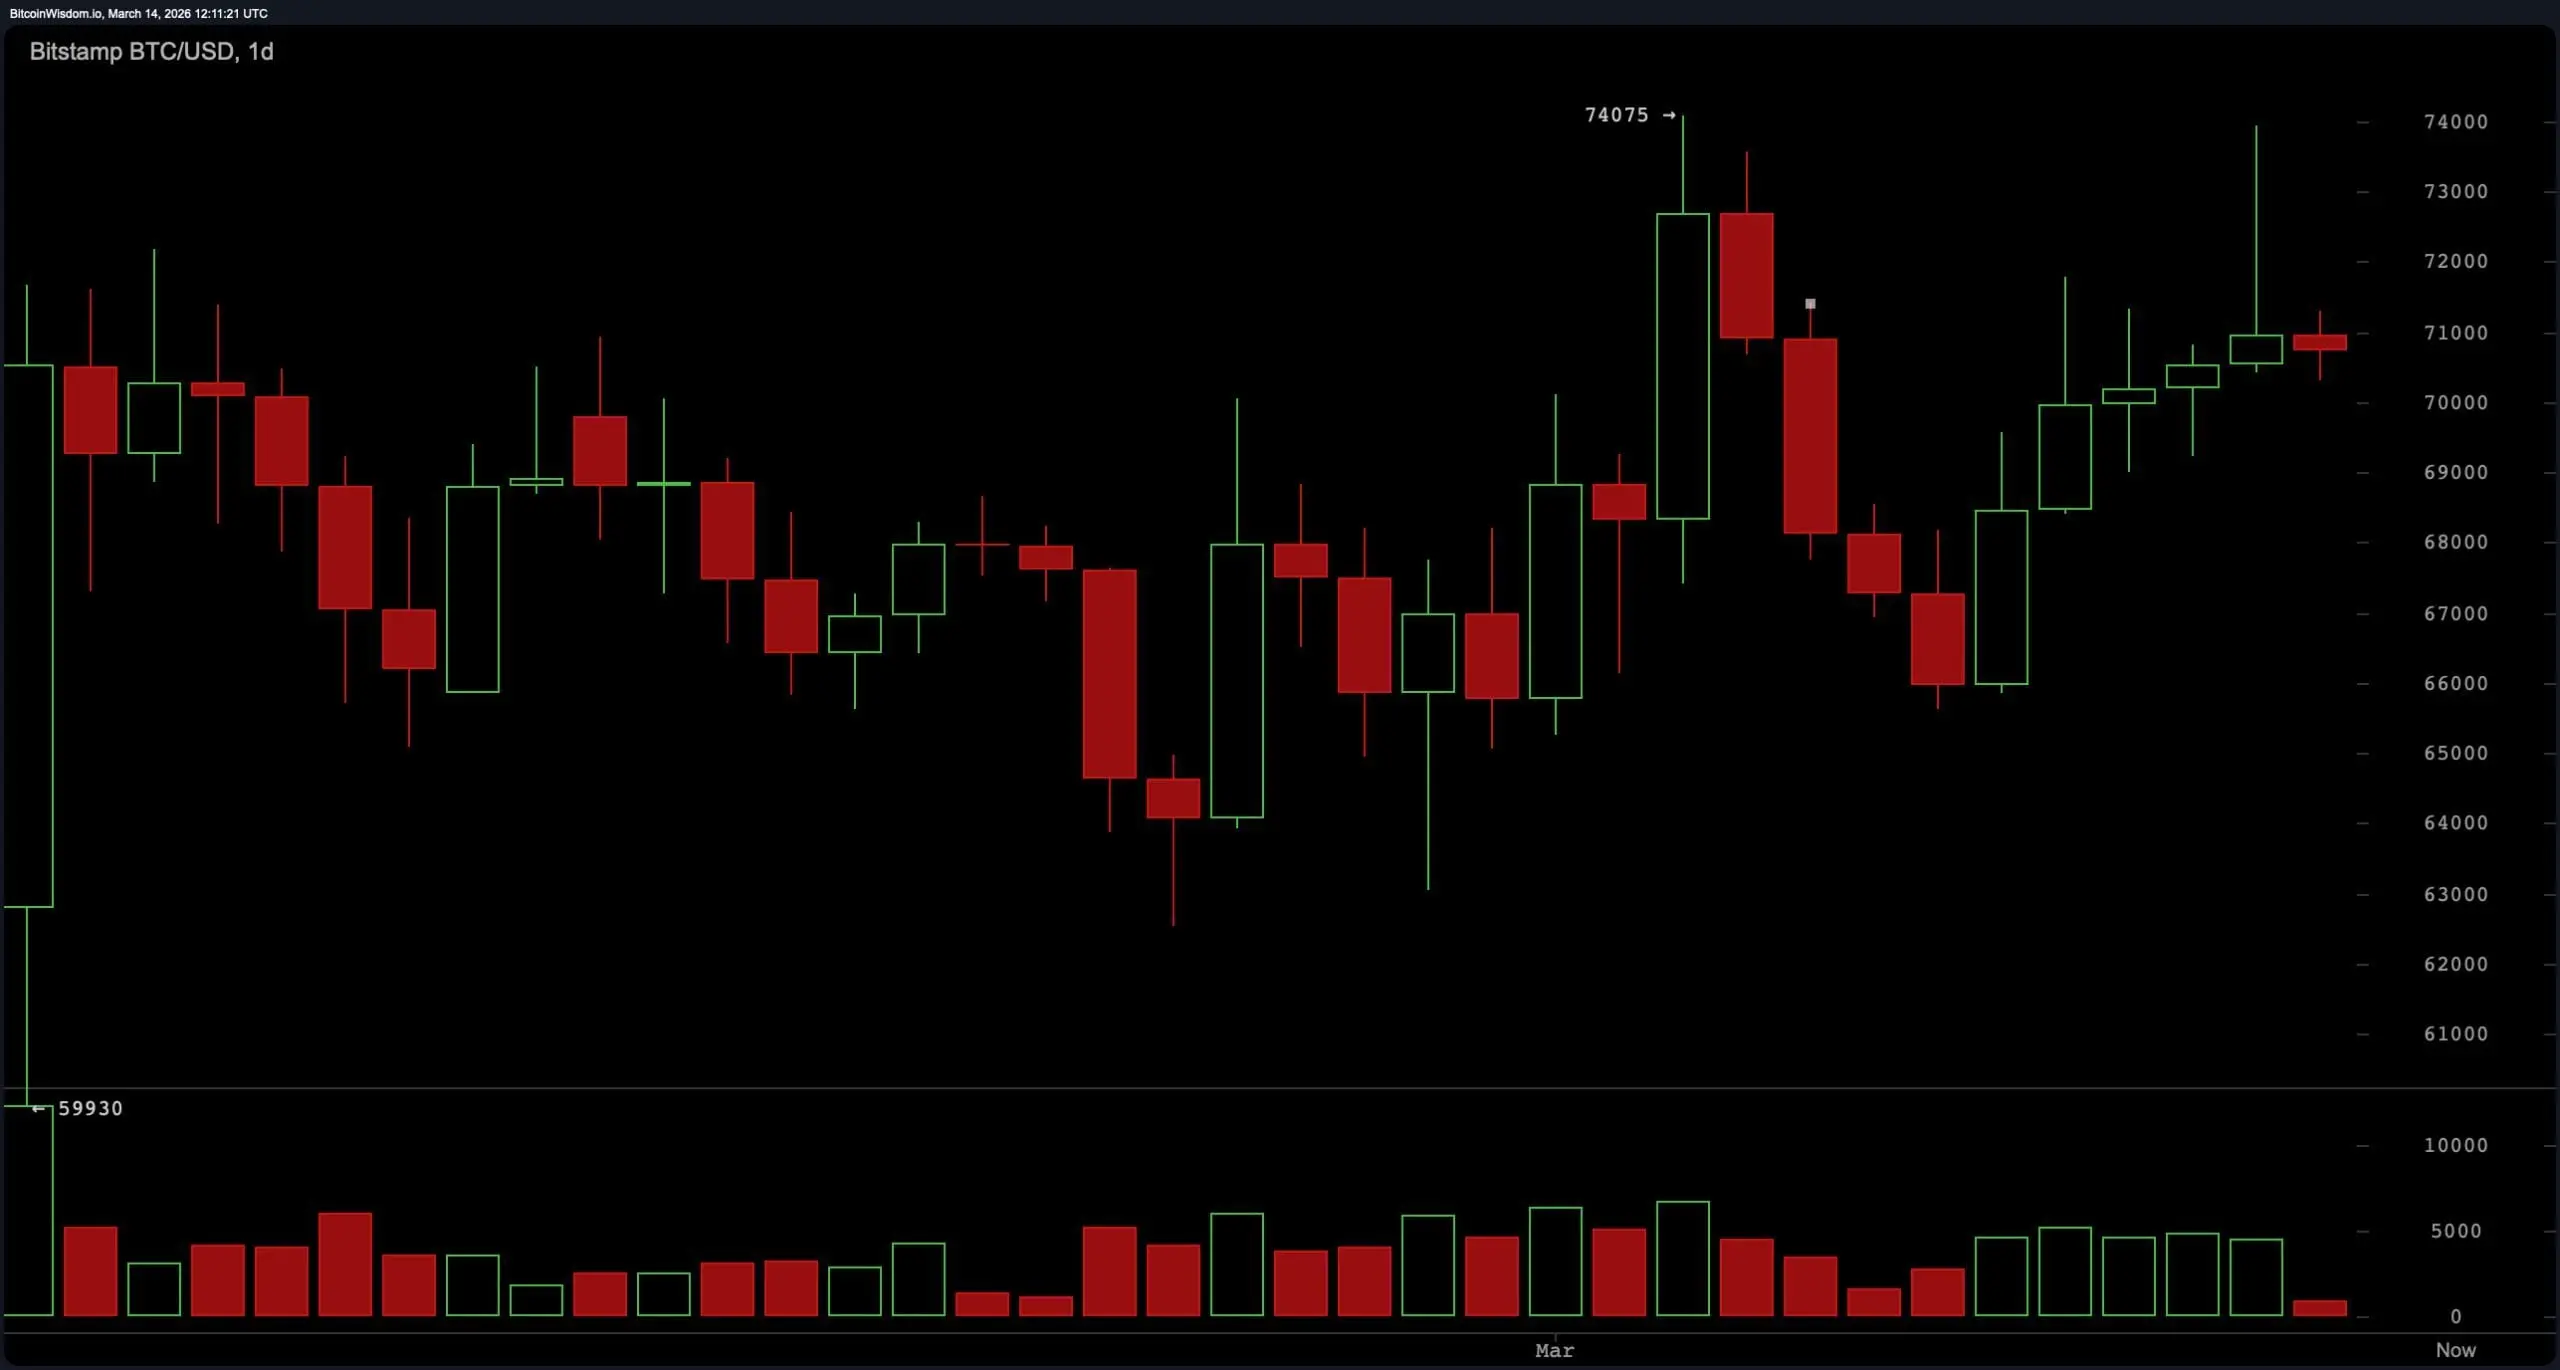 BTC/USD 1-day chart via Bitstamp on March 14, 2026.
The four-hour bitcoin chart shows continued sideways consolidation supported by a sequence of higher lows. Previous swing levels progressed from approximately $65,600 to $69,000 and then to near $70,000, suggesting gradual upward pressure beneath resistance. Price has repeatedly encountered resistance between $71,500 and $72,000, creating a compression pattern as volatility narrows. This type of price structure often precedes expansion once resistance or support is decisively breached. The current compression below resistance indicates that a move beyond this zone could determine the next directional move of roughly $3,000 to $5,000.
BTC/USD 1-day chart via Bitstamp on March 14, 2026.
The four-hour bitcoin chart shows continued sideways consolidation supported by a sequence of higher lows. Previous swing levels progressed from approximately $65,600 to $69,000 and then to near $70,000, suggesting gradual upward pressure beneath resistance. Price has repeatedly encountered resistance between $71,500 and $72,000, creating a compression pattern as volatility narrows. This type of price structure often precedes expansion once resistance or support is decisively breached. The current compression below resistance indicates that a move beyond this zone could determine the next directional move of roughly $3,000 to $5,000.
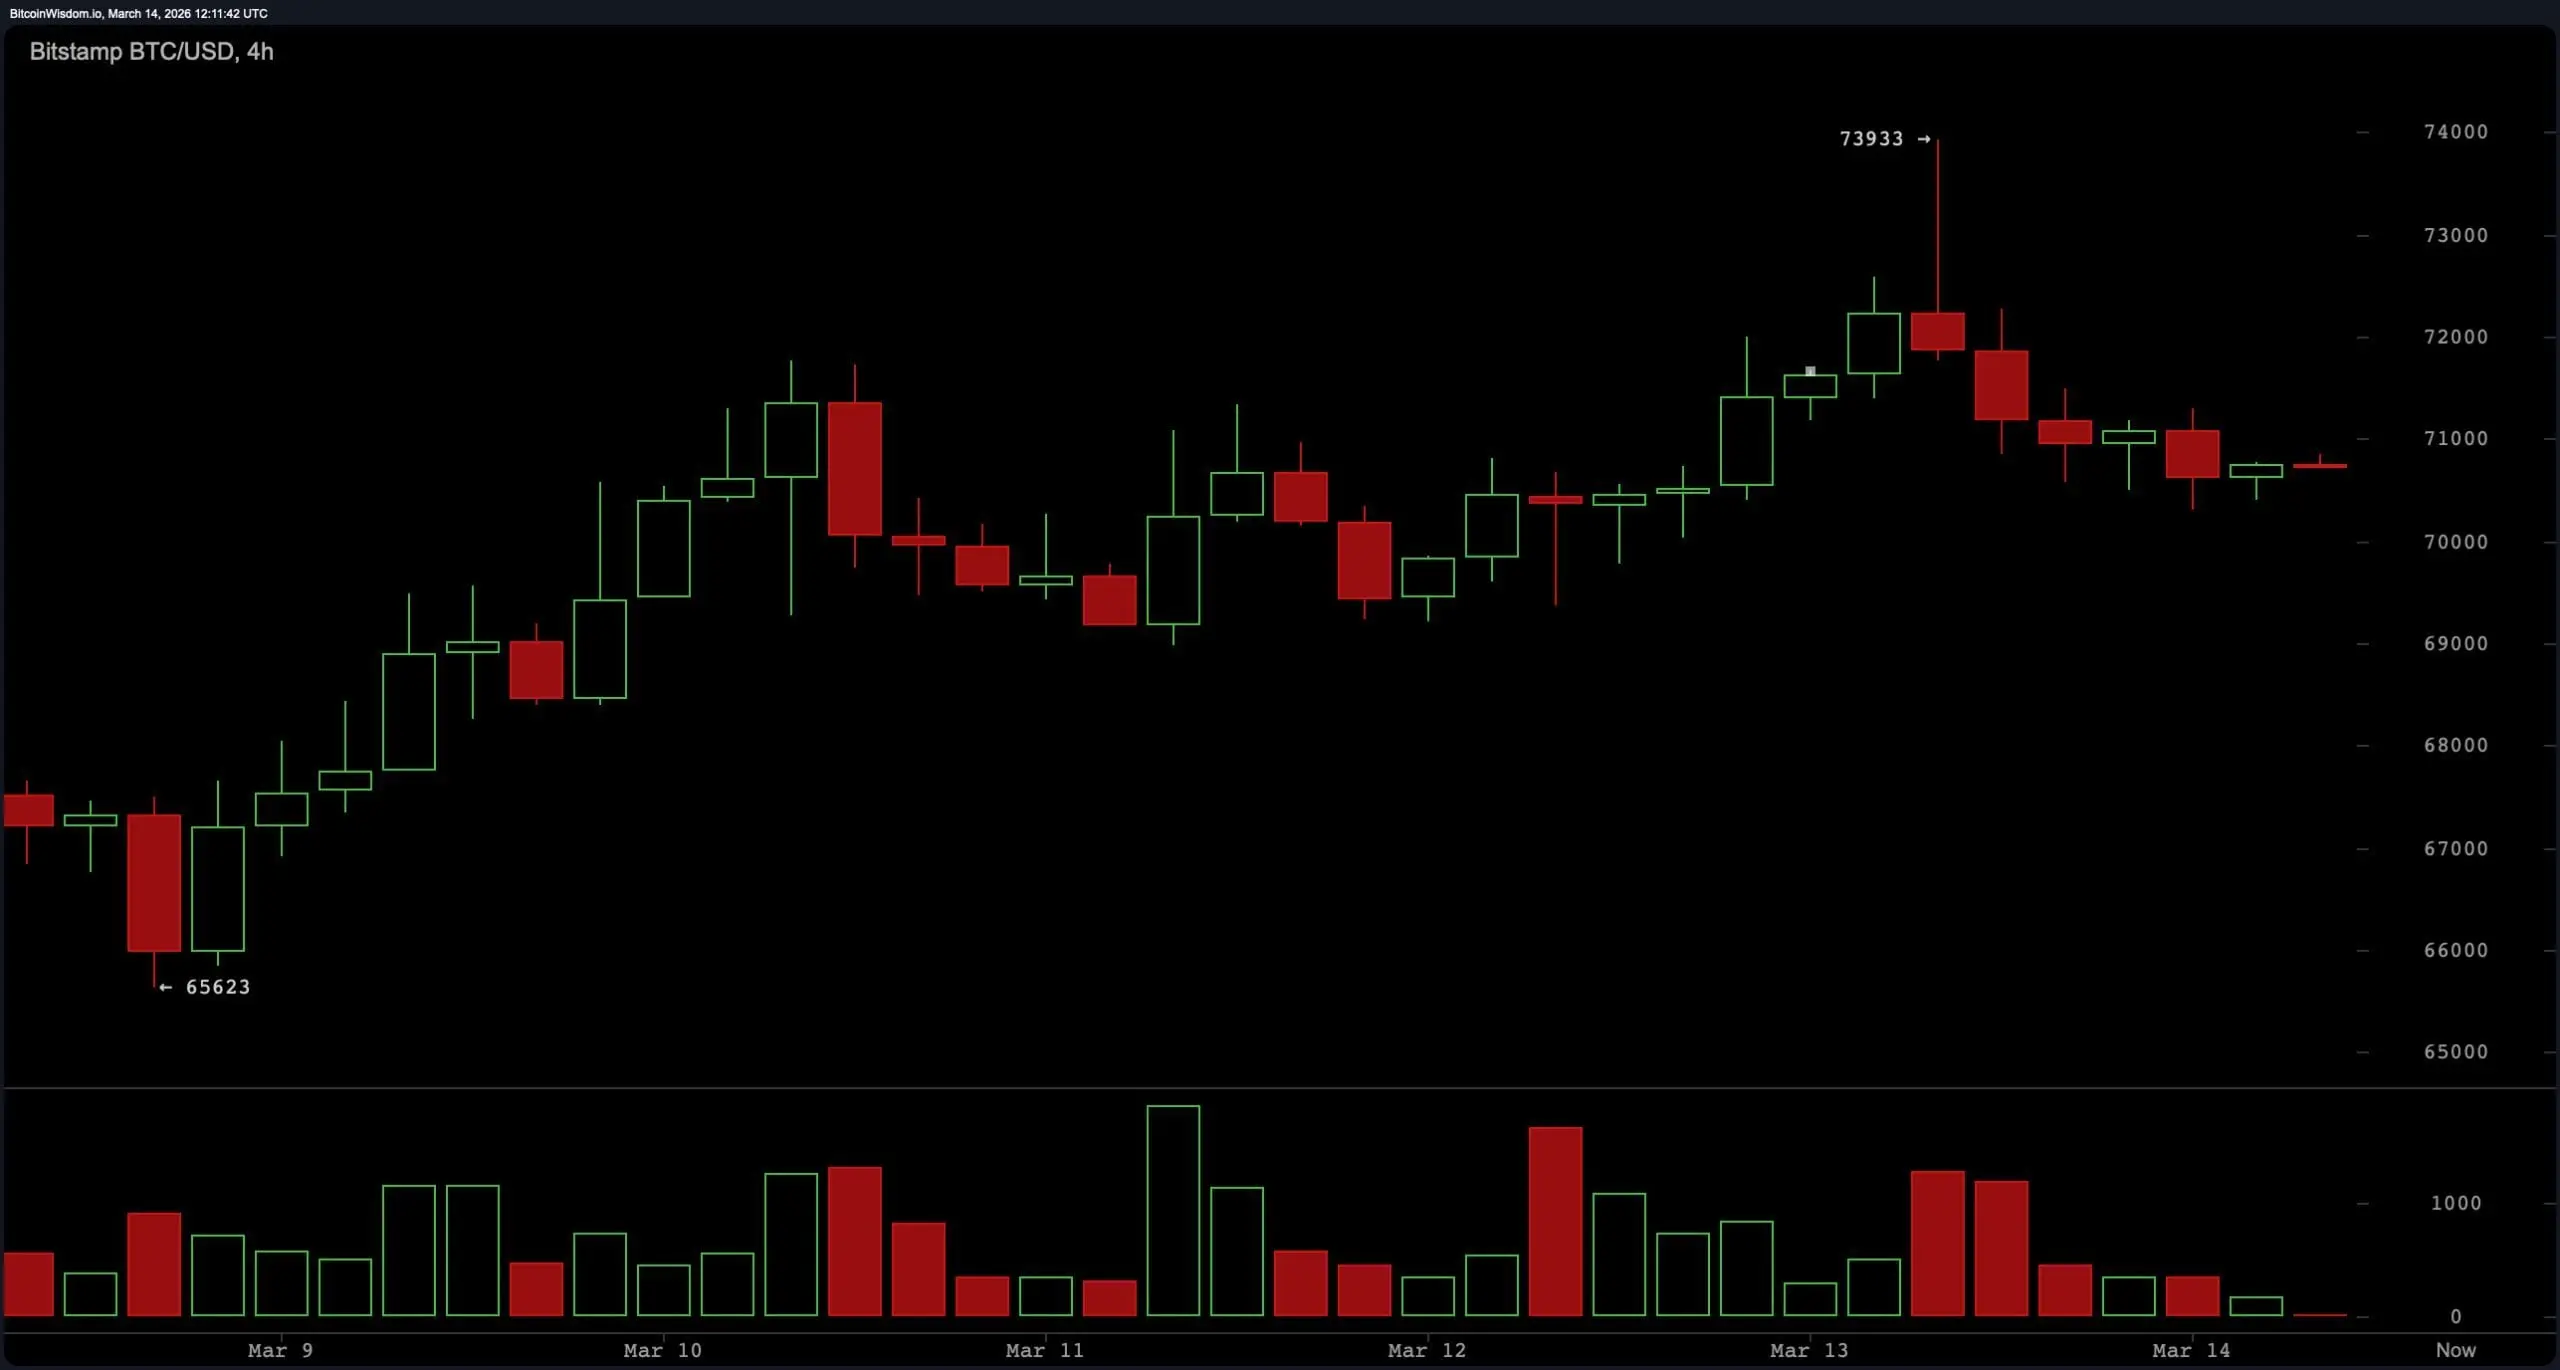 BTC/USD 4-hour chart via Bitstamp on March 14, 2026.
On the one-hour chart, bitcoin is trading within a tight intraday range between $70,300 support and approximately $71,100 resistance. Price movement has remained contained inside this narrow band while trading volume gradually declines, reflecting short-term equilibrium between buyers and sellers. Intraday consolidation within this range suggests the market is awaiting a catalyst for a breakout. Sustained movement above the $71,200 level would place the price near the upper resistance band around $72,800 and $74,000, while a breakdown below $69,500 would expose lower support areas near $67,800 and $66,000.
BTC/USD 4-hour chart via Bitstamp on March 14, 2026.
On the one-hour chart, bitcoin is trading within a tight intraday range between $70,300 support and approximately $71,100 resistance. Price movement has remained contained inside this narrow band while trading volume gradually declines, reflecting short-term equilibrium between buyers and sellers. Intraday consolidation within this range suggests the market is awaiting a catalyst for a breakout. Sustained movement above the $71,200 level would place the price near the upper resistance band around $72,800 and $74,000, while a breakdown below $69,500 would expose lower support areas near $67,800 and $66,000.
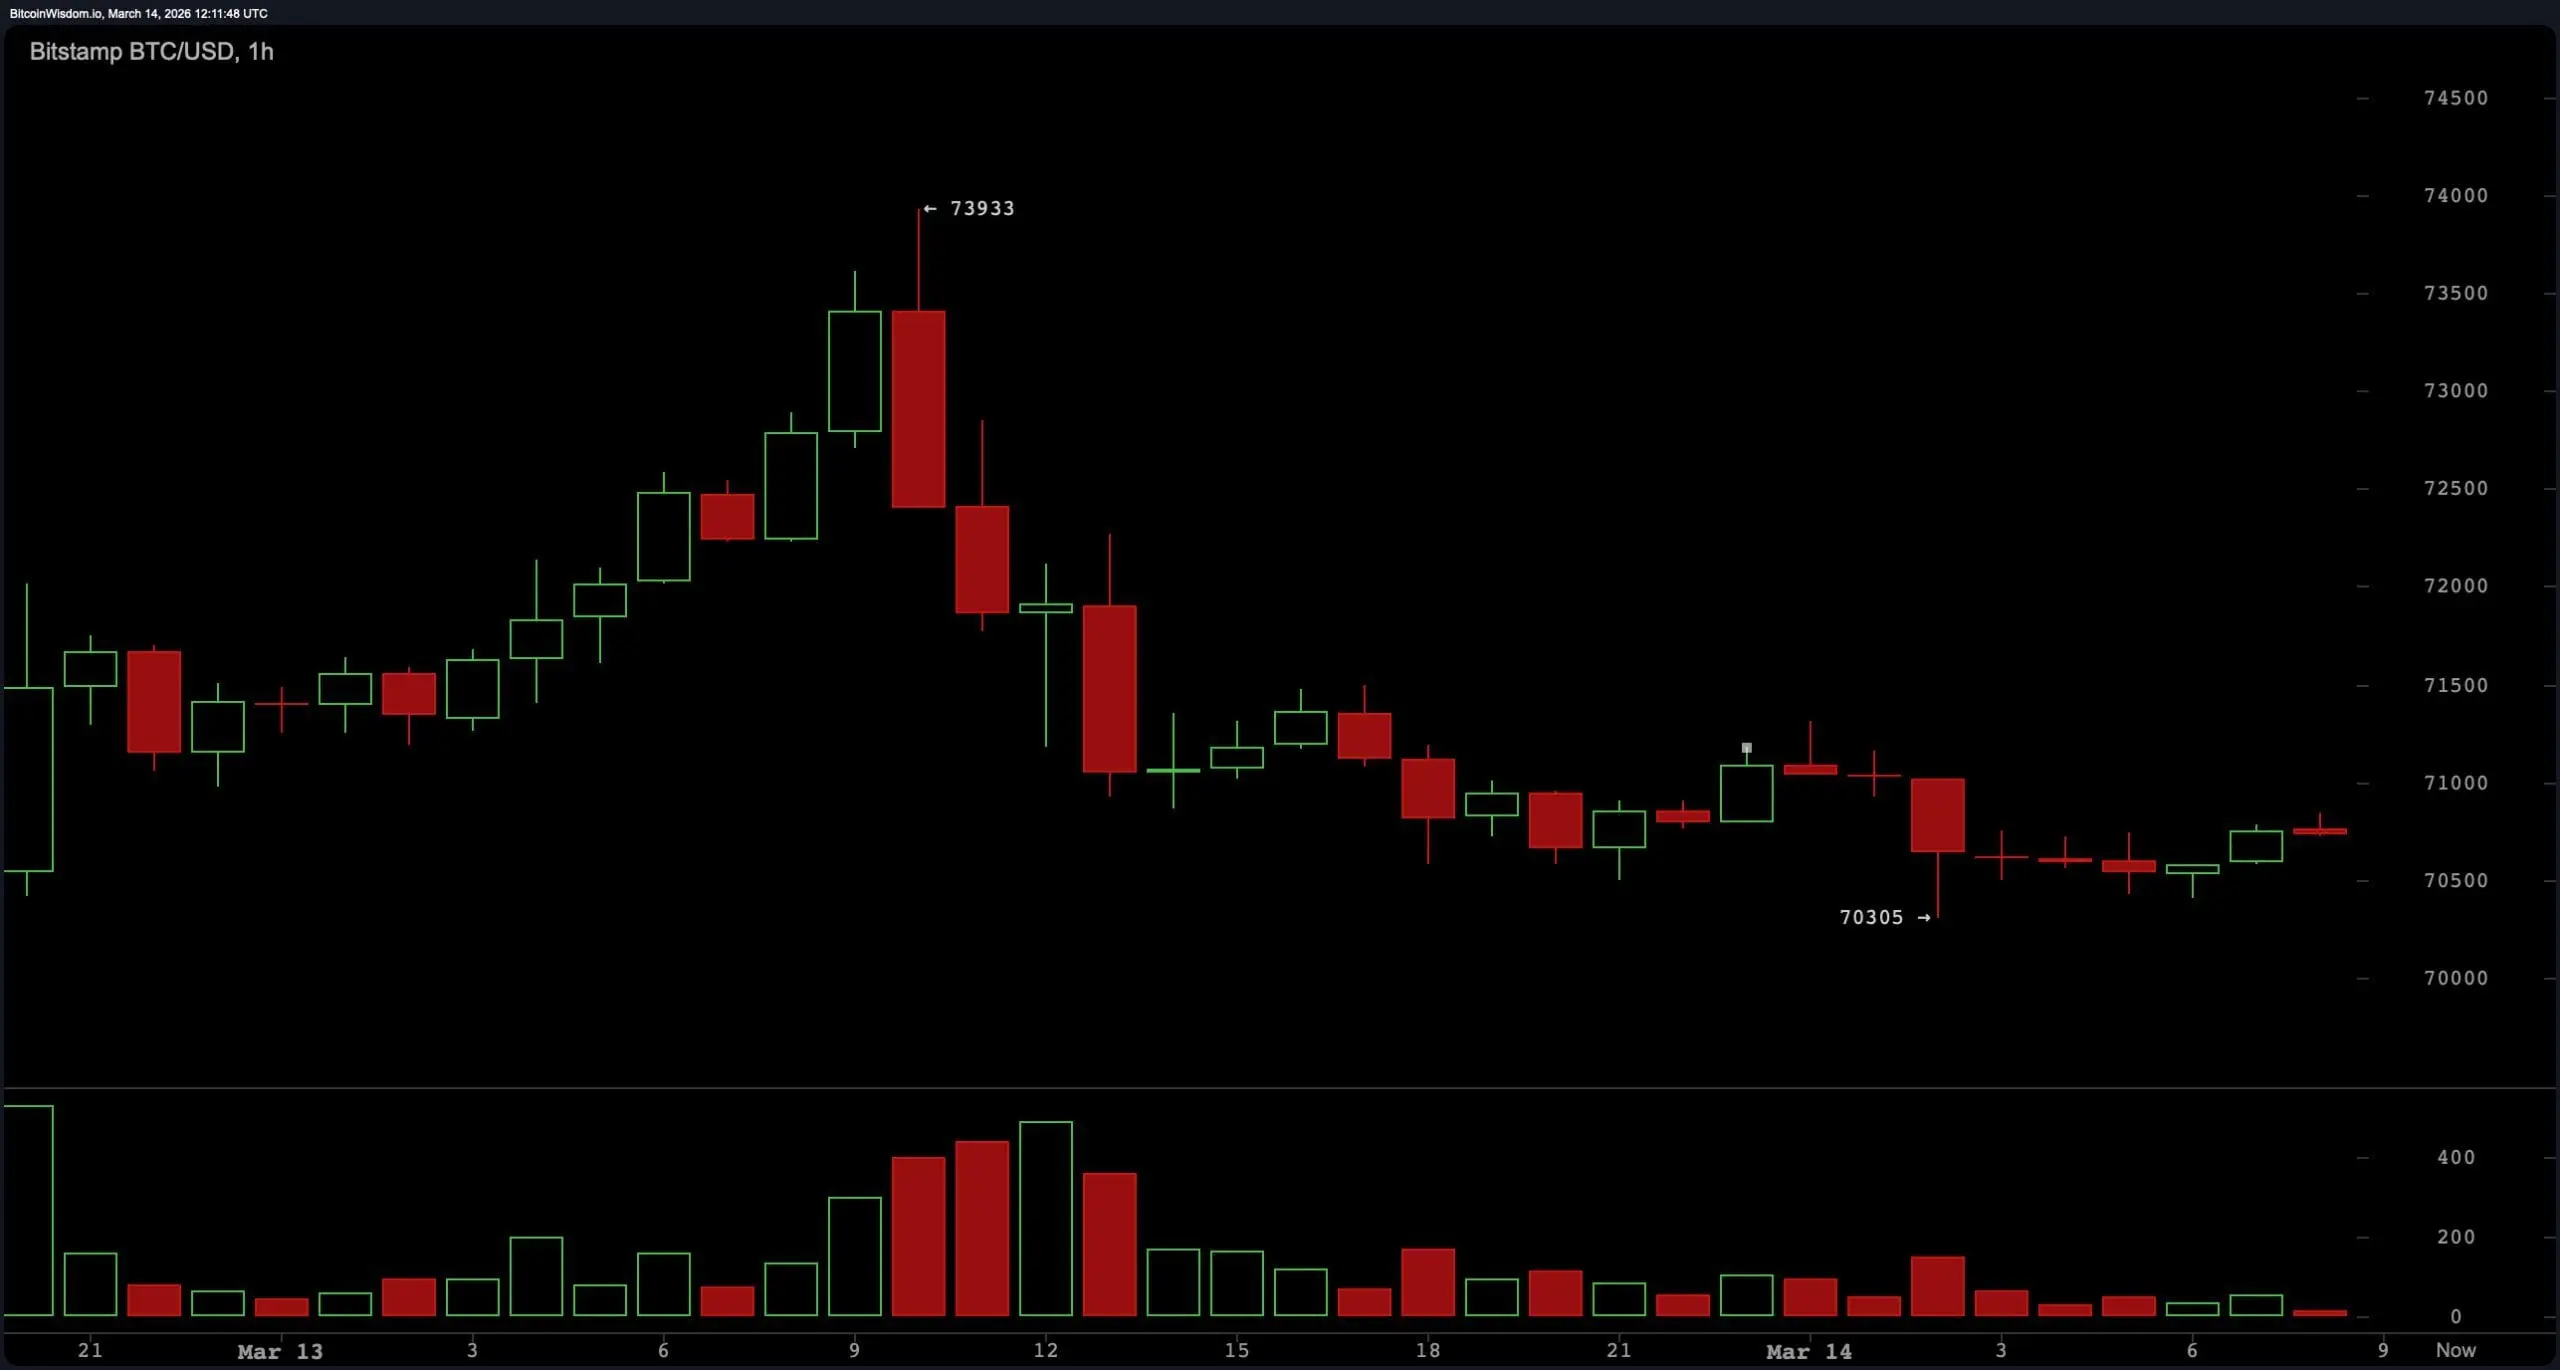 BTC/USD 1-hour chart via Bitstamp on March 14, 2026.
Oscillator readings reflect a neutral technical environment. The relative strength index ( RSI) is positioned at 53, indicating balanced momentum conditions. Stochastic reads 68, while the commodity channel index (CCI) is measured at 89, both also categorized as neutral signals.
BTC/USD 1-hour chart via Bitstamp on March 14, 2026.
Oscillator readings reflect a neutral technical environment. The relative strength index ( RSI) is positioned at 53, indicating balanced momentum conditions. Stochastic reads 68, while the commodity channel index (CCI) is measured at 89, both also categorized as neutral signals.
The average directional index (ADX) stands at 25, showing limited trend strength across the market. The Awesome oscillator records 2,432 and remains neutral. Momentum shows −1,891, signaling short-term downward pressure, while the moving average convergence divergence ( MACD) level registers −186 and signals upward momentum in the indicator summary.
Moving averages (MAs) present a split structure between short-term support and longer-term resistance levels. The exponential moving average (EMA) 10 sits at $69,648 and the simple moving average (SMA) 10 at $69,310, both signaling upward momentum relative to the current price. The EMA 20 at $69,305 and SMA 20 at $68,287 also remain supportive of the current range, along with the EMA 30 at $70,053 and SMA 30 at $68,215.
Longer-term averages reflect downward pressure, with the EMA 50 at $72,764 and the SMA 50 at $71,703 positioned above the price. Higher-period averages remain significantly elevated, including the EMA 100 at $79,665, SMA 100 at $80,935, EMA 200 at $87,978, and SMA 200 at $94,125. This distribution results in an overall neutral technical summary as short-term averages support current levels while longer-term averages remain above the market.
Bull Verdict:
If bitcoin maintains support above $69,500 and breaks decisively above the $71,200 resistance level, the current compression pattern could resolve to the upside. A sustained move through this level would clear short-term resistance and open the path toward $72,800 and a potential retest of the $73,800–$74,000 resistance zone seen on the daily chart. The sequence of higher lows on the four-hour timeframe and supportive short-term moving averages suggests underlying strength remains intact as long as price holds above the mid-range support area.
Bear Verdict:
A breakdown below the $69,500 support level would weaken the current consolidation structure and shift short-term momentum downward. Losing this level would place bitcoin below key range support and expose lower targets around $67,800, with a deeper support zone near $66,000 visible on the daily timeframe. Longer-term moving averages remaining above current price levels continue to signal overhead resistance, meaning sustained weakness below support could accelerate downside pressure if bearish momentum increases.
FAQ 🧭
- What is the bitcoin price on March 14, 2026?
Bitcoin is trading around $70,795, consolidating near the $70,000 level after rejecting resistance near $74,000.
- What are the key bitcoin resistance levels right now?
The main resistance levels for bitcoin are $71,200 in the short term and the major resistance zone between $73,800 and $74,000.
- What are the key bitcoin support levels to watch?
Key bitcoin support sits near $70,300 intraday, with stronger structural support at $69,500 and major support near $66,000.
- Is bitcoin trending up or down right now?
Bitcoin’s current technical trend is neutral as indicators and moving averages show consolidation between roughly $69,500 and $72,000.
Artículos relacionados
Un CEX registró un volumen de operaciones de $1,443 millones en las últimas 24 horas, con XRP, BTC y ETH ocupando los tres primeros lugares.
Según Gate News, el volumen de transacciones de cierto CEX el 18 de marzo fue de $1,443 millones, con una caída del 42.67%. Los cinco tokens principales fueron XRP, BTC, ETH, POLYX y BTT, con volúmenes de transacciones que representaron el 12.90%, 7.95%, 6.91%, 6.10% y 4.90% respectivamente.
GateNewsHace14m
Decisión de tasas de interés de la Reserva Federal en marzo de 2026 revelada, la postura de Powell influirá en la tendencia de Bitcoin y el mercado
La Reserva Federal mantendrá las tasas de interés en 3.5%-3.75% sin cambios el 18 de marzo, con el mercado atento a las declaraciones de Powell sobre la inflación y la política futura. El aumento del PCE subyacente y la presión de los precios del petróleo limitan el espacio para recortes de tasas, con una probabilidad estimada del 30% de reducción de tasas este año. Los factores políticos impactan el mandato de Powell, generando una reacción clara del mercado, afectando los precios de los activos de riesgo y las criptomonedas.
GateNewsHace16m
Las ballenas gigantes compran masivamente 2,000 millones de dólares en bitcoin, el mercado se enfoca en si el discurso de Powell puede impulsar que el precio de BTC rompa los 75,000 dólares
El precio de Bitcoin cayó a 74.000 dólares, y el mercado está atento a las declaraciones del presidente de la Reserva Federal, Powell. Las compras continuas de ballenas y los flujos de fondos hacia los ETFs indican una demanda a largo plazo, pero a corto plazo hay que estar alerta a la presión de venta. El ánimo del mercado se ha recuperado, pero la volatilidad podría aumentar.
GateNewsHace18m
Flujo de retorno de inversión institucional, Bitcoin ETF establece récord de entradas netas continuas más largas en cinco meses
El 18 de marzo, los ETF de Bitcoin estadounidenses experimentaron entradas continuas de fondos, estableciendo el récord más largo en cinco meses, con entradas netas de @0@1.994 millones de dólares, mientras que la confianza de los inversores institucionales en Bitcoin regresa. El ETF de Ethereum al contado también registró entradas netas consecutivas. Los reguladores estadounidenses publicaron documentos de orientación para mejorar la transparencia del mercado, promover el desarrollo de ETF de criptomonedas e impulsar la actividad general del mercado.
GateNewsHace21m
Analista on-chain: El sobrecalentamiento del mercado de Bitcoin se ha eliminado, pero la presión de venta aún no se alivia
El 18 de marzo, el analista de datos en cadena Axel publicó un informe señalando que el mercado de bitcoin se ha librado del sobrecalentamiento, pero la presión de los vendedores persiste sin señales de reversión. El indicador MVRV Z-Score ha caído a 0.674, indicando que la burbuja se ha disipado; mientras que el indicador aSOPR se mantiene continuamente por debajo de 1.0 mostrando que el mercado aún está en estado de venta con pérdidas, con el rebote enfrentando riesgo de presión de venta.
GateNewsHace21m

