Terra (LUNA), MemeCore (M), and XDC Network (XDC) stand out as the top performers in the past 24 hours. LUNA leads with an impressive breakout of 40%, while MemeCore and XDC continue their positive momentum on Thursday, following gains of 6% and 3% respectively from the previous session. However, technically, all three altcoins are approaching key resistance zones – a factor that could temporarily hinder the current rebound.
Terra’s Uptrend Reaches Critical Resistance Zone
At the time of writing on Thursday, Terra is trading around $0.2002, experiencing nearly 100% growth in just one week. This strong breakout aims to close a clear candle above the July high at $0.1990 — a signal that could open up opportunities to conquer the important resistance area at $0.2490 (May’s peak).
Terra’s remarkable recovery, along with Luna Classic, is likely driven by the testimony of Do Kwon on Thursday, combined with a new network upgrade aimed at improving security, optimizing functions, and increasing stability across the Terra ecosystem.
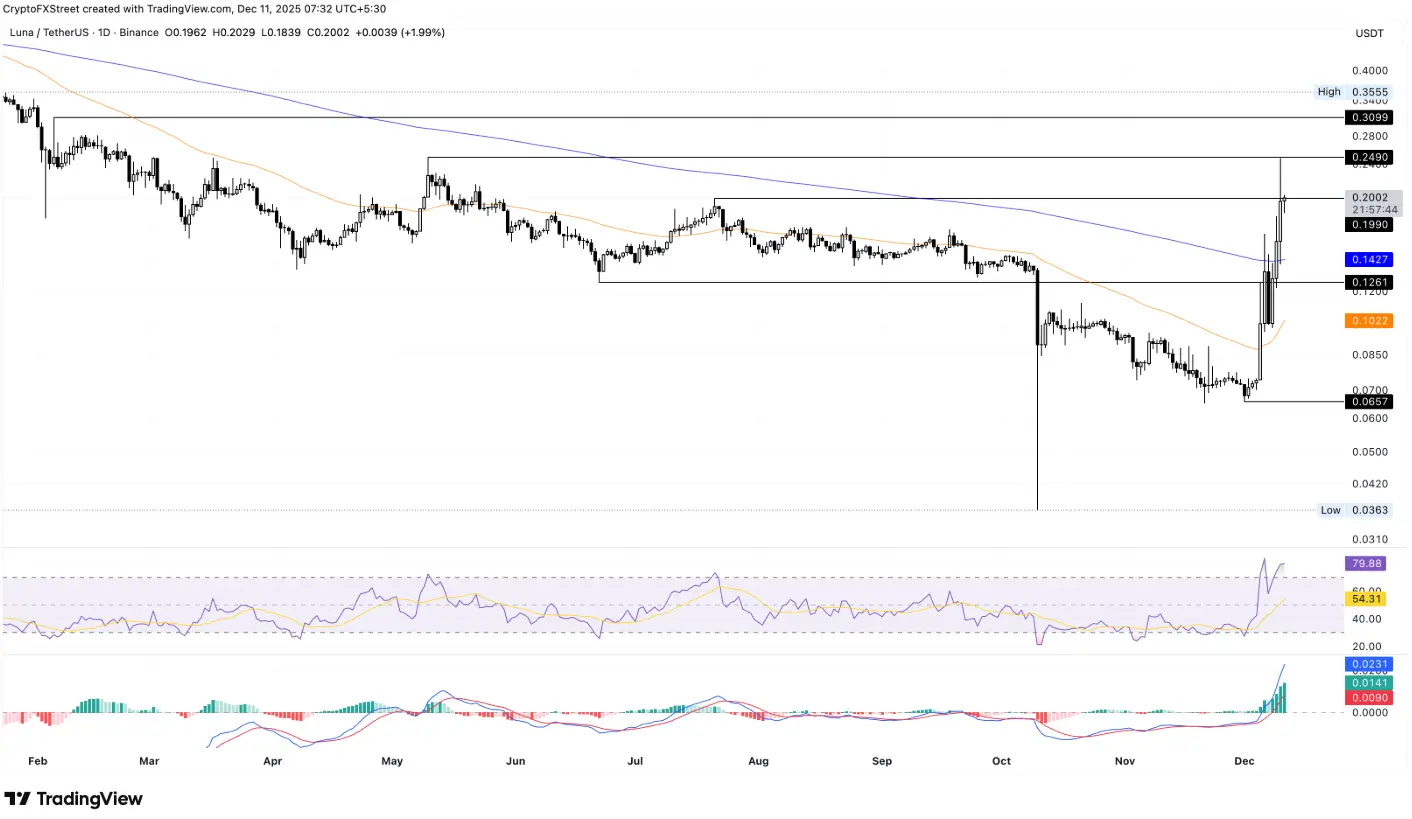 Daily LUNA/USDT chart | Source: TradingViewOn the daily chart, the RSI indicator reaches 79, indicating an overbought market, which suggests that current buying momentum may lack sustainability. However, the MACD remains bullish with a widening green histogram, reflecting ongoing upward momentum.
Conversely, if Terra fails to hold above $0.2000, the price could revisit the 200-day EMA at $0.1427.
MemeCore aims for double bottom breakout
MemeCore continues to stay green in Thursday’s session, marking a third consecutive day of recovery. This week alone, the M token has increased by nearly 16%, after a 6% jump on Wednesday.
The steady recovery suggests the formation of a double bottom pattern (double bottom) around the support zone of $1.25, with the neckline (neckline) at the November 29 peak of $1.52. If M closes above this level, the bullish trend could extend to the 50-day EMA at $1.77, and potentially toward the Pivot R1 at $2.56.
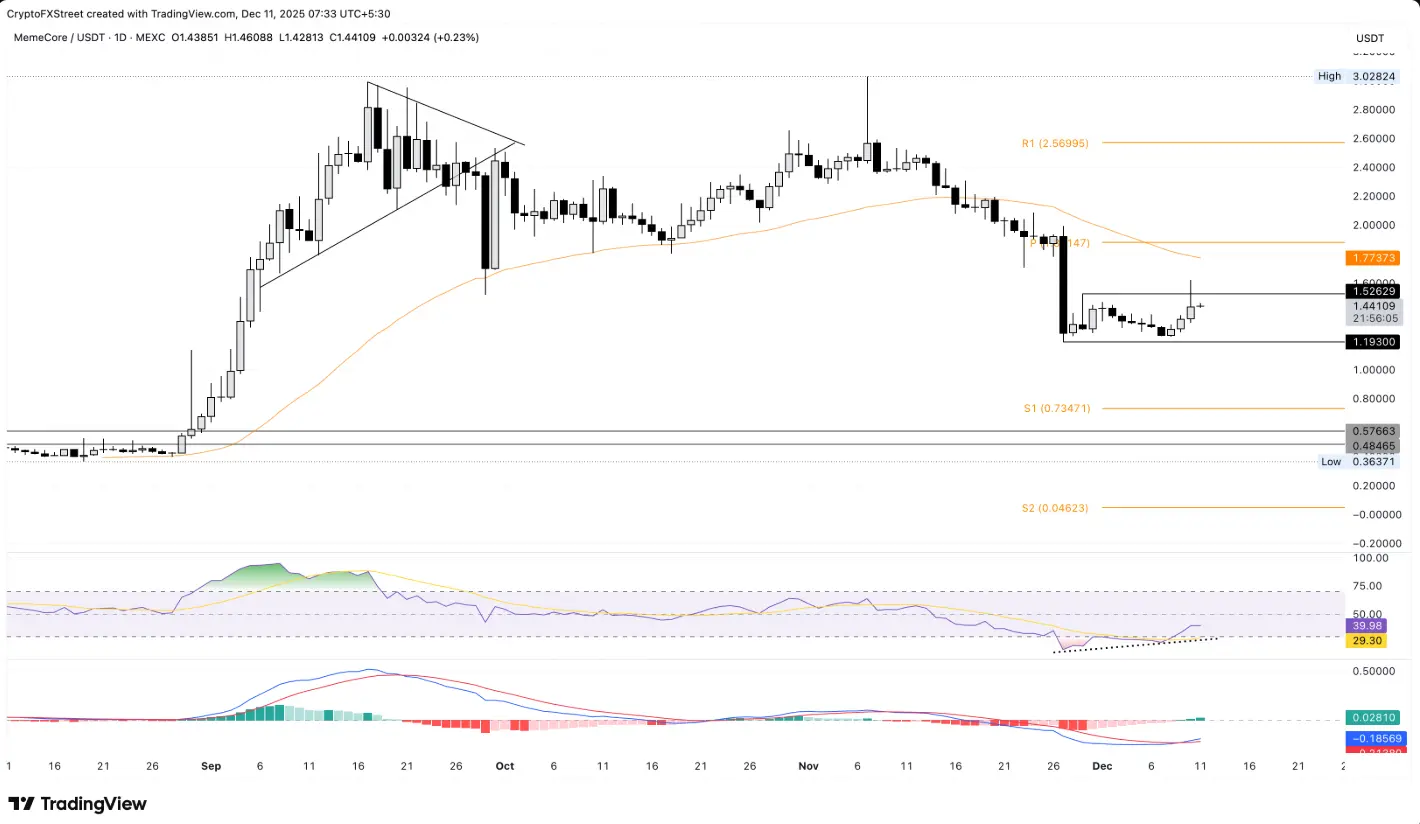 Daily M/USDT chart | Source: TradingView RSI is currently at 39 and rising from oversold territory, indicating a bullish divergence and reinforcing the reversal signal from the double bottom pattern — thereby increasing the likelihood of a new upward trend.
Additionally, the MACD supports the bullish outlook, as it crossed above the signal line on Tuesday, expanding buy signals for MemeCore and indicating strengthening bullish momentum.
XDC Network Faces Challenges at Key Psychological Level
XDC Network experienced a nearly 1% decline at the time of writing on Thursday, following a 3% rebound the previous day. The correction kept XDC below the psychological level of $0.05000 and failed to break above the long-term resistance line connecting the peaks on July 29 and October 6.
To resume its upward trend, XDC needs a clear breakout above $0.05000 before testing the next resistance zone at $0.05200. However, two major hurdles remain ahead: the 50-day EMA at $0.05502 and Pivot R1 at $0.06141.
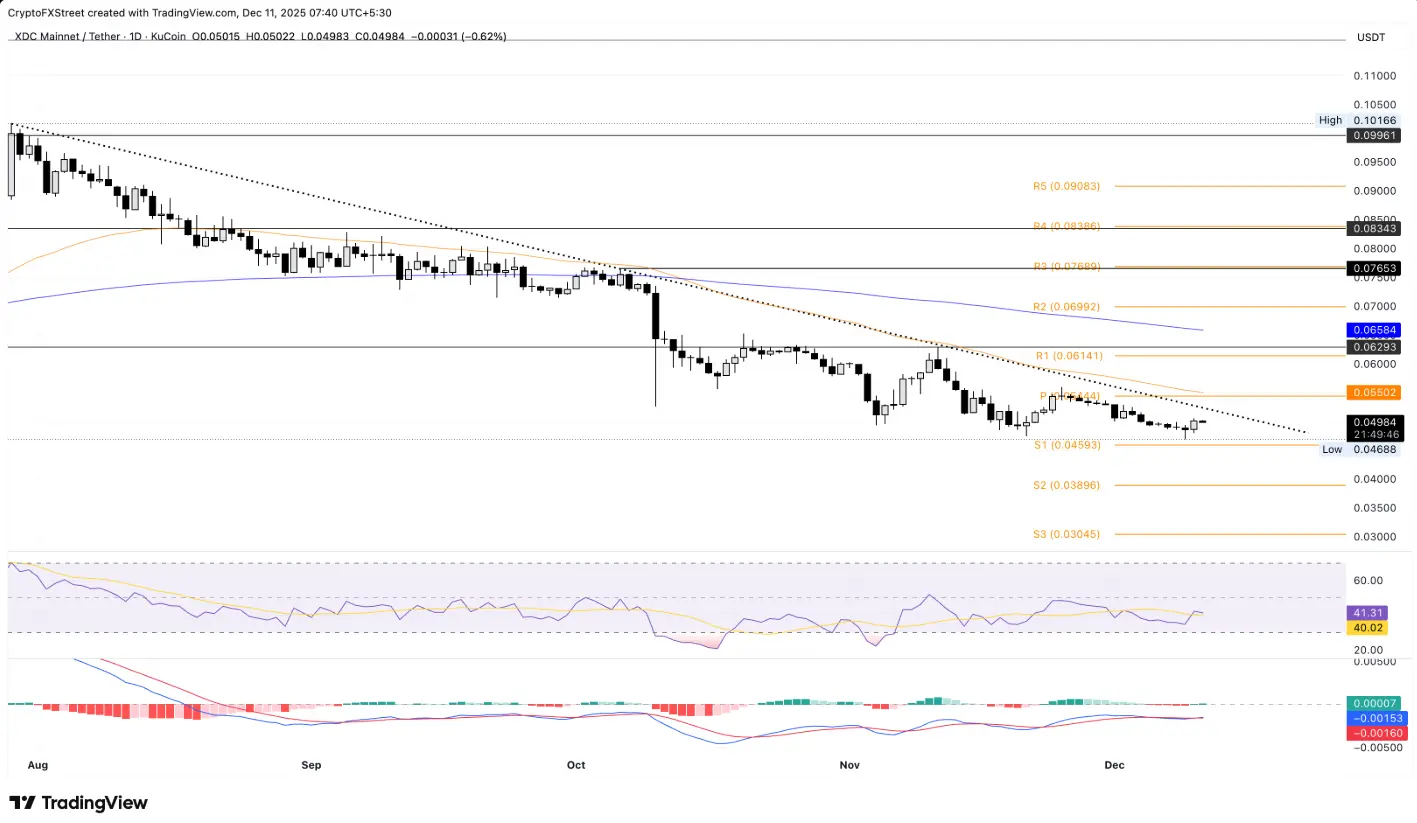 Daily XDC/USDT chart | Source: TradingViewFrom a technical perspective, the RSI at 41 is gradually moving toward oversold territory, reflecting persistent downward pressure. Conversely, the MACD indicates a positive signal with a bullish crossover — suggesting a potential recovery.
In a negative scenario, if XDC loses support at Pivot S1 (0.04593 USD), the price could continue to drop toward Pivot S2 at $0.03896.
Disclaimer: The information on this page may come from third parties and does not represent the views or opinions of Gate. The content displayed on this page is for reference only and does not constitute any financial, investment, or legal advice. Gate does not guarantee the accuracy or completeness of the information and shall not be liable for any losses arising from the use of this information. Virtual asset investments carry high risks and are subject to significant price volatility. You may lose all of your invested principal. Please fully understand the relevant risks and make prudent decisions based on your own financial situation and risk tolerance. For details, please refer to
Disclaimer.
Related Articles
TAO and NEAR Top AI Tokens to Watch, Target 57% Surge After Breaking Long-Term Descending Triang...
The cryptocurrency market is showing some strength in the second week of March 2026, with some assets such as Bittensor (TAO), NEAR Protocol (NEAR), and several others recovering from their deep corrections. Today, highly-followed crypto market analyst Michaël van de Poppe put forward a fresh
BlockChainReporter49m ago
XRP Slides to $1.42 After Losing $1.80–$2 Neckline as $1.39 Support Faces Immediate Test
XRP dropped to less than the $1.80-2 neckline and a key support area became an overhead and the overall trend was altered.
The current short-term trading corridor is between the support and resistance of the asset which is between $1.39 and $1.47 respectively.
A price above $1.39 will
CryptoNewsLand1h ago
Polkadot Holds $1.46 Support as Descending Channel Caps Upside Near $1.53
The heaviest resistance is at the 4-hour chart where DOT trades within a downward channel and resistance levels are formed near the levels of $1.50-$1.53.
The nearest support is at $1.46 and a more profound zone of demand is at the range of $1.38 to $1.40.
Even with a 1.5 price drop, DOT
CryptoNewsLand1h ago
WHITE Holds Firm At $0.00008064 As Its Consolidative Movement Suggests Upcoming 60% Spike Amid Wh...
The WhiteRock (WHITE) coin is attracting market attention with its price momentum, according to a revelation disclosed today by market analyst AltsDaddy. As pointed out by the analyst, WHITE’s price reclaimed the $0.03963149 level while its trading volume surpassed the $3,406,503 mark, signaling
BlockChainReporter2h ago
PEPE Stalls at $0.053354 While Oscillators Drift Below 40 Inside Tight Trading Band
PEPE fell to 2.4 per cent to trade at a price of $0.053354 but above the level of support in the vicinity of $0.053325.
Momentum indicators are tight and oscillator values are close to 39.47 and 36.73 and MACD is close to zero line.
The intra-day range of $0.053325 to $0.053473 is still r
CryptoNewsLand2h ago
No, Bitcoin Is Not Forming 'Cup and Handle' Pattern to $500,000, Says Peter Brandt - U.Today
Peter Brandt, a veteran market analyst, strongly criticizes the prediction of Bitcoin reaching $500,000, arguing it misinterprets the "cup and handle" pattern. He emphasizes the necessity of proper technical analysis and warns against unwarranted optimism based on flawed interpretations.
UToday2h ago