Trade
Trading Type
Spot
Trade crypto freely
Pre-Market
Trade new tokens before they are officially listed
Margin
Magnify your profit with leverage
Convert & Block Trading
0 Fees
Trade any size with no fees and no slippage
Alpha
Points
Get promising tokens in streamlined on-chain trading
Leveraged Tokens
Get exposure to leveraged positions simply
Futures
Futures
Hundreds of contracts settled in USDT or BTC
Options
HOT
Trade European-style vanilla options
Unified Account
Maximize your capital efficiency
Demo Trading
Futures Kickoff
Get prepared for your futures trading
Futures Events
Participate in events to win generous rewards
Demo Trading
Use virtual funds to experience risk-free trading
Earn
Launch
CandyDrop
Collect candies to earn airdrops
Launchpool
Quick staking, earn potential new tokens
HODLer Airdrop
Hold GT and get massive airdrops for free
Launchpad
Be early to the next big token project
Alpha Points
NEW
Trade on-chain assets and enjoy airdrop rewards!
Futures Points
NEW
Earn futures points and claim airdrop rewards
Investment
Simple Earn
Earn interests with idle tokens
Auto-Invest
Auto-invest on a regular basis
Dual Investment
Buy low and sell high to take profits from price fluctuations
Soft Staking
Earn rewards with flexible staking
Crypto Loan
0 Fees
Pledge one crypto to borrow another
Lending Center
One-stop lending hub
VIP Wealth Hub
Customized wealth management empowers your assets growth
Private Wealth Management
Customized asset management to grow your digital assets
Quant Fund
Top asset management team helps you profit without hassle
Staking
Stake cryptos to earn in PoS products
Smart Leverage
NEW
No forced liquidation before maturity, worry-free leveraged gains
GUSD Minting
Use USDT/USDC to mint GUSD for treasury-level yields
More
Promotions
Activity Center
Join activities and win big cash prizes and exclusive merch
Referral
20 USDT
Earn 40% commission or up to 500 USDT rewards
Announcements
Announcements of new listings, activities, upgrades, etc
Gate Blog
Crypto industry articles
VIP Services
Huge fee discounts
Proof of Reserves
Gate promises 100% proof of reserves
Trending Topics
View More18.73K Popularity
46.61K Popularity
57.57K Popularity
90.06K Popularity
3.87K Popularity
I Hope You Bought Ethena, Says Crypto Veteran – Here’s His ENA Price Outlook
What the ENA Chart Is Telling Us Looking at the structure Faibik shared, ENA had been trending lower for a while, printing lower highs and lower lows inside the wedge. That showed consistent selling, but also fading momentum. Each push down became weaker than the last. Over the past several sessions, that dynamic started to change. The ENA price stopped breaking down and began moving sideways near the lower boundary of the wedge.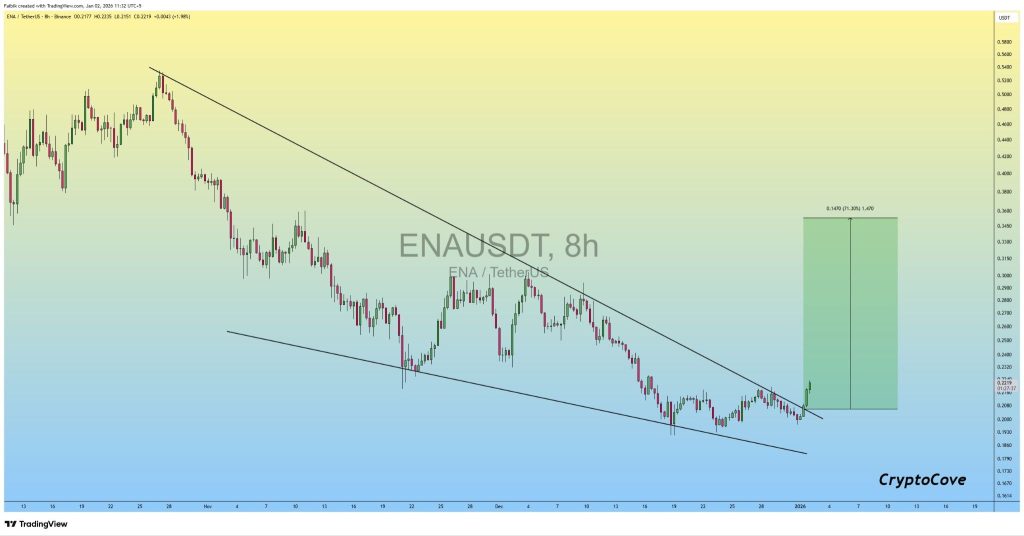
Source: X/@CryptoFaibik
Instead of rolling over, ENA held its base and eventually pushed through the upper trendline. That kind of move often signals that buyers are finally absorbing supply. The breakout itself was clean. The price didn’t slowly grind above resistance, it pushed through and stayed there. That usually marks the shift from a corrective phase into the early stages of recovery. Read Also: Cardano Price Prediction: ADA Is Flashing a Familiar Setup Why This Breakout Matters for ENA Falling wedges tend to resolve higher, especially when they appear after extended declines. In ENA’s case, the pattern developed over several weeks, which gives the breakout more weight. The measured move on the chart indicates a potential upside of around 70%, with the next major area of interest sitting near the $0.34–$0.36 zone. That doesn’t mean ENA moves straight there, but it helps frame what this structure could open up if momentum continues to build. Just as important, the breakout invalidates the immediate bearish setup. As long as the price stays above the former wedge resistance, the market is no longer operating in a sell-first environment. What to Watch Next for ENA From here, the most important thing is whether ENA can hold above the breakout zone. If the price stays above former resistance and possibly retests it successfully, the bullish structure remains intact. If the ENA price slips back inside the wedge, the setup weakens and indicates the market needs more time. For now though, the chart supports the idea that this falling wedge breakout is real. ENA may still be early in its move, but structurally, this is the clearest shift it has shown in weeks.