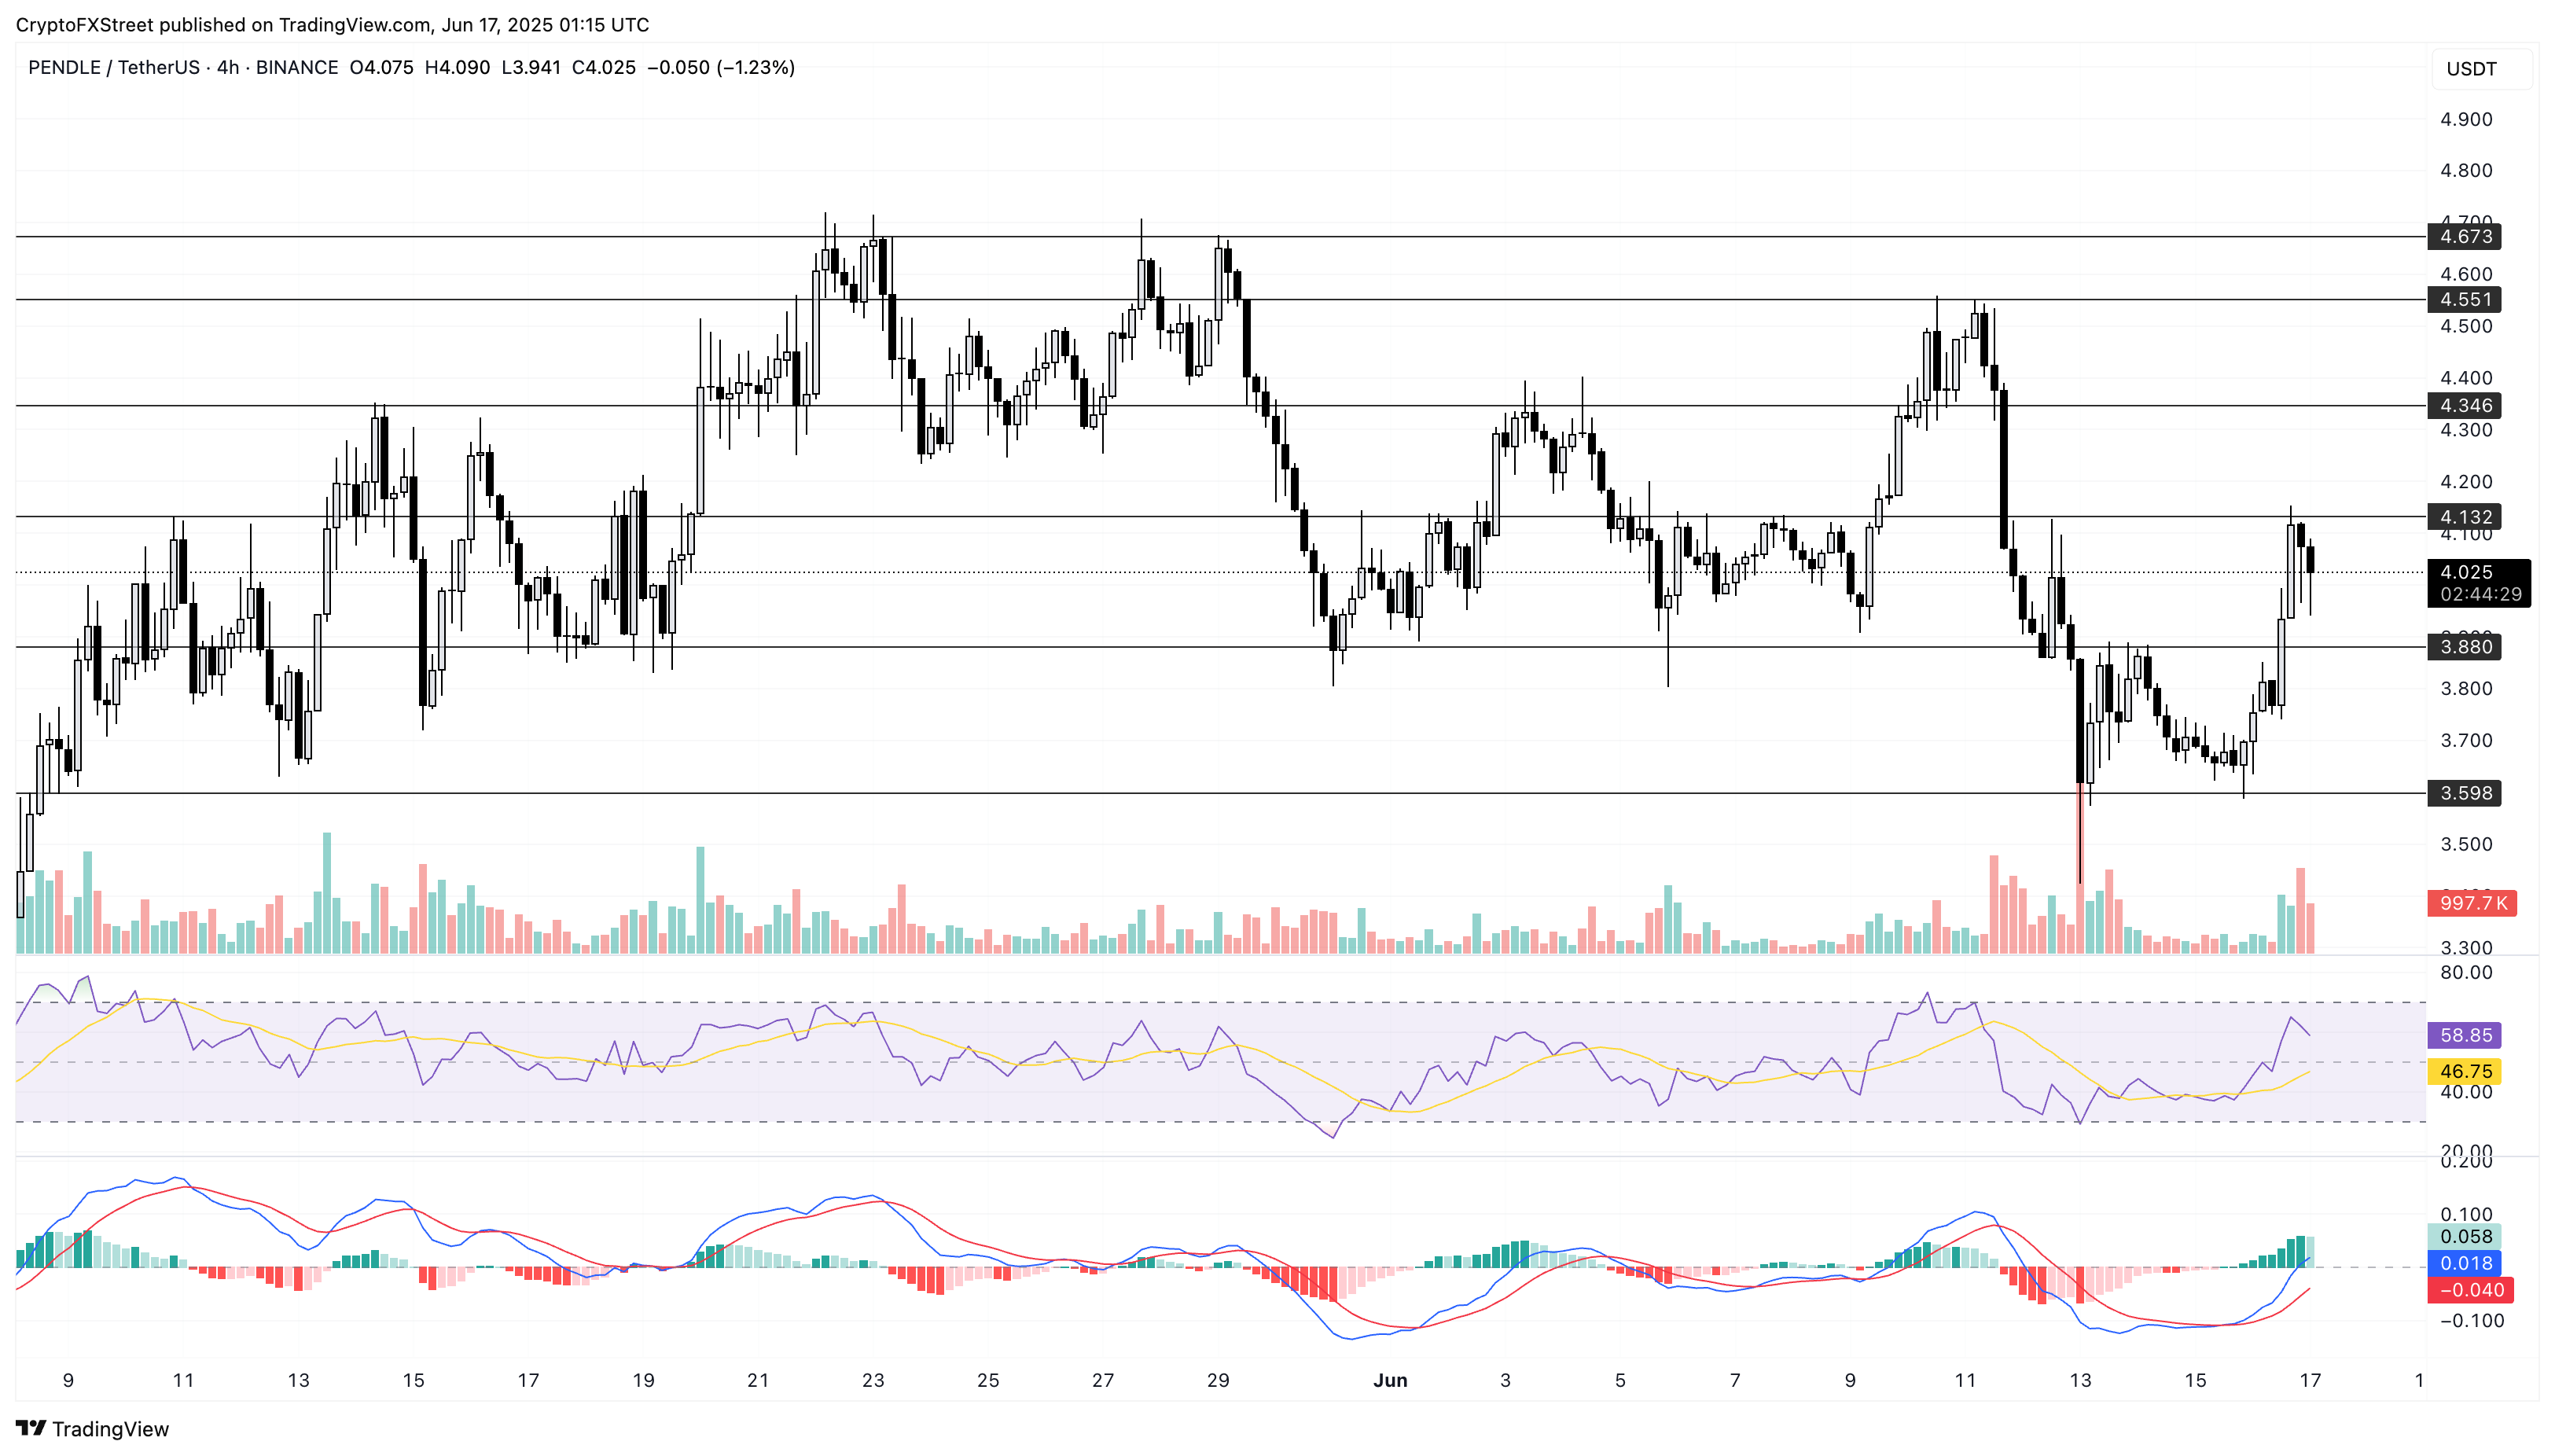
Gate News bot message, FXStreet analyst Vishal Dixit stated that the price of Pendle (PENDLE) rose 10% on Monday, marking the first bullish daily chart in six days. Starting from the support level of $3.598, the price of PENDLE reached the key resistance level of $4.132 indicated on the 4-hour chart.
Due to oversupply above, PENDLE’s stock price has experienced a brief respite, with two consecutive bearish candles, each with long tails, indicating strong demand absorbing the supply.
The closing price above $4.132 may push PENDLE up to the level of $4.346, with the last test of this level as a support level occurring on June 10.
In the 4-hour chart, the RSI indicator is approaching the overbought boundary, and buying pressure is increasing. However, the risk of a pullback is rising in an overbought environment, and investors must remain cautious.
The MACD indicator has entered the positive territory, and its signal line is following an upward trend, indicating that the bullish momentum is strengthening.
If the PENDLE price breaks below $3880, it may retest the support level of $3598.
(Source: FXStreet)
Disclaimer: The information on this page may come from third parties and does not represent the views or opinions of Gate. The content displayed on this page is for reference only and does not constitute any financial, investment, or legal advice. Gate does not guarantee the accuracy or completeness of the information and shall not be liable for any losses arising from the use of this information. Virtual asset investments carry high risks and are subject to significant price volatility. You may lose all of your invested principal. Please fully understand the relevant risks and make prudent decisions based on your own financial situation and risk tolerance. For details, please refer to
Disclaimer.
