Ethereum fell 10% after hitting a historic high of $4900, but the prediction market and on-chain data both show that long positions sentiment remains unshaken. Myriad’s prediction platform traders are still betting with over a 73% probability that ETH will break $5000 within four months. The technical indicators ADX at 39 and RSI at 58 both point to a healthy rise trend, but the historical seasonal pullback risk in September may become a short-term resistance.
- The crash has not changed the bullish consensus: The prediction market bets on a breakthrough of 5000 dollars.
Despite Ethereum’s 10% pullback from its historical high of $4900 this weekend, with the current price hovering around $4500, traders on the prediction market platform Myriad still maintain a strong bullish sentiment. Data shows that traders’ probability predictions for ETH to break $5000 within the next four months remain in the range of 73%-80%, which is a slight decrease from the 90% peak observed a few days ago, but still far exceeds pessimistic expectations. This indicates that short-term price fluctuations have not shaken the longs’ confidence in the long-term trend.
- Technical indicators are broadly bullish: ADX and RSI are sending positive signals.
Ethereum technical indicator shows typical bull market characteristics:
-
ADX (Average Directional Index) value 39: above the 25 strength boundary, indicating that the current rise trend is strong (above 40 indicates extremely strong momentum), although it has slightly retreated from yesterday’s 41, it still remains in the high range;
-
RSI (Relative Strength Index) value 58: It is in the healthy range of 30-70, which means it has escaped the risk of being oversold and has not entered the overbought area, indicating that the price still has room to rise without triggering algorithmic sell-offs.
-
EMA Moving Average Arrangement: The 50-day EMA is significantly higher than the 200-day EMA, forming a golden cross, establishing a long-term bullish pattern with sustained buying pressure across multiple time frames.
-
Key price levels and liquidation clusters: $4800 has become a recent resistance level.
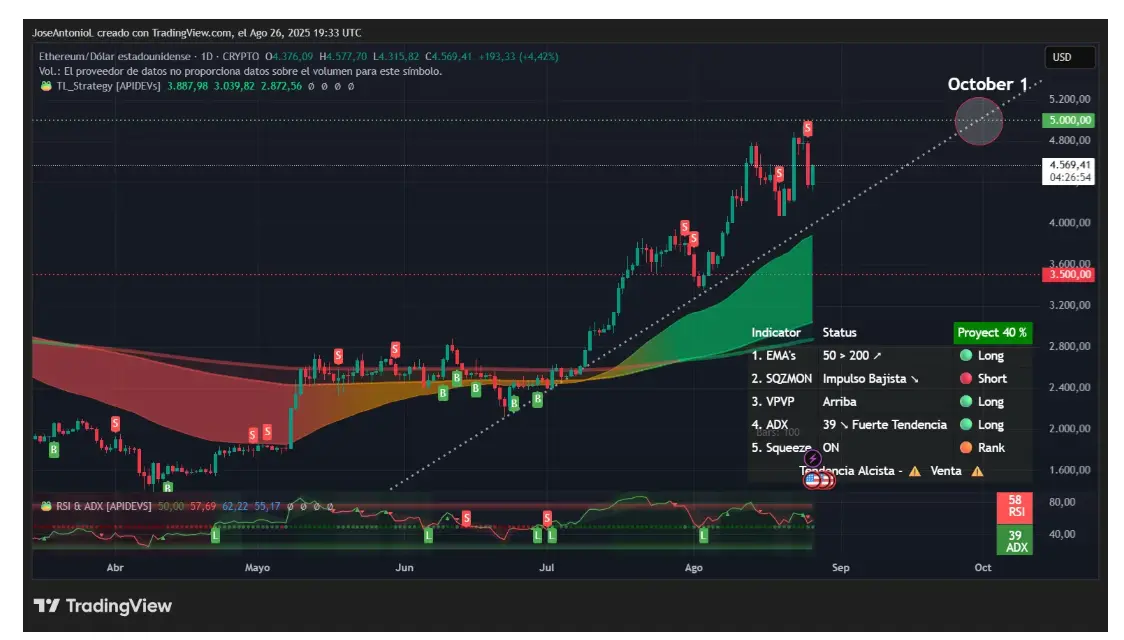
(Source: TradingView)
Based on price momentum and historical data, attention should be paid to the following key levels:
-
Immediate resistance: $4800 (pre-crash high);
-
Strong resistance: $5000-5200 (historical high + Fibonacci extension target);
-
Immediate support: $4000 (psychological level + near 50-day EMA);
-
Strong support: $3500 (long-term support level in this bull market). The squeeze momentum indicator shows a “starting” state, indicating that the market is transitioning from a consolidation phase to a trending phase, and caution is needed for short-term directional changes.
-
September Historical Pullback Curse: Seasonal Risks May Become the Biggest Challenge for Long Positions
Historical data reveals potential risks: Between 2015 and 2024, Bitcoin’s average return in September was -4.89%, known as “Red September.” During the same period, the U.S. stock market also showed weak performance in September over the past 75 years. If ETH can hold the support level of $4300-$4500, then in October (historical average increase of 22%), it is likely to hit the $5000 target; if it repeats the 14% decline seen in September 2019, the price may test the 50-day EMA support, but there is still momentum for a rebound afterwards.
[Conclusion]
Despite the approaching seasonal pullback pressure, the technicals and market sentiment for Ethereum still lean towards long positions. The healthy RSI value, EMA bullish alignment, and high probability bets in the prediction market all support the expectation of a $5000 target. Traders are advised to pay attention to the defense situation in the $4300-$4500 support zone; if September transitions smoothly, October may welcome a breakout market. Be cautious of short-term volatility risks caused by historical patterns and leverage liquidations.
Disclaimer: The information on this page may come from third parties and does not represent the views or opinions of Gate. The content displayed on this page is for reference only and does not constitute any financial, investment, or legal advice. Gate does not guarantee the accuracy or completeness of the information and shall not be liable for any losses arising from the use of this information. Virtual asset investments carry high risks and are subject to significant price volatility. You may lose all of your invested principal. Please fully understand the relevant risks and make prudent decisions based on your own financial situation and risk tolerance. For details, please refer to
Disclaimer.
