Solana (SOL) price has gained nearly 10% over the past week, followed by a slight correction, but the weekly price structure remains stable. What’s notable about this movement is not the growth rate itself but the forces behind the market’s movement.
The latest data shows a clear shift in the group of investors holding SOL, a factor that often explains price behavior better than technical charts alone. This shift reflects a more balanced market, with decreasing short-term trading activity and an increasing number of investors holding assets for the long term.
Holder Data: The “Strong Hands” Gradually Control SOL Price
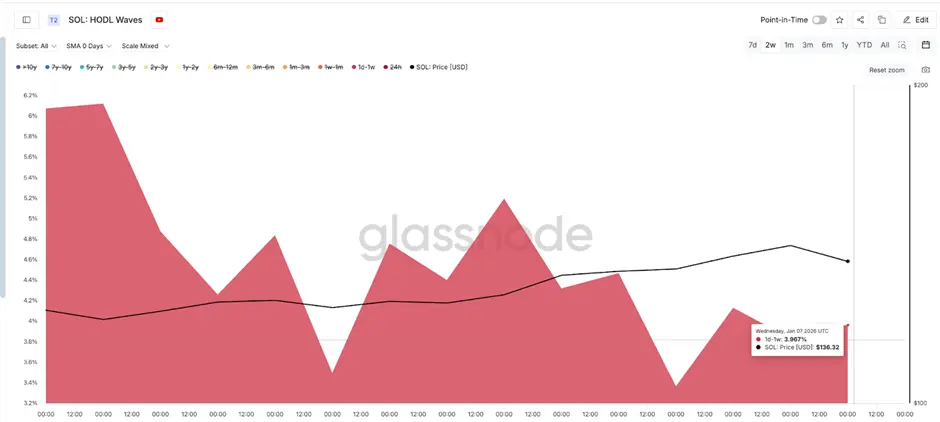
One of the most prominent signals comes from the SOL HODL wave data, which classifies wallets based on holding duration.
The short-term holder group—wallets holding SOL from one day to one week—is decreasing sharply. At the end of December, this group accounted for about 6% of the total supply, but now it has fallen below 4%.
The retreat of short-term holders often stabilizes the price, as they tend to sell quickly during minor market fluctuations.
 Short-term holders | Source: Glassnode Conversely, the number of wallets holding SOL for six to twelve months has increased significantly, from 13.9% of the supply on 12/24 to nearly 15% on 1/7.
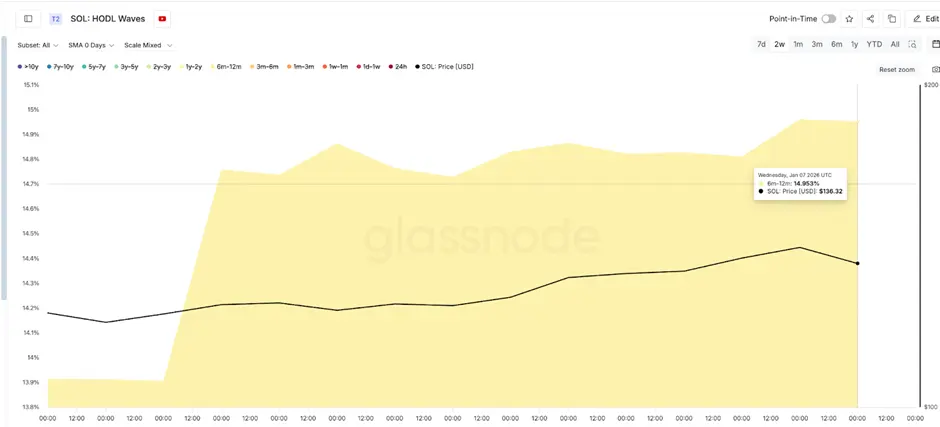 Medium- and long-term holders | Source: Glassnode These investors usually have a long-term outlook and are less affected by small fluctuations, helping to maintain stability during correction phases. The change in confidence among this group indicates that SOL’s current price is supported by strategic and confident investors rather than just short-term momentum.
Large Traders and Network Data Reinforce This Trend
The positions of highly leveraged traders also send important signals. The top 100 addresses in the futures market still hold short positions, meaning they are hedging against downside risk.
However, these traders are gradually adding long positions, a move often seen when they expect prices to rise but prefer to approach the market cautiously.
On the technical chart, SOL’s price has broken above the 50-day exponential moving average (EMA)—a more responsive indicator that emphasizes recent prices, helping to identify short-term trends more clearly than simple moving averages.
SOL previously lost this level in October and failed to hold it for several months. Maintaining above this level now indicates that short-term strength is gradually improving.
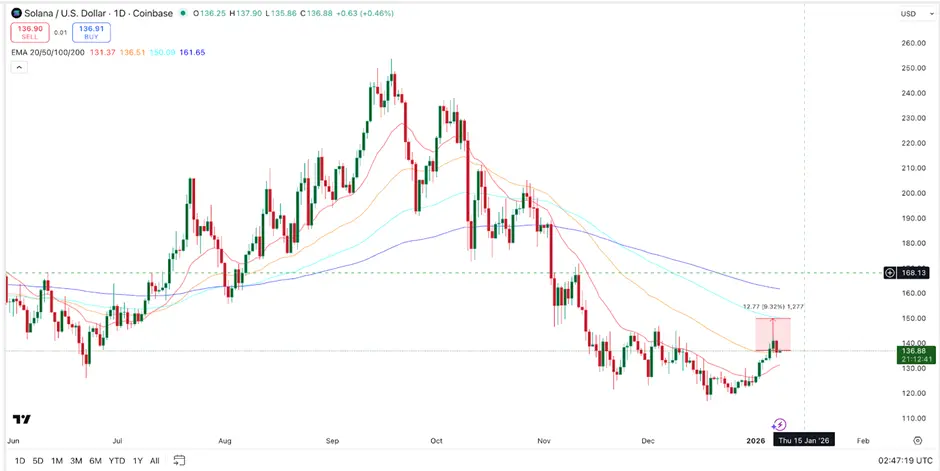 SOL Price Chart | Source: TradingView The next key level of interest for traders is around $149, coinciding with the 100-day EMA and previous resistance zones.
Many analysts see this as a decisive point for SOL’s price. If the price remains stable above $149, SOL could have the opportunity to move toward the $250–$253 range, representing an 84% increase from current levels.
Network activity on SOL also supports this outlook. The stablecoin supply on Solana has increased by over $900 million, indicating new capital flowing into the ecosystem. Additionally, trading volume on Pump.fun exceeded $2 billion in a single day, reflecting active user engagement even as short-term speculation activity declines.
Currently, SOL’s price is driven by a steadfast group of holders, cautious positions from large traders, and increasing on-chain activity. The price movement around the $149 level will be a key factor in determining whether the growth trend can be sustained.
Mr. Teacher
Disclaimer: The information on this page may come from third parties and does not represent the views or opinions of Gate. The content displayed on this page is for reference only and does not constitute any financial, investment, or legal advice. Gate does not guarantee the accuracy or completeness of the information and shall not be liable for any losses arising from the use of this information. Virtual asset investments carry high risks and are subject to significant price volatility. You may lose all of your invested principal. Please fully understand the relevant risks and make prudent decisions based on your own financial situation and risk tolerance. For details, please refer to
Disclaimer.
Related Articles
Last week SOL spot ETF saw net inflows of $21.1 million, with Bitwise BSOL recording weekly net inflows exceeding $20 million.
According to SoSoValue data, from March 16-20, SOL spot ETFs saw net inflows of $21.1 million, primarily from Bitwise ETF BSOL with weekly net inflows of $20.9863 million and historical cumulative net inflows reaching $803 million. Fidelity ETF FSOL experienced net outflows of $1.12 million. The total assets under management for SOL spot ETFs currently stands at $875 million.
GateNews2h ago
Forward Industries Funds $27.4M Share Buyback, Deepens Solana Treasury Focus
Forward Industries is initiating a $27.4 million share buyback funded by a $40 million loan backed by staked Solana, amidst declining stock and crypto prices. This strategy aims to enhance shareholder value and reduce costs while navigating a challenging market.
LiveBTCNews14h ago
Claude AI Predicts the Price of Solana and XRP If the Clarity Act Doesn’t Pass in 2026
As of March 2026, the CLARITY Act has been stuck for months. However, we’ve finally seen a breakthrough with the agreement in principle between the key senators on the debate surrounding stablecoins and yield.
The Senate Banking Committee is set to mark the bill in mid to late April. However,
CaptainAltcoin15h ago
Solana reaches the top for the first time in stablecoin trading volume
In February 2026, Solana surpassed Ethereum in stablecoin transaction volume, marking a significant shift in the market after Ethereum held dominance in 2024. The increase in Solana's usage reflects its growing role in actual transactions.
TapChiBitcoin03-22 02:32
