Bitcoin (BTC) is still facing strong selling pressure as the bears are determined to push the price below the $84,000 level. The sharp decline towards the $81,000 mark triggered a liquidation wave of up to $1.77 billion in just 24 hours, according to data from CoinGlass, indicating increasing volatility in the market.
In response to this development, many analysts have adopted a cautious, even pessimistic stance, suggesting that the downward trend of BTC may not end soon. Some forecasts predict Bitcoin could break through the critical bottom zone of $74,500 — a level set in April 2025, shortly after the US President Donald Trump announced the “Liberation Day” tax.
However, not all perspectives are bleak. Mr. Pav Hundal, Head of Analysis at Swyftx, believes that Bitcoin still has the potential to form a bottom within the next 40 days if historical scenarios repeat, as BTC bottoms tend to appear about 14 months later than the relative strength of gold.
So, do BTC and the top altcoins have a chance to initiate a short-term recovery? Let’s analyze the charts of the 10 largest cryptocurrencies to find the answer.
Technical Analysis of BTC
BTC sharply reversed from the 20-day Exponential Moving Average (EMA) at $89,165 on Thursday and fell below the support zone of $84,000.
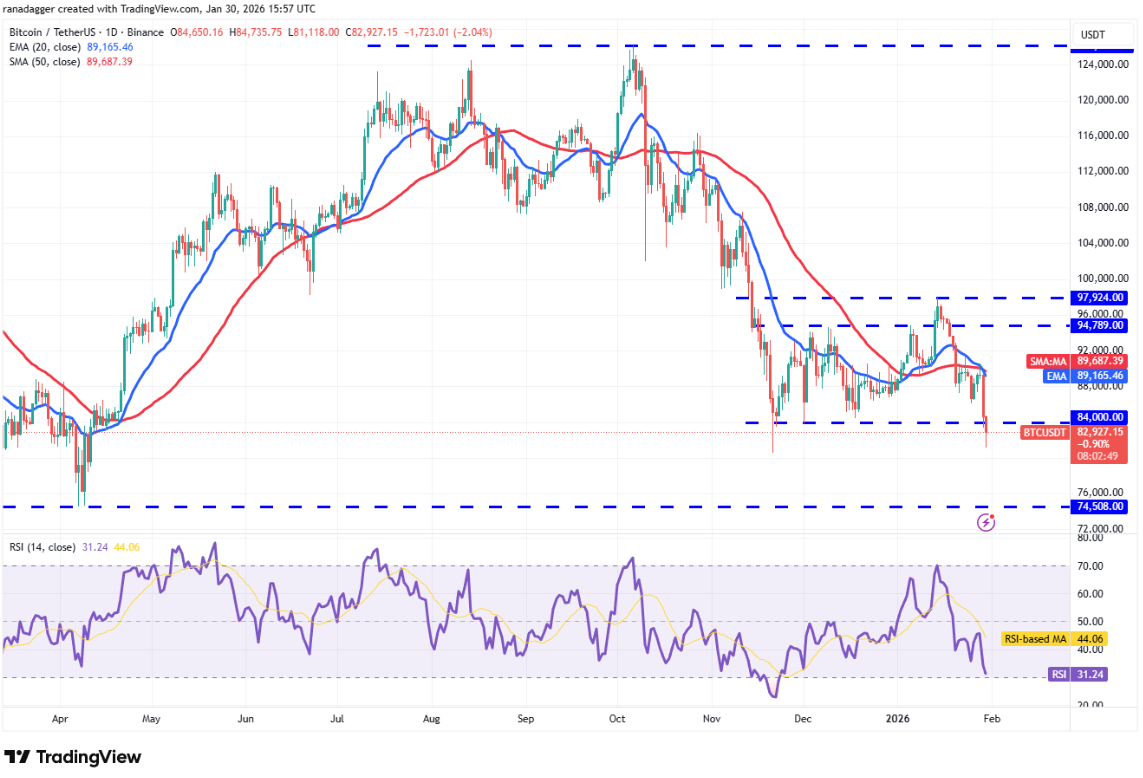 Daily BTC/USDT Chart | Source: TradingView The $80,600 level is an important short-term support to watch. If the bears push the price below $80,600, the BTC/USDT pair could extend its decline toward the key support zone of $74,508.
On the upside, the bulls are likely to defend the $80,600 mark aggressively and try to push the price above the moving averages. If successful, it will signal a rejection of the decline below $84,000. In that case, the price could rebound to the resistance zone between $94,789 and $97,924.
Technical Analysis of ETH
Ether (ETH) reversed from the moving averages on Thursday and dropped below the $2,787 mark, indicating selling pressure even during minor recoveries.
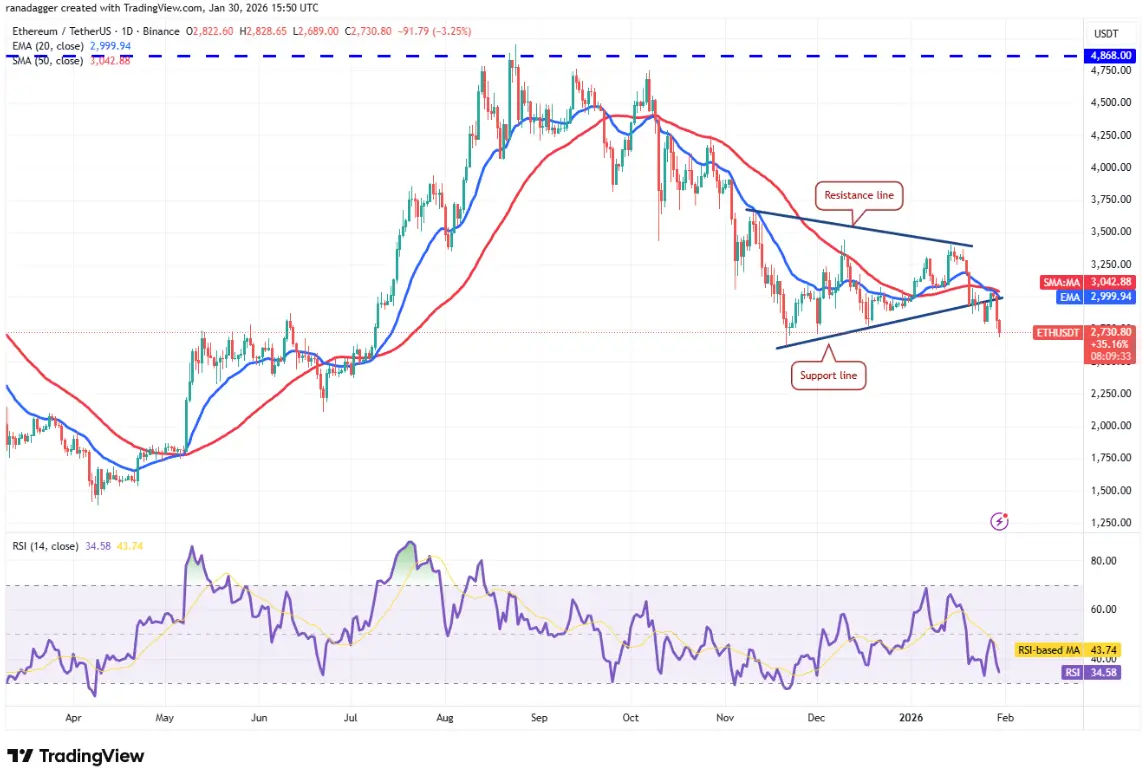 Daily ETH/USDT Chart | Source: TradingView The 20-day EMA is trending down at $2,999, and the RSI is in the negative zone, suggesting that the advantage still favors the bears. ETH’s price could decline to $2,623 — an area expected to attract buying interest. However, if the bears gain control, ETH/USDT may continue its downward trend to $2,111.
Time is running out for the bulls. They need to quickly push the price above the moving averages to signal strength. If they succeed, the pair could rise to the higher resistance levels.
Technical Analysis of BNB
The inability of the bulls to sustain BNB above the 20-day EMA at $890 on Thursday triggered selling, pulling the price back to the upward trendline.
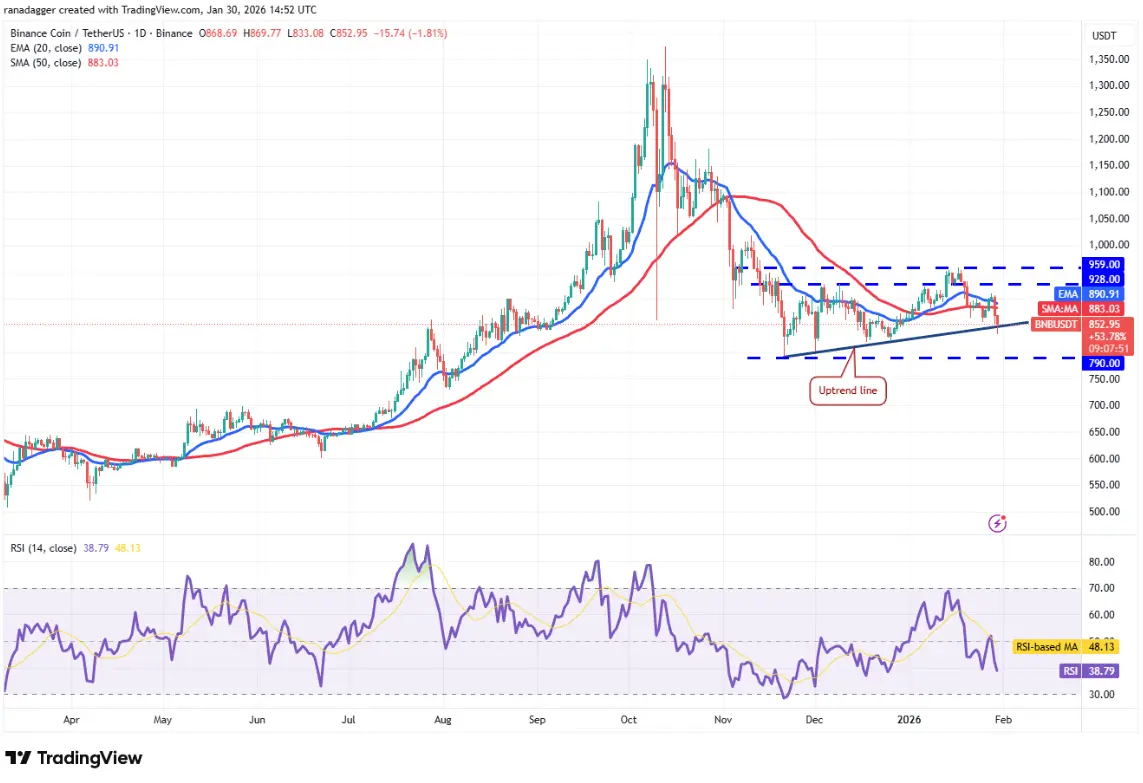 Daily BNB/USDT Chart | Source: TradingView The bulls are expected to defend this trendline strongly, because a close below it could lead BNB/USDT to drop to $790. Breaking and closing below $790 would increase the risk of further decline toward $730.
Conversely, if the BNB price bounces from the trendline, it indicates that the bulls are still buying on dips. The pair could then rise to the resistance zone above between $928 and $959, where the bears are expected to re-enter.
Technical Analysis of XRP
XRP reversed from the moving averages and fell below the $1.77 mark, showing that the bears are still in control.
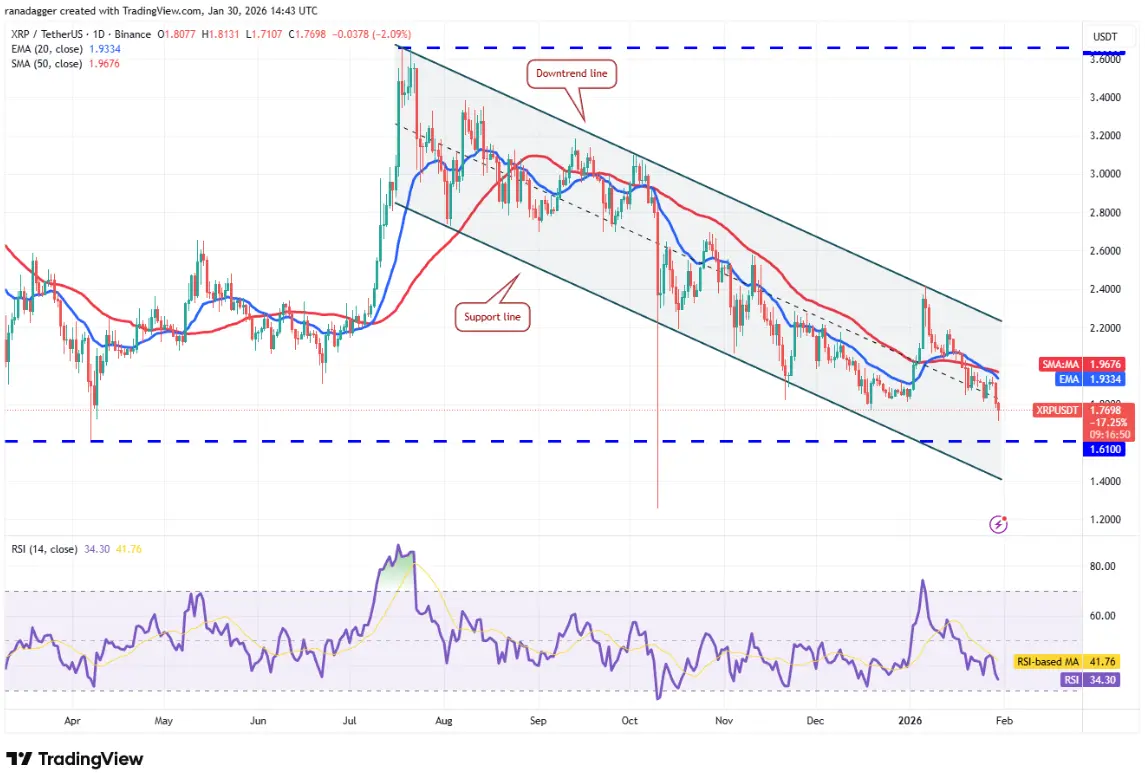 Daily XRP/USDT Chart | Source: TradingView The XRP/USDT pair is likely to decline to $1.61 — an important level to watch. If the bears push the price below this support, the risk of further decline toward the support line of the descending channel increases.
If the price rebounds from $1.61, XRP could face selling pressure again at the moving averages. If the bulls can overcome this barrier, the pair may move up to the descending trendline. A close above the downtrend line would indicate that the bulls have regained control.
Technical Analysis of SOL
The sideways movement of Solana between $117 and $147 was broken downward on Thursday, indicating that the bears are trying to seize control.
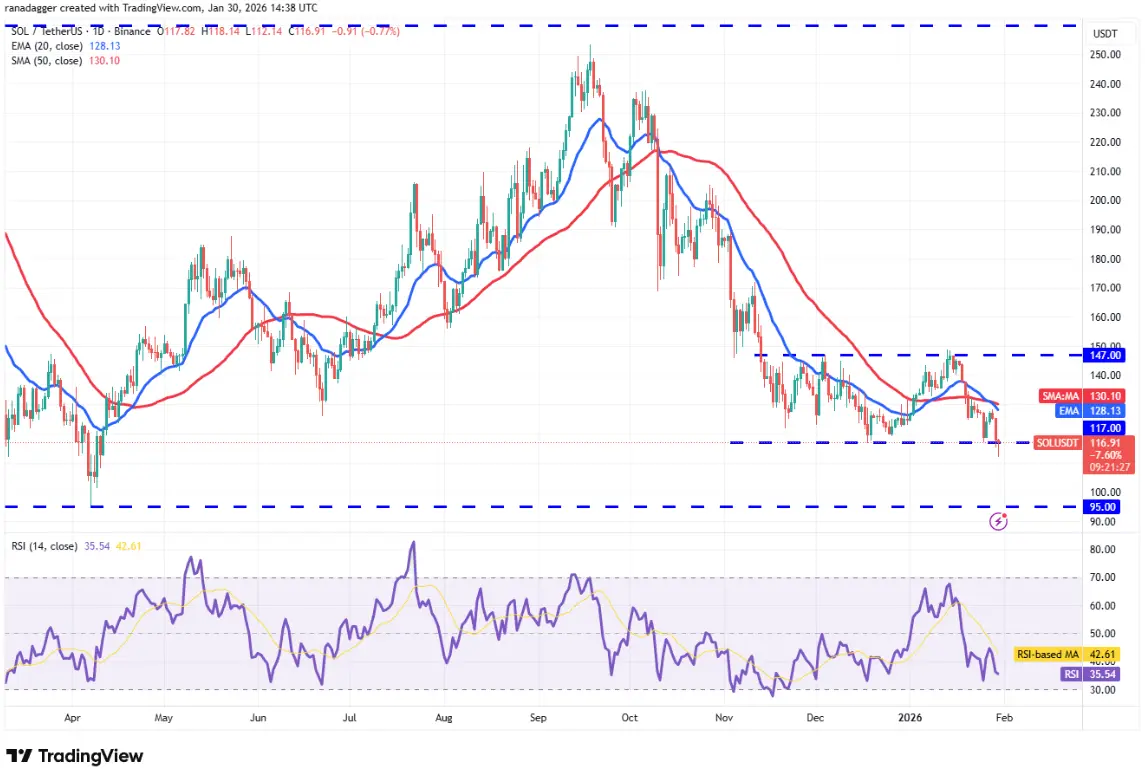 Daily SOL/USDT Chart | Source: TradingView If Solana’s price closes below $117, the SOL/USDT pair could drop to support at $95. The bulls are expected to defend this level strongly, because a breakdown could lead to a further decline to $79.
To negate the negative scenario, the bulls need to push the price back above the moving averages, which would suggest that the breakdown below $117 might have been a “bear trap.” If so, the pair could recover to the resistance at $147.
Technical Analysis of DOGE
Dogecoin closed below the support zone of $0.12 on Thursday, signaling the resumption of the downtrend.
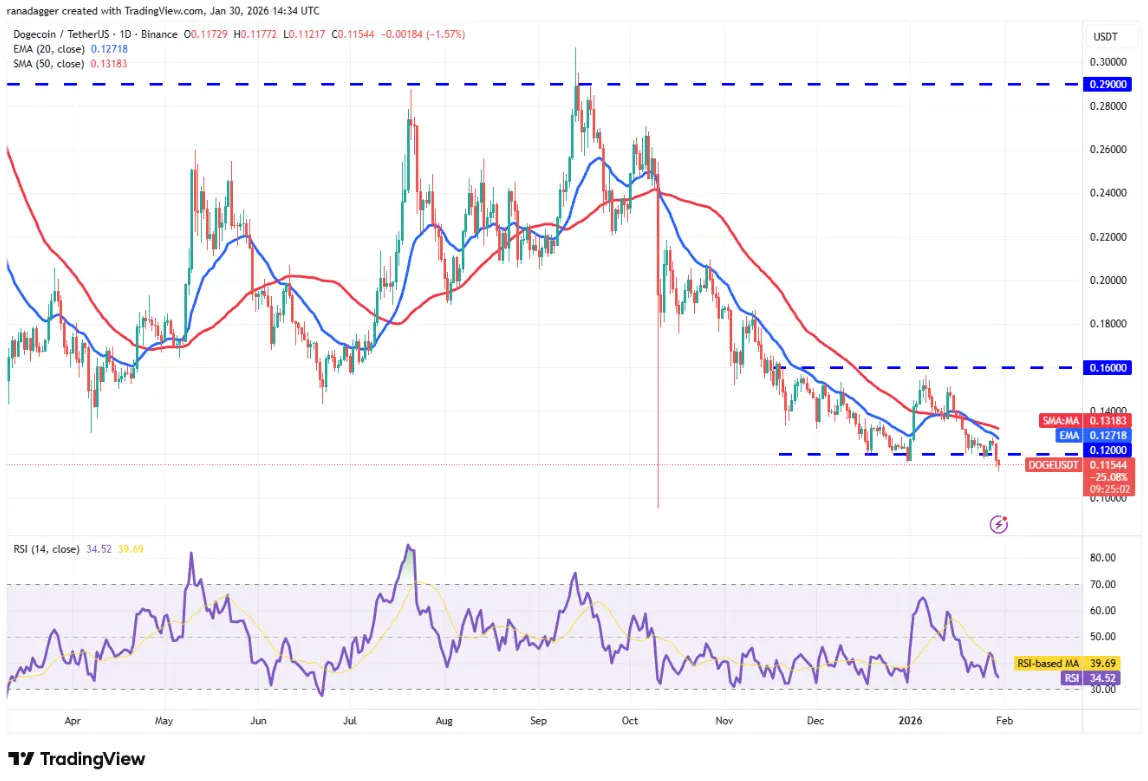 Daily DOGE/USDT Chart | Source: TradingView The bulls will try to push DOGE back above $0.12, but are likely to face strong resistance from the bears. If the price turns down from $0.12 or the moving averages, the risk of a plunge to the October 10, 2025, low of $0.10 increases.
This negative outlook will be invalidated in the short term if DOGE/USDT rebounds and breaks above the moving averages, indicating strong buying at lower levels and opening the door for a recovery to $0.16.
Technical Analysis of ADA
Cardano (ADA) is witnessing a fierce struggle between the buyers and sellers around the $0.33 level.
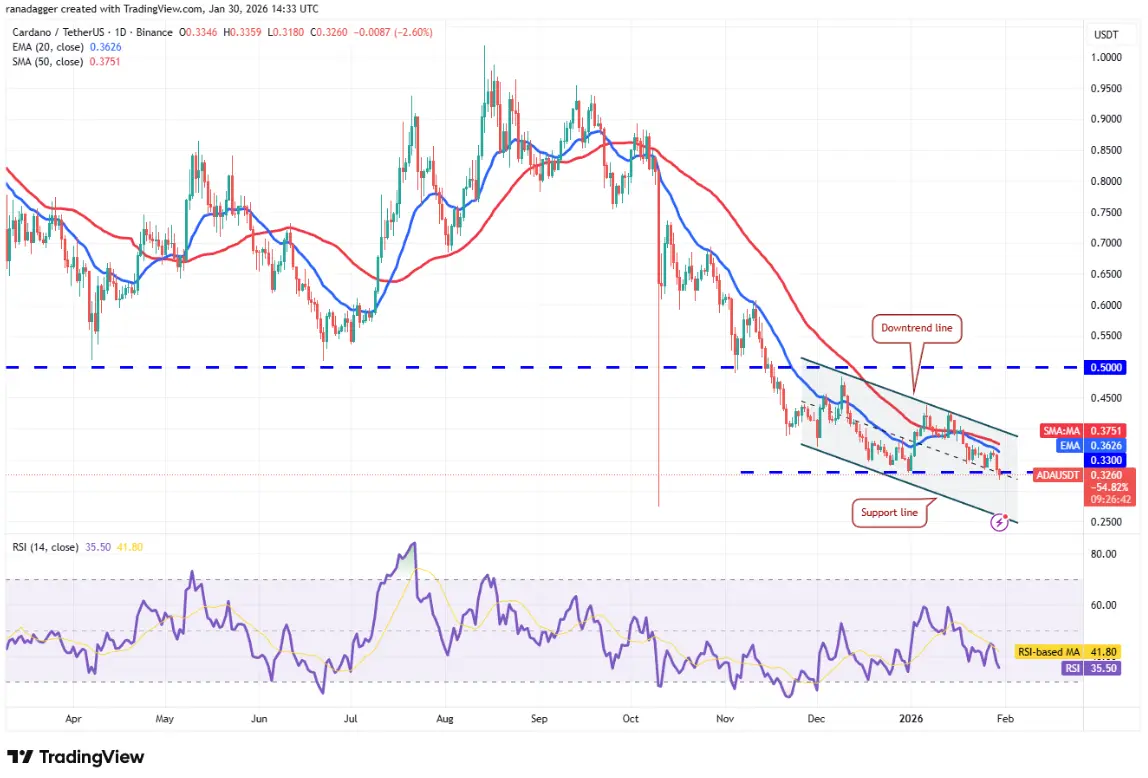 Daily ADA/USDT Chart | Source: TradingView If ADA’s price closes below the support zone of $0.33, the pair could decline toward the support line of the descending channel. The bulls are expected to defend this support zone, near the October 10, 2025, low of $0.27.
Conversely, if the price rebounds from the current zone and breaks the downtrend line, it would indicate active buying at lower levels. The price could then rise toward the previous breakout level at $0.50.
Technical Analysis of BCH
Bitcoin Cash (BCH) dropped below the support zone of $563 on Thursday, completing a head and shoulders pattern pointing to a downtrend.
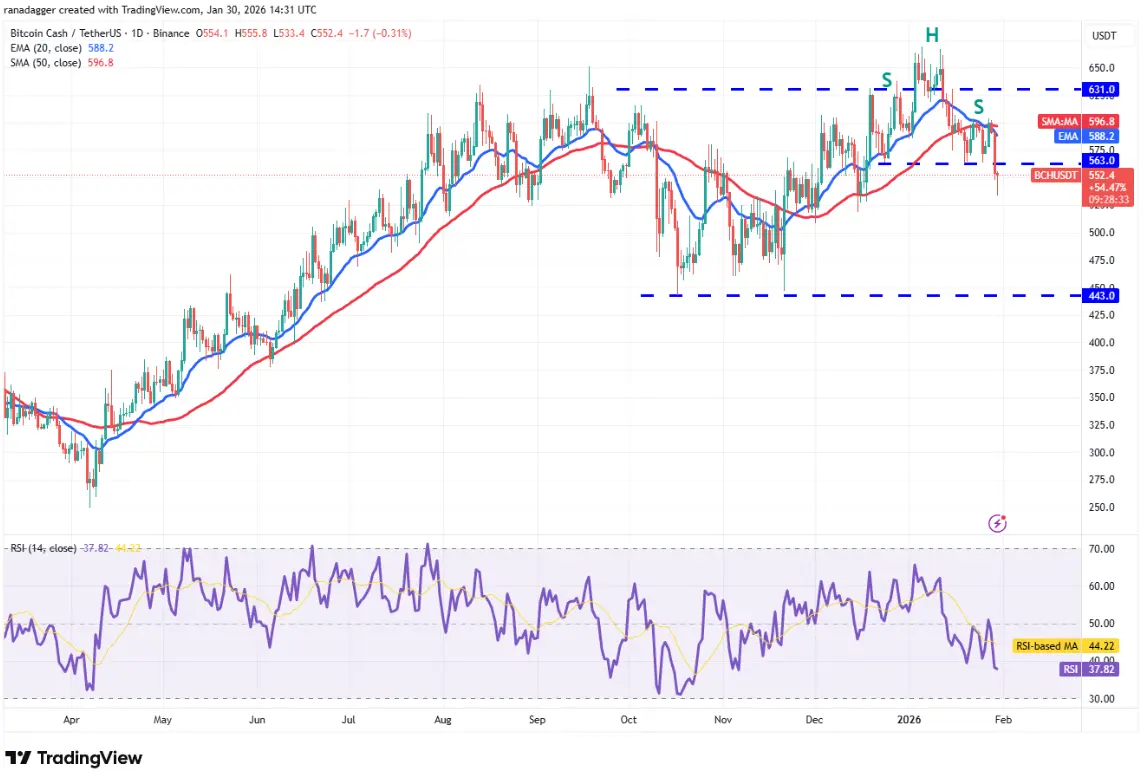 Daily BCH/USDT Chart | Source: TradingView The bulls will attempt to push BCH back above $563, but are likely to face strong resistance from the bears. If the price turns down from $563, it indicates that the bears have turned this zone into resistance. The probability of the price falling to $518, and then further toward the target of the pattern at $456, increases.
This negative outlook will be invalidated in the short term if buyers push the price above the resistance at $604. If successful, BCH/USDT could rise to $631, and further to $670.
Technical Analysis of HYPE
Hyperliquid (HYPE) price reversed downward from the breakdown zone at $35.50 on Thursday, showing that the bears are defending this level very aggressively.
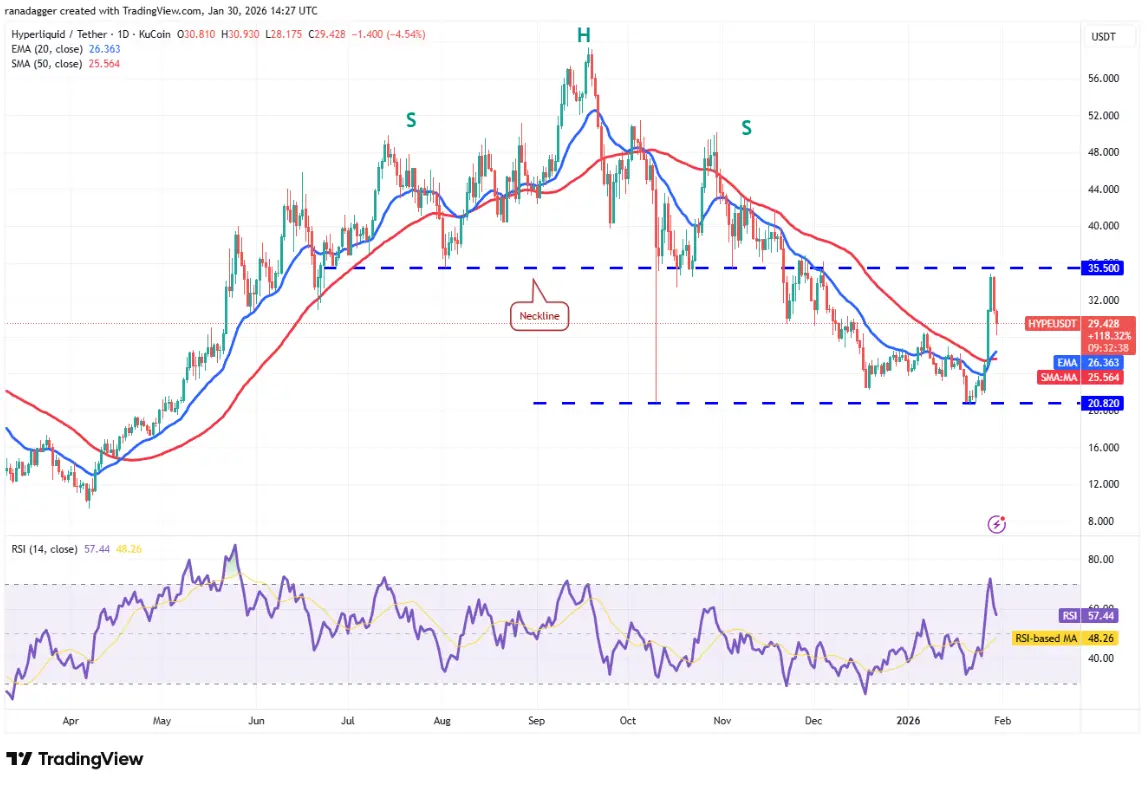 Daily HYPE/USDT Chart | Source: TradingView The 20-day EMA ($26.36) is a key support zone to watch below. If the price rebounds from the 20-day EMA, the bulls will continue trying to push HYPE/USDT above $35.50. Success could send the price up to $44.
Conversely, if Hyperliquid breaks below the moving averages, the pair could trade sideways within the range of $35.50 to $20.82 for some time. A downtrend could resume if the price falls below $20.82.
Technical Analysis of XMR
The bulls’ inability to push Monero (XMR) above the simple 50-day moving average (SMA) at $482 indicates that the bears are selling on minor recoveries.
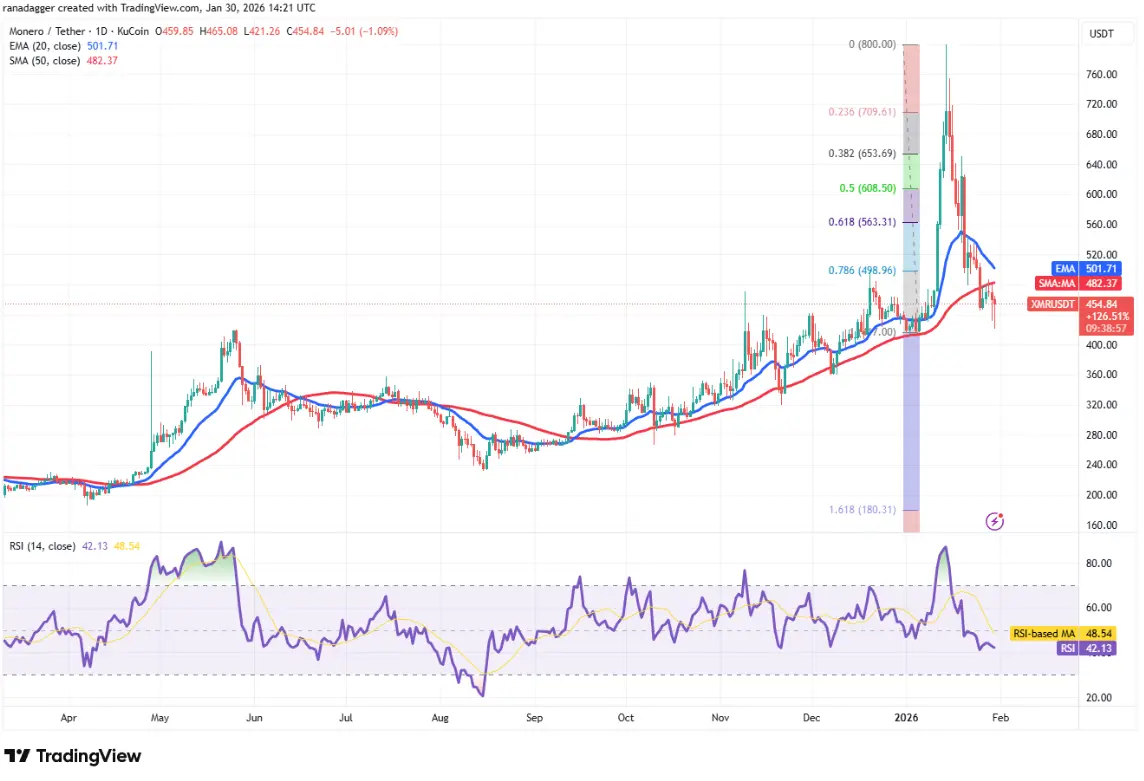 Daily XMR/USDT Chart | Source: TradingView The bulls are trying to defend the support zone at $417, as shown by the long wick. However, the technical rebound is likely to face selling pressure at the moving averages. If the price turns down from these levels, the risk of breaking below $417 increases. The XMR/USDT pair could then plunge to $360.
Buyers face a significant challenge. They need to push Monero above the 20-day EMA at $501 to signal a recovery. If successful, the price could rise to the $546 zone, where bears are expected to re-enter the market.
