Source: Jiemicro Insight杂谈
JPMorgan Global Market Strategy: What Signals Are Commodities Sending Us? February 5, 2026
The chaotic start to February has raised a question: Are the fluctuations in the commodities markets a sign of future trends, or just a correction?
We believe this is a healthy correction rather than a trend reversal, providing a buying opportunity for metals, while expecting the energy sector to decline further.
Although global growth is recovering and manufacturing activity is shifting, supporting demand, the divergence between energy and metals mainly stems from different supply dynamics.
From gold, silver to copper and Bitcoin, all commodity prices plummeted last Friday, marking the most significant market turmoil since November last year. Gold experienced its sharpest single-day drop since 1983, falling over 9%, while silver plunged 26%, recording the largest single-day decline on record. Grain and livestock futures also collapsed amid the turmoil in precious metals markets.
The sell-off continued into Monday, with energy markets under pressure: global natural gas prices collapsed, and oil prices saw their largest drop in six months. After margin requirements were increased on exchanges in the US and China, the sell-off in precious metals accelerated, compounded by seasonal selling before the Lunar New Year, intensifying the decline.
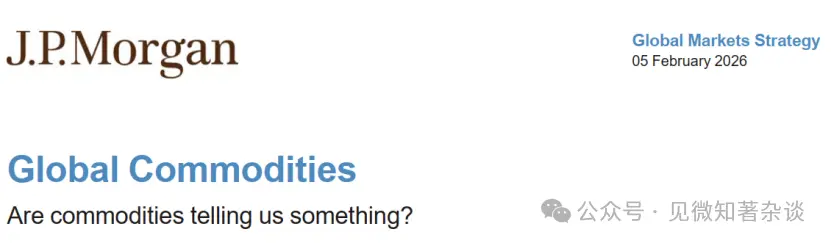
Overall, commodities lost nearly 8% during this brutal three-day crash, with US natural gas prices dropping 57%, silver down 33%, gold down 13%, and copper and oil each down 7%. This intense volatility persisted into midweek, with prices rebounding then falling again due to oscillating trading (Figures 1 and 2). The decline in commodities dragged US stock index futures lower, while Asian stock markets experienced their worst two-day drop since April last year.
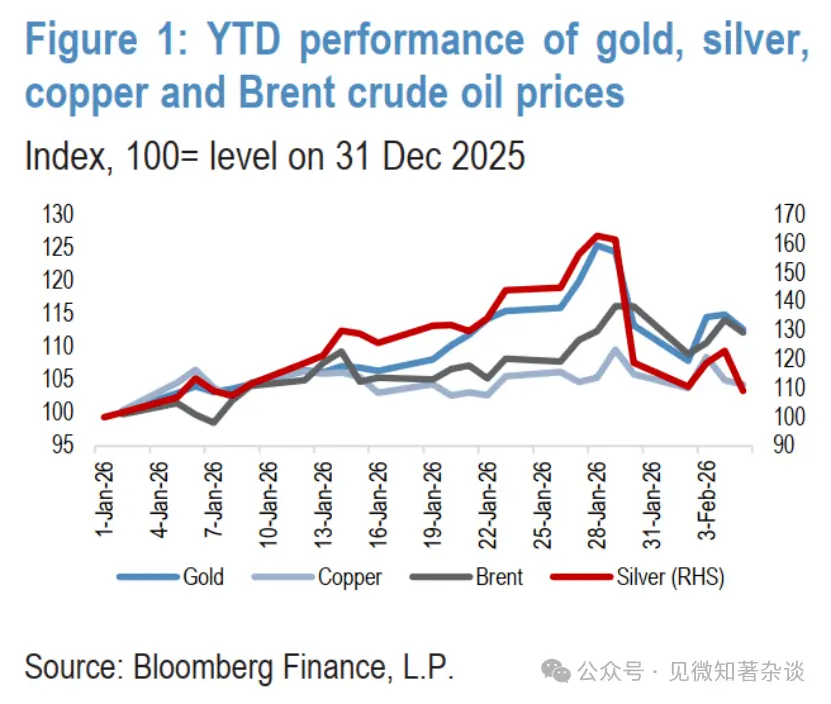
Figure 1: Year-to-date performance of gold, silver, Shanghai copper, and Brent crude oil prices
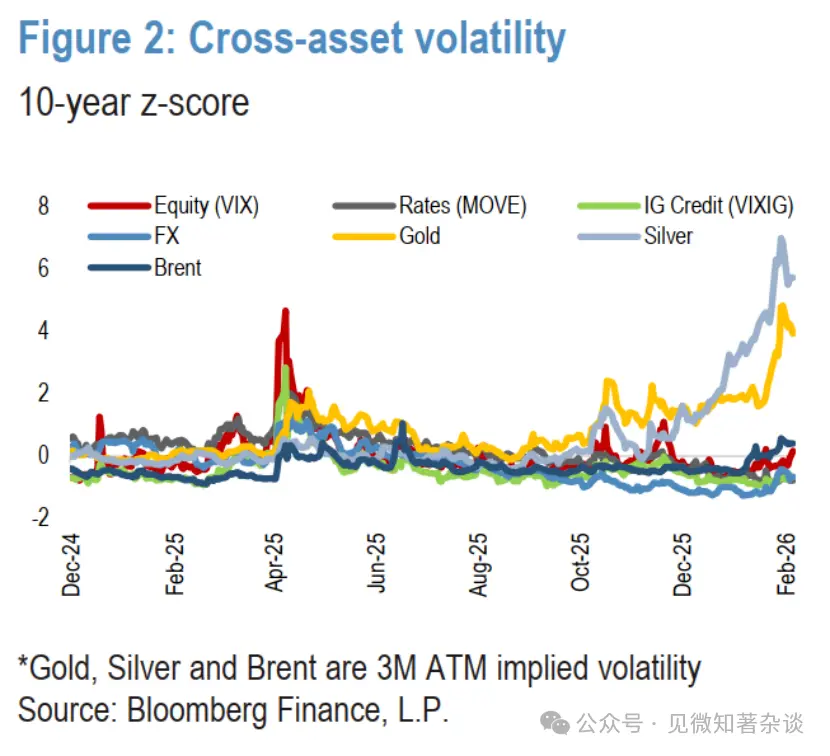
Figure 2: 10-year Z-score of cross-asset volatility
This week’s chaotic start raises a question: Is the sell-off in commodities a sign of future trends, or just a correction?
We believe this is not a turning point but a healthy correction, a buying opportunity for metals, while expecting more sell-offs in energy.
1. The first argument revolves around the global growth recovery
Since Q4 last year, there has been a clear cyclical rotation in global markets, reflected in metals, equities, and forex markets. This recovery is directly attributable to:
· Less restrictive monetary policies in developed countries (Figure 3)
· Expansionary fiscal policies in most major economies. In the US, the Congressional Budget Office forecasts that legislation like the “American Rescue Package” will boost US growth by 0.9%. Expansionary fiscal policies are not unique to the US. The IMF estimates that fiscal measures will boost Germany’s growth by 1% and Japan’s by 0.5% by 2026. Ultimately, in the coming quarters, fiscal policy in the G3 economies will be highly expansionary.
· As headwinds from trade wars and immigration restrictions fade, US growth and inflation have significant upside catalysts. Strong AI and data center spending, along with high AI stock prices, are boosting consumer wealth effects. Additional tailwinds include dollar depreciation, recent oil price declines, and economic stimulus from hosting the World Cup and the 250th anniversary of the United States.
The “American Rescue Package” further supports the outlook by cutting overtime and consumption taxes, increasing child tax credits, and extending full expensing for equipment and factories, which boosts household refunds and drives a boom in capital expenditure (Figure 4).
Figure 3: Official policy interest rates in developed countries
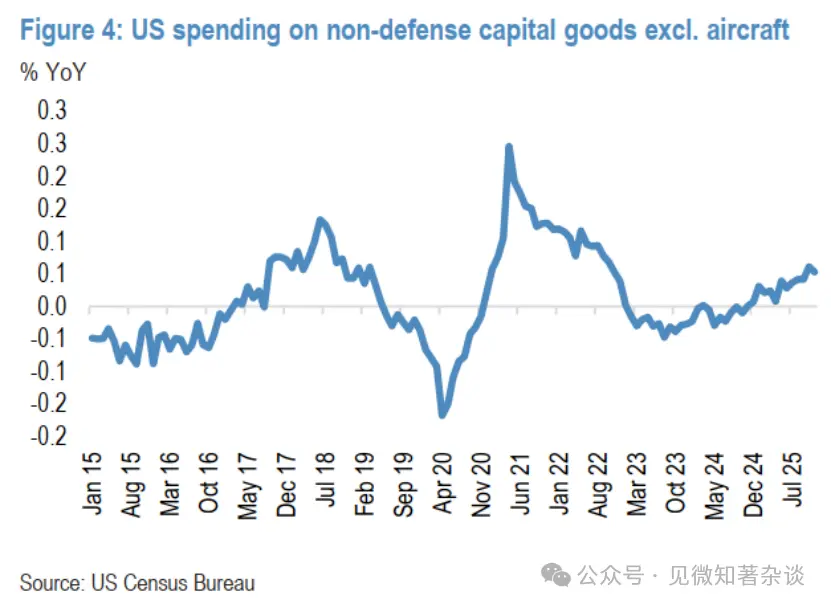
Figure 4: US non-defense capital goods (excluding aircraft) expenditure
2. Global manufacturing activity is shifting
Recent PMI data confirm that, supported by global monetary easing and surging tech investment, the global growth rebound is underway and broadening, with an increasing number of economies reporting higher output, which is especially encouraging. In developed markets, the US recorded its strongest ISM manufacturing data since August 2022, Japan showed significant improvement, and Western Europe also strengthened noticeably. While China’s output PMI remained roughly unchanged, there was a substantial increase in emerging Asian economies outside China, a key indicator. Overall, global PMI is operating at a solid, above-trend pace, with rising new orders providing constructive signals for sustainable recovery.
3. Given the reassessment of global growth, re-inflation trades in 2026 are underway, with commodities, materials, and industrial stocks performing well
Based on the historical relationship over the past 15 years between copper prices and global manufacturing PMI, recent copper price increases suggest PMI readings approaching 53—well above the latest around 50.5, and more optimistic than any other cyclical-sensitive markets we track. While year-over-year copper performance may exaggerate the market’s cyclical optimism, other markets also show some degree of optimism. For example, a simulated semiconductor stock basket (which shows similar explanatory power over the same period, R-squared about 0.42) suggests PMI could rise to around 52 by the end of Q1 2026. The sustained bullish trend after breaking out of multi-year ranges indicates that, despite the recent short-term reversal in metals, the cyclical component of the market trend remains strong (Figures 5 and 6).
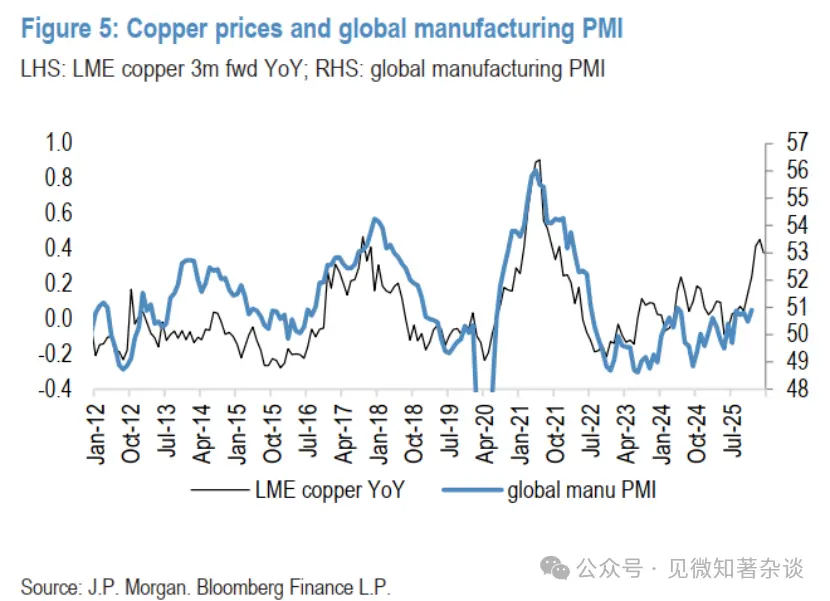
Figure 5: Copper prices and global manufacturing PMI
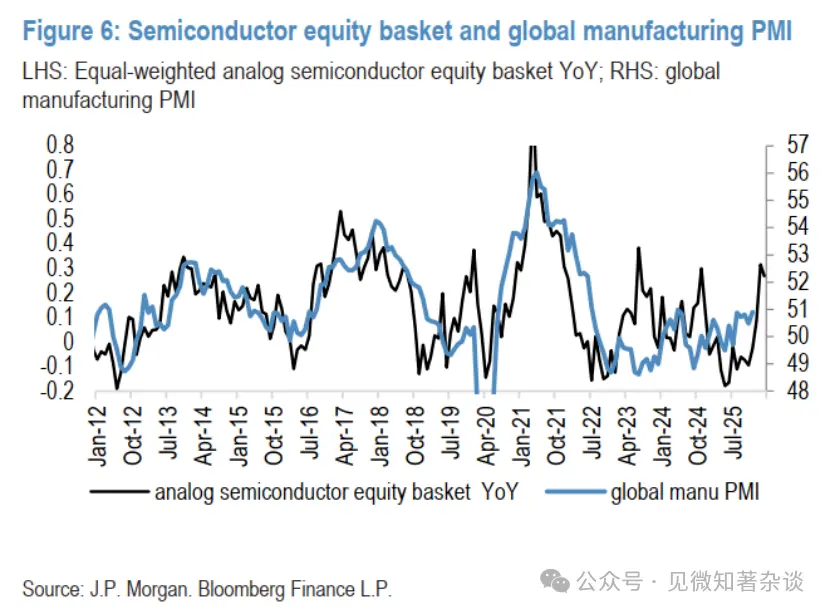
Figure 6: Semiconductor stock basket and global manufacturing PMI
4. However, the similarities within commodities end here
Last week’s sharp correction in precious metals was triggered by a rebound in the dollar (following Kevin Warsh’s nomination as the next Fed Chair), but the severity of the correction was mainly due to the rapid unwinding of large long positions established after two weeks of unsustainable price acceleration and overextension. In short, prices moved too far, too fast, with short-term momentum indicators soaring to levels rarely seen in precious metals markets.
In contrast, the 11% rise in Bloomberg energy prices since the start of the year was driven by temporary factors such as weather and geopolitical escalation. Large winter storms and freezing temperatures in parts of the US caused production disruptions and boosted heating fuel demand, while cold weather in Europe disrupted oil loading and depleted natural gas inventories. However, the most significant impact on oil prices was the escalation of tensions with Iran, which we believe will be short-lived given that this is an election year in the US.
Despite recent volatility, we remain bullish on gold and copper, while maintaining a bearish outlook on energy prices—this divergence mainly driven by different supply dynamics.
5. Maintain bullish outlook on gold; copper’s fundamentals still ahead
Remain bullish on gold. As seen over the past six months, gold’s long-term rally has not been linear, and it will not be in the future. We still see such corrections as healthy and necessary, not challenging our structurally bullish view. In fact, since gold remains a dynamic, multi-faceted hedge in portfolios with a clear structural story, we have seen physical buying on dips.
Beyond retail investor support in recent months, we continue to expect central banks to remain steadfast, becoming key buyers on dips. We now forecast official net purchases of 800 tons of gold this year, still 70% higher than pre-2022 levels (Figure 7).
Overall, we see room for continued diversification in gold, as physical assets outperform paper assets in this environment. We expect demand from central banks and investors this year to ultimately push gold prices to around $6,300 per ounce by the end of 2026 (Figure 8).
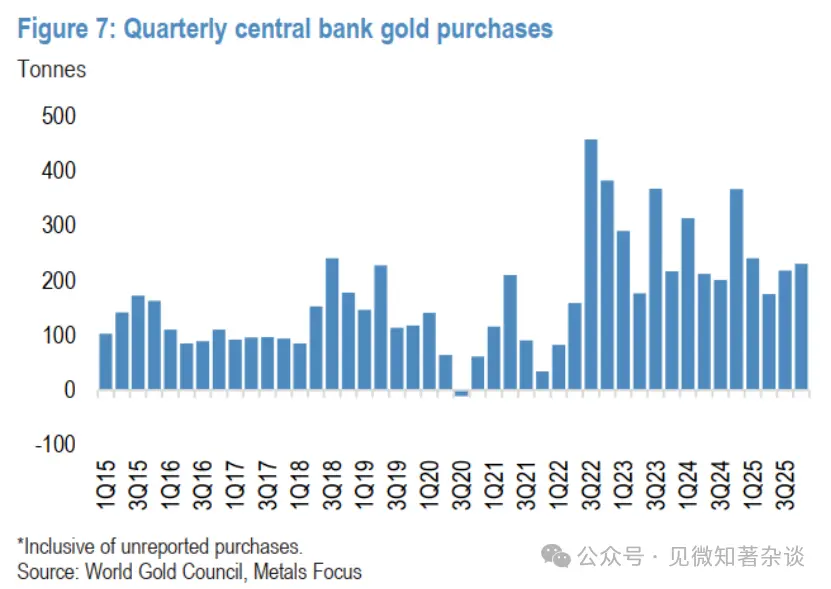
Figure 7: Central bank quarterly gold purchases
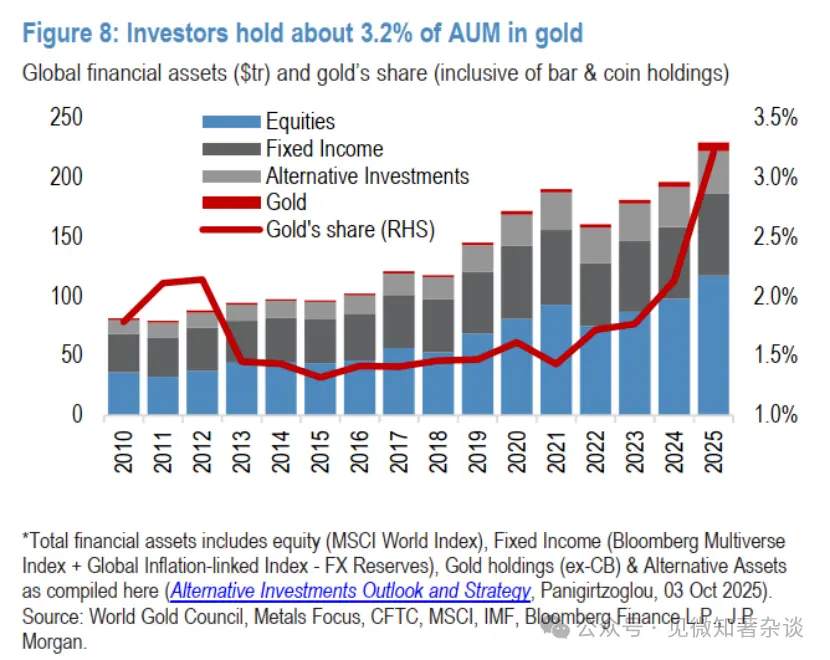
Figure 8: Investors hold about 3.2% of AUM in gold
We are more cautious on silver due to short-term risks of double-sided overshoot.
Silver is a smaller, more volatile market than gold, and lacks central banks as structural dip buyers. We are more concerned about the potential for deeper corrections in the short term. The price movement on Thursday (silver down about 10% as of writing) clearly illustrates this risk. While we do not believe gold and silver prices will fully decouple or become uncorrelated in the medium term, we do think that the relatively high silver valuation compared to gold, in a generally pressured precious metals sector, faces a greater risk of significant correction.
Nonetheless, although re-entering the market requires more caution compared to the clearer gold outlook, we still see a higher bottom for silver in the short term (around $75–80 per ounce in the coming quarters), with prices eventually rebounding to around $90 per ounce early next year. Even if previous gains during gold’s rally were excessive, silver is unlikely to completely give up its gains and decouple from gold.
Dips currently support copper prices; the fundamentals’ peak is still brewing.
Copper also joined the recent metals frenzy, briefly surpassing $14,000 per ton last week before retreating with other sector commodities. Although the weak fundamentals do not support the recent surge, we still see significant mispricing potential in copper, with a more bullish trend emerging in the coming months (Figure 9).
We continue to believe that the Trump administration is most likely to implement phased copper import tariffs, announcing intentions around mid-year, with tariffs taking effect in January 2027. This would reopen the COMEX/LME arbitrage window, attracting substantial copper imports into the US again.
Additionally, since we believe the recent weakness in Chinese demand over the past few months was mainly demand postponement (trying to wait for prices to fall), rather than a more worrying structural slowdown in Chinese end-use consumption, we expect a scenario where Chinese consumers will eventually need to accept higher prices later this year to bring copper back domestically.
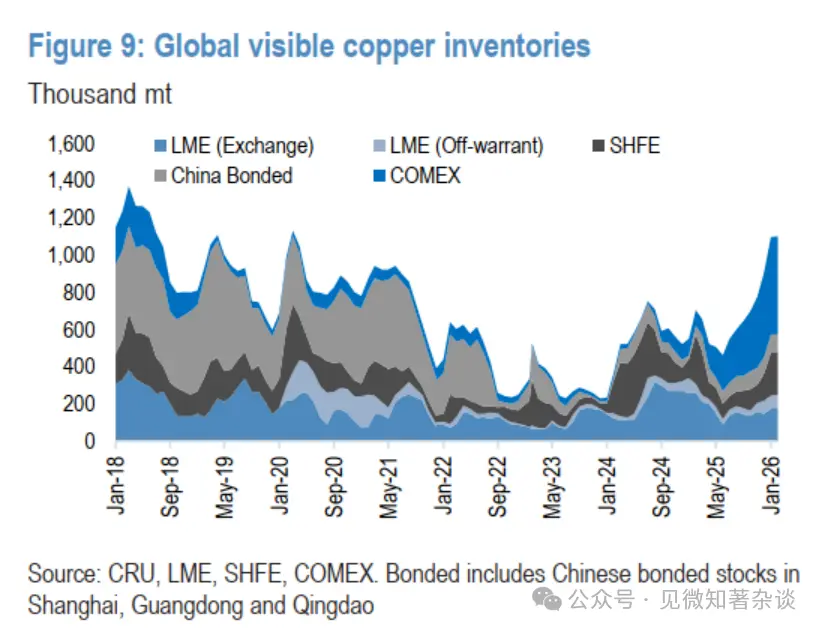
Figure 9: Global visible copper inventories
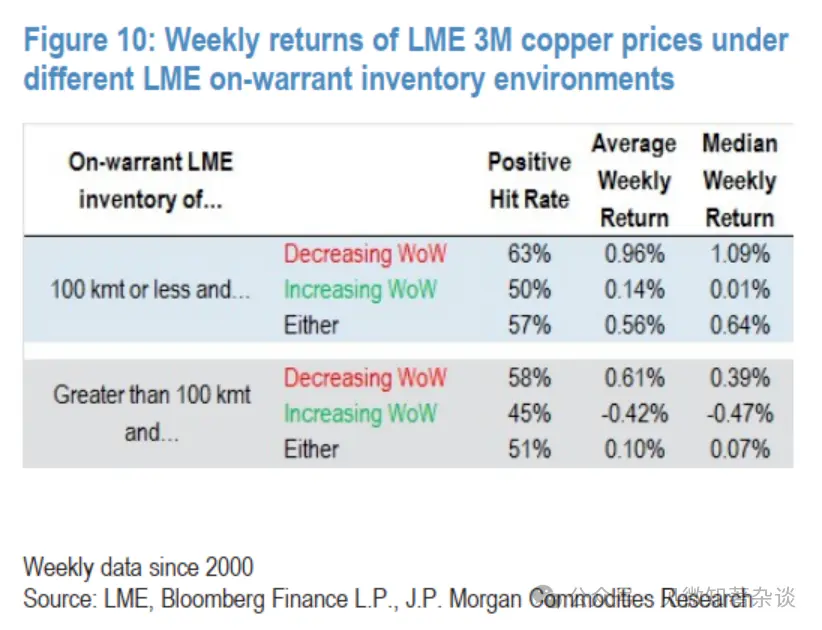
Figure 10: Weekly returns of 3-month LME copper under different registered warehouse stock environments
Around mid-year, the combined demand from the US and China continues to tilt the risk toward LME copper inventories falling to very low levels later this year, potentially causing spot prices to surge sharply, well above our $12,500/ton baseline quarterly average for Q2 2025, and possibly pushing the LME curve into deep backwardation above $15,000/ton (Figure 10).
Meanwhile, given this risk, high supply security concerns, and the necessity of copper and other critical minerals for supply chains, along with broader cyclical investor preferences, the willingness to buy copper on dips remains strong, currently forming a bottom around $12,500 per ton.
6. Oil prices include a $7/barrel geopolitical premium and should revert to fair value
Cold weather reduced supply and increased oil demand, adding about $2 per barrel premium in the last week of January. Kazakhstan and US production can fully recover within days, and Russian exports are near normal. However, oil prices still trade about $7 above fair value, almost entirely due to escalating tensions between Washington and Tehran (as of January 29, 2026) (Figure 11).
After weeks of confrontation (including US military shoot-down of an Iranian drone near an American aircraft carrier and Iranian naval harassment of commercial ships), both sides agreed to resume indirect talks in Oman on Friday. Iran insists discussions should be strictly limited to nuclear issues, while the US pushes for a broader agenda, including restricting Tehran’s ballistic missile arsenal, ending support for regional proxies, and addressing its treatment of the Iranian people.
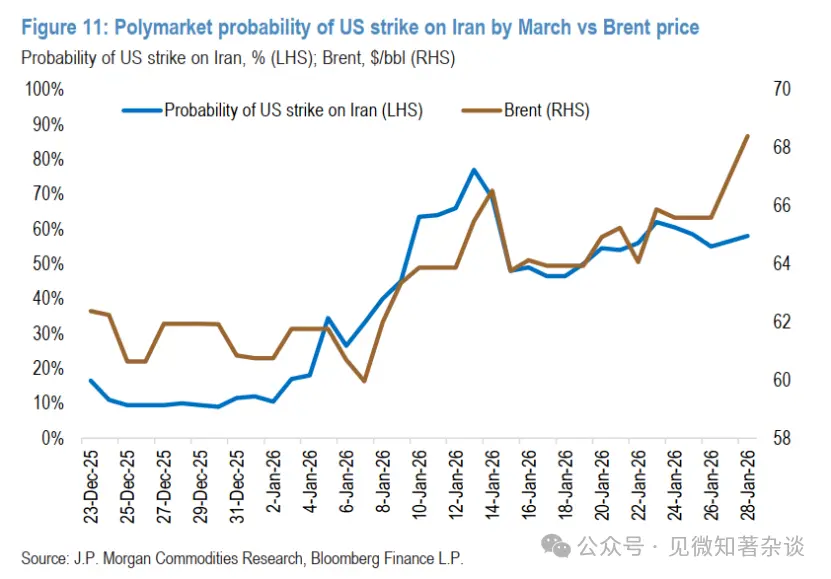
Figure 11: Probability of US striking Iran before March vs Brent oil price (Polymarket forecast)
President Trump has issued blunt warnings to Iran’s leadership and deployed significant US forces to the region, raising concerns of escalation, despite Gulf nations and other regional powers urging diplomacy and warning against war. Iran’s leadership faces severe domestic economic and social crises and appears willing to negotiate “fairly and justly,” but core disagreements remain.
Given high US inflation and this year’s midterm elections, we do not expect this confrontation to cause lasting disruptions to oil supply. If military action occurs, it is likely to be targeted, avoiding Iran’s oil production and export infrastructure. Due to the region’s proximity to key energy transit chokepoints, short-term geopolitical-driven oil price spikes may persist, but these should eventually fade, leaving underlying weak global fundamentals.
We forecast strong demand growth this year, but with global supply expanding at roughly three times the pace of demand, half of which comes from non-OPEC+ producers—driven by robust offshore development and ongoing global shale activity.
7. Natural gas—A cold winter (and position adjustments)
January saw a perfect storm hit the global natural gas market, causing prices to rollercoaster. The month was characterized by rapidly changing weather forecasts, combined with historically low inventories and position adjustments by European investors, further accelerating volatility. The February TTF contract settled at €40.1/MWh—up 40% from January and nearly 50% above the recent low on December 16, 2025. Meanwhile, the February Henry Hub contract settled at $7.46/MMBtu, more than doubling within just seven trading days, reaching levels unseen since 2022.
European natural gas prices surged to a one-year high, driven by cold weather, depleted inventories, and market positioning. TTF prices previously hit recent lows in mid-December amid expectations of a warmer-than-normal winter and optimism about new LNG supplies in 2026—what we believe was market complacency. This sentiment was reflected in investor behavior: net short positions in the market for the first time since March 2024, with short positions increasing throughout December to a low of -93 million MWh, the lowest since 2020.
However, as weather patterns became more volatile, the forecast for January heating degree days (HDDs) rose from the second week of the month, shifting the narrative (Figure 12). TTF prices soared due to extremely low inventories and rising demand for heating and power generation (see “Baby, It’s Still Cold Outside,” Jan 13, 2026). Prices stabilized around €40/MWh, supported by extended US cold spells and concerns over LNG supply disruptions caused by freezing outages, surging domestic demand, and severe storms. As weather outlooks across the Atlantic normalized, the March TTF contract fell from €39.3/MWh on January 30 to about €33/MWh on February 3 (Figure 13).
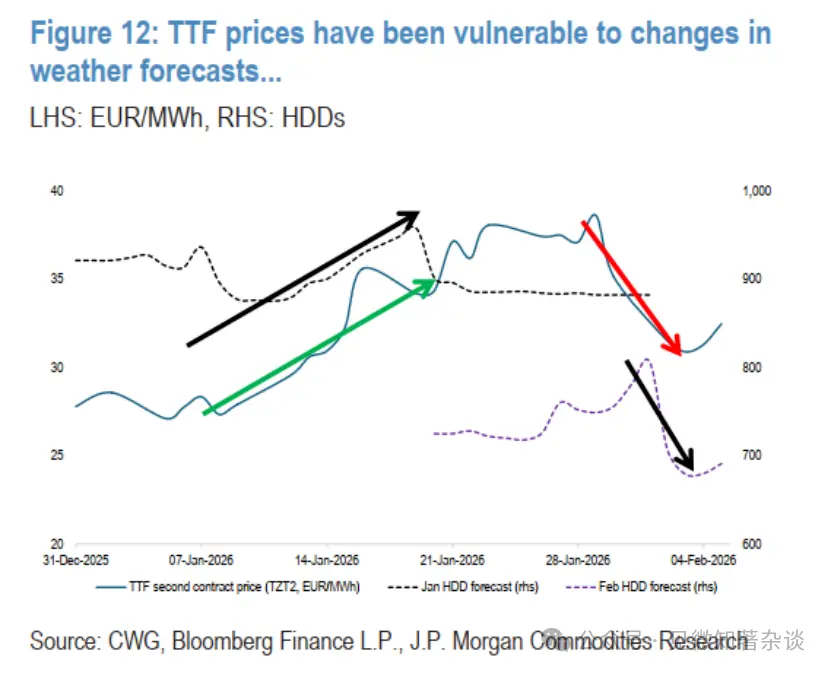
Figure 12: TTF prices highly sensitive to weather forecast changes…
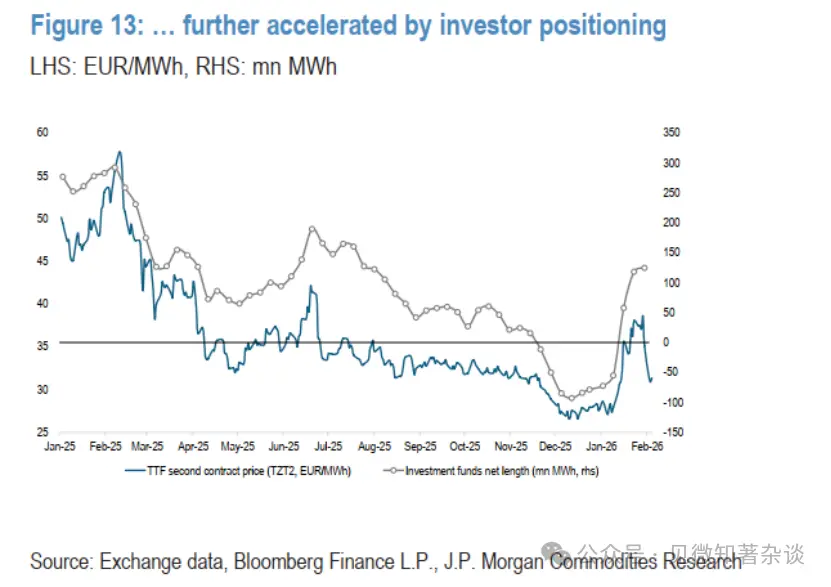
Figure 13: …and accelerated by investor position adjustments
US natural gas joined the rally later in the month as cold spells swept across the country. Prices started the year relatively low, with February contracts trading below $4/MMBtu, and fell to $3.10 on January 16, then surged sharply, settling at $7.46 on January 28. During this period, January HDD forecasts rose sharply from about 900 HDDs to 985 HDDs, exceeding the 10-year average of 891 HDDs and the 30-year average of 933 HDDs. Cold weather expectations extended into February, with forecasts rising from 771 HDDs on January 19 to a peak of 840 HDDs on January 30.
However, this week’s weather outlook shifted significantly toward warmer conditions. In response, prices sharply retreated, with the March contract falling from $4.03/MMBtu on January 30 to around $3.25/MMBtu at the time of writing (Figure 14).
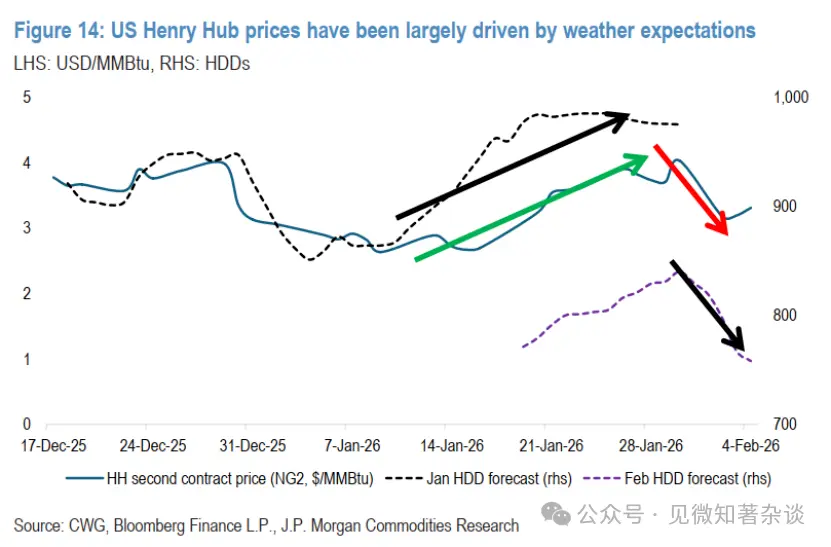
Figure 14: US Henry Hub prices mainly driven by weather expectations