In the cryptocurrency market, “bottom fishing” is an extremely tempting yet highly risky game. If you are also passionate about identifying market turning points, this on-chain indicator that has been validated through multiple bull and bear cycles may become your “North Star” for accurately pinpointing bottoms in a bear market.
This indicator is called “Bitcoin Profit and Loss Supply,” primarily used to measure the overall profit and loss status of coin holders in the market — how many Bitcoins are still in profit on paper, and how many are trapped in unrealized losses.

Historical data repeatedly proves that when the “profit supply” and “loss supply” of Bitcoin tend to balance out or even intersect on the chart, it often signals that the bear market bottom has formed, indicating that the market has entered the final stage of “capitulation selling,” and the long-term investment window is opening.
For bullish investors hoping for a return of the bull market, good news may be just around the corner. Data shows that the number of profit chips and loss chips is showing an approaching “crossover” trend.
According to Glassnode statistics, approximately 11 million Bitcoins are currently in profit, meaning their holding costs are below the current market price; meanwhile, about 8.9 million Bitcoins are in loss. The gap between the two is narrowing, and if this convergence trend continues, it could replay the bottoming scripts of 2022 and 2018-19.
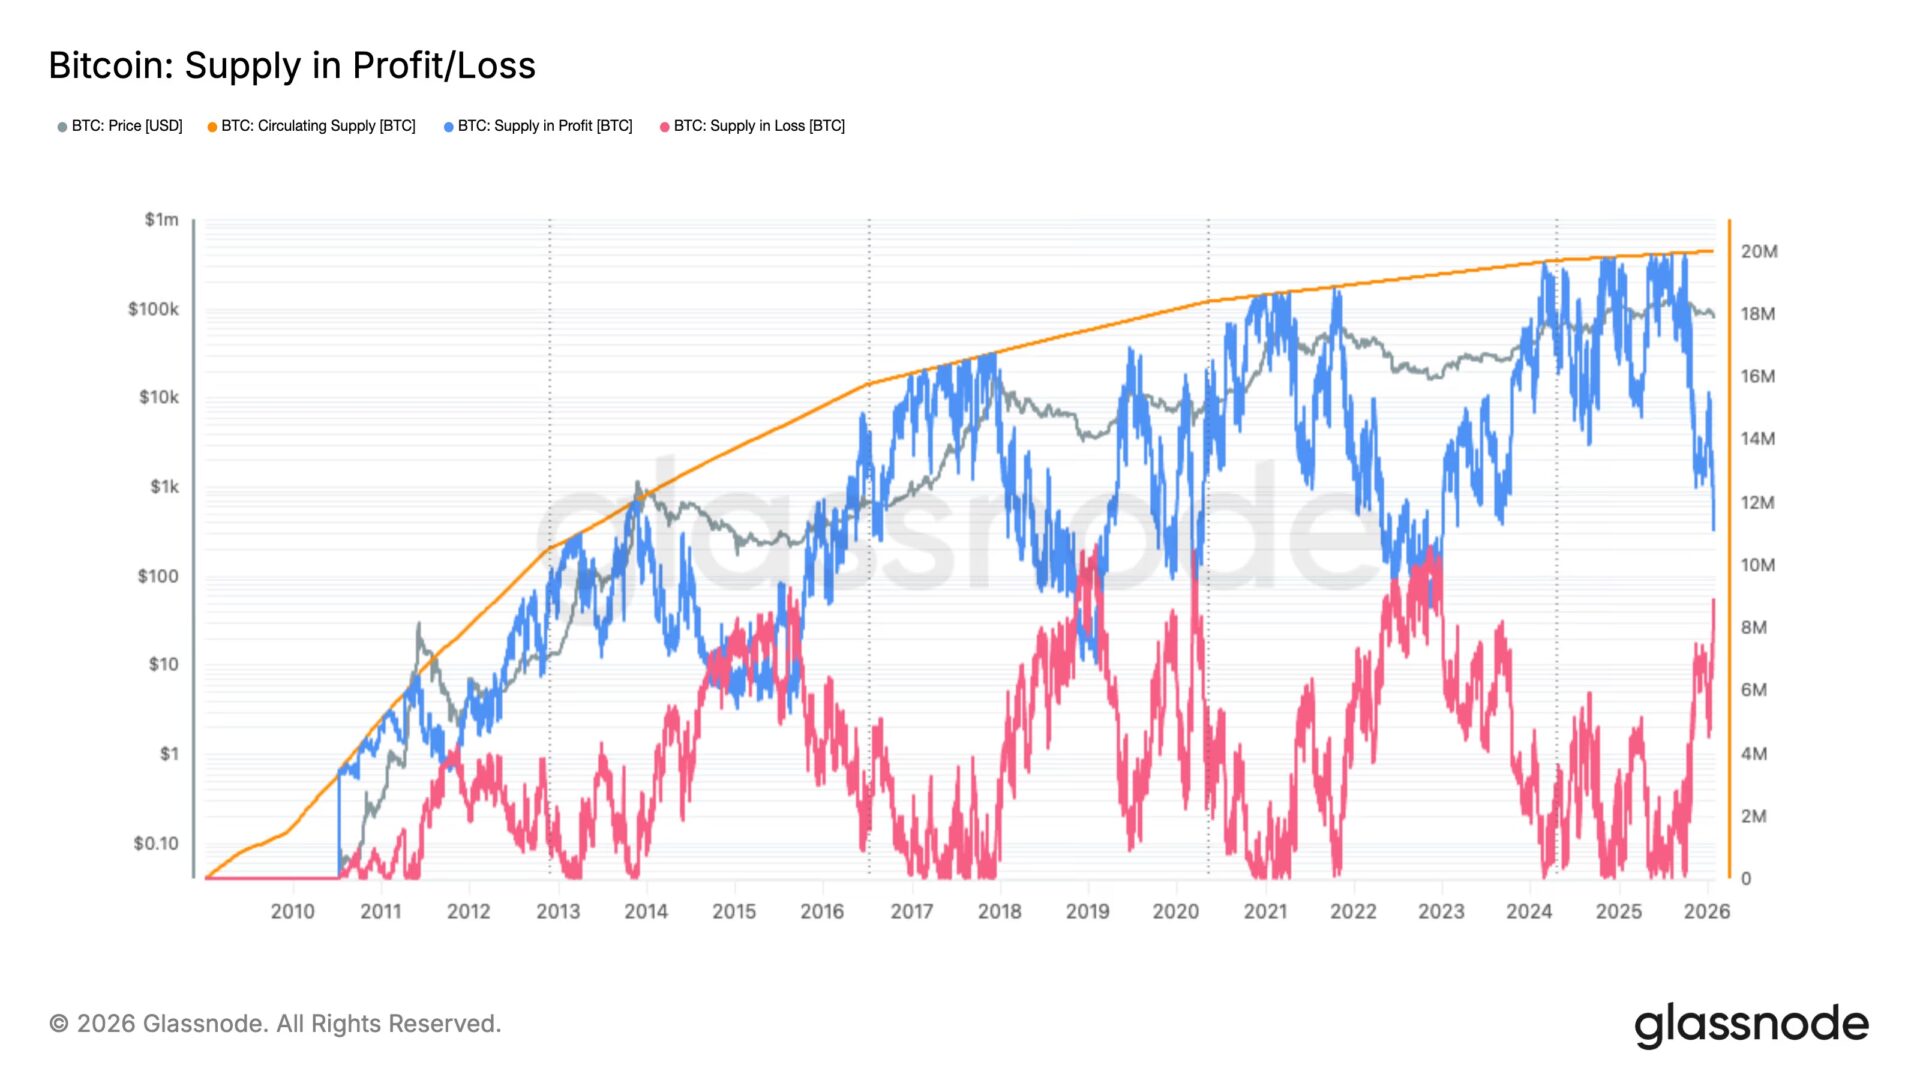
In Glassnode’s analysis chart, the blue line represents the “profit supply,” while the red line indicates the “loss supply.”
When Bitcoin’s spot price fluctuates around the overall cost basis of investors’ holdings, the chips will flow between these two camps. By observing the growth and decline of these two lines, we can gain deep insights into the market’s holding structure and the stress test faced by investors.
Looking back at past cycles, the “crossover points” of these two curves have accurately marked the bear market bottoms multiple times:
- November 2022: Amid panic over the collapse of FTX exchange, Bitcoin dropped to around $15,000, and the indicator showed a crossover, followed by a market bottom and rebound.
- March 2020: The COVID-19 pandemic triggered a global liquidity crisis, causing Bitcoin to briefly fall below $3,000, with the indicator also signaling strongly.
- January 2019: During a prolonged bear winter, Bitcoin fell to around $3,300, and the indicator once again confirmed the bottom.
- 2015: In early market cycles, Bitcoin also exhibited the same structure when trading above $200.
Disclaimer: The information on this page may come from third parties and does not represent the views or opinions of Gate. The content displayed on this page is for reference only and does not constitute any financial, investment, or legal advice. Gate does not guarantee the accuracy or completeness of the information and shall not be liable for any losses arising from the use of this information. Virtual asset investments carry high risks and are subject to significant price volatility. You may lose all of your invested principal. Please fully understand the relevant risks and make prudent decisions based on your own financial situation and risk tolerance. For details, please refer to
Disclaimer.