Ethereum’s drawdown deepens, but compressed leverage and negative funding raise odds of volatility before true capitulation.
Ethereum is nearing a rare technical threshold, with price action pointing toward a sixth consecutive monthly red candle. According to market commentators, such an outcome would place the current drawdown just one month away from matching the 2018 seven-month losing streak, the longest in its history.
Open Interest Collapse Signals Major Leverage Flush in ETH
As per Coinglass data, January closed down 17.52%, followed by a 19.81% decline in February. March has attempted stabilization but remains vulnerable. Should it close negative, Ethereum would enter statistically uncommon territory. Seasonality adds further weight. March has historically averaged a 17.24% gain, with a 9.33% median return. A red close would mark a clear break from that pattern.
📉 $ETH Monthly Close Watch
Ethereum is on track to print its 6th consecutive monthly red candle.
The longest streak ever recorded was 7 straight red months back in 2018.#ETH #Ethereum #CryptoMarket pic.twitter.com/q88SyBImv8
— Dariusz Kowalczyk (@darekinvest) March 1, 2026
Looking back at 2018 provides perspective, as that stretch followed the post-ICO bubble collapse. Monthly losses frequently ranged between 20% and 50%. Volatility was elevated and derivatives markets were far smaller.
By contrast, the current drawdown has been persistent but less violent. Price has trended lower in a controlled manner rather than through sharp capitulation waves.
Open interest across exchanges peaked near $30 billion during the 2025 rally. It now stands around $11.6 billion, reflecting a contraction of roughly 60% to 65%. Such a decline confirms a broad deleveraging cycle rather than a mild correction.
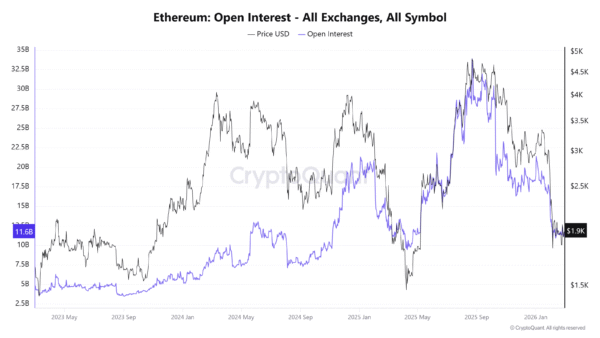
_Image Source: _CryptoQuant
More importantly, open interest is no longer falling aggressively. Most long-side crowding has already cleared. Positioning appears compressed rather than stretched. Early bear markets often show rising leverage before deeper breakdowns. Current conditions resemble a late-stage reset instead of fresh excess.
Funding rates reinforce that shift. Positive readings seen during January’s crowded positioning have turned negative. Current levels hover near -0.0043. Shorts are paying longs, signaling a downside bias in sentiment.
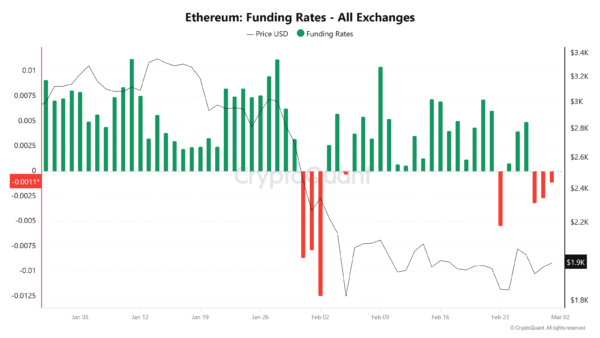
_Image Source: _CryptoQuant
Sustained negative funding during compressed open interest periods often creates asymmetry. Short squeezes or relief rallies can emerge even within broader downtrends. In 2018, by comparison, weak funding reflected structural demand collapse rather than positioning imbalance.
ETF Outflows and Short Positioning Cloud Ethereum’s Monthly Close
Institutional flows add another dimension, as spot Ethereum ETFs have recorded approximately $369.8 million in monthly net outflows. Inflows during mid-last year supported the rally toward the $4,000 to $5,000 range. Current weakness, however, is unfolding alongside reduced institutional exposure.
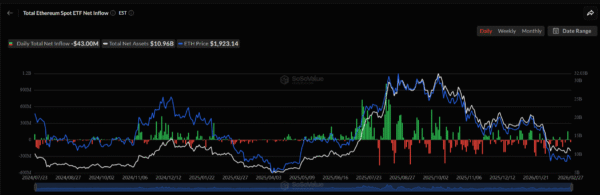
_Image Source: _SoSoValue
Although outflows point to softer risk appetite, total assets under management remain substantial. Activity suggests tactical de-risking rather than structural exit. Institutions appear cautious but not fully withdrawn.
Exchange netflows show a steady rise in inflows during price weakness. Coins are moving onto trading platforms, signaling distribution pressure. However, flows have not reached panic levels associated with major capitulation events. No single monthly flush of 30% to 40% has occurred.
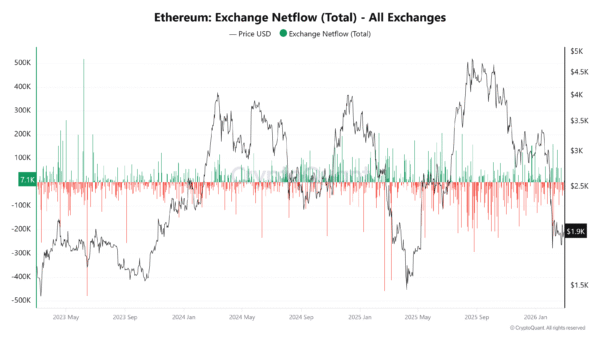
_Image Source: _CryptoQuant
Essentially, selling appears controlled rather than disorderly. Gradual distribution prevails over forced liquidation. That distinction separates current conditions from the rapid collapse seen in 2018.
Looking ahead, a continued grinding lower would require sustained ETF outflows and renewed short build-up alongside rising open interest. A short squeeze becomes plausible if funding stays negative while positioning remains compressed. Such an imbalance could trigger higher volatility.
A true capitulation scenario would require sharp exchange inflow spikes, a rapid surge in open interest followed by a collapse, and a large monthly drawdown. So far, evidence for that outcome remains limited.
Six consecutive red months would be statistically rare. Besides, structural signals do not mirror the violence of 2018. Ethereum now sits between exhaustion and renewed pressure. The coming monthly close may shape the next decisive move.
Disclaimer: The information on this page may come from third parties and does not represent the views or opinions of Gate. The content displayed on this page is for reference only and does not constitute any financial, investment, or legal advice. Gate does not guarantee the accuracy or completeness of the information and shall not be liable for any losses arising from the use of this information. Virtual asset investments carry high risks and are subject to significant price volatility. You may lose all of your invested principal. Please fully understand the relevant risks and make prudent decisions based on your own financial situation and risk tolerance. For details, please refer to
Disclaimer.
Related Articles
Whale Stakes 50,000 ETH on Everstake Worth Over $116.97M
Gate News message, April 15 — According to Onchain Lens, a major whale has staked 50,000 ETH on Everstake, worth approximately $116.97 million.
GateNews8h ago
Bitcoin, Ethereum and Solana ETFs Record Positive Net Inflows on April 15
Gate News message, according to the April 15 update, Bitcoin ETFs recorded a single-day net inflow of 4,566 BTC (approximately $337.41 million) and a 7-day net inflow of 6,753 BTC (approximately $499.04 million). Ethereum ETFs saw a single-day net inflow of 23,405 ETH (approximately $54.37 million)
GateNews10h ago
ETH 15-minute pullback of 0.60%: Long leverage getting liquidated at high levels as whale short-term selling aligns, driving the move downward
From 13:30 to 13:45 (UTC) on 2026-04-15, ETH recorded a -0.60% return at a short-term high, and the price fluctuated within 2317.79 - 2333.92 USDT, with an amplitude reaching 0.69%. In the preceding 24 hours, ETH had risen strongly, with the highest gain reaching 9.5%, and market attention noticeably heated up. The negative return during this period reflects a rapid shift in local sentiment in the high-price area.
The main driver behind this move is long liquidation profit-taking in the derivatives market and partial deleveraging (cutting) of local leveraged funds. In the ETH futures market over the past 24 hours, the shorts
GateNews10h ago
BlackRock Transfers 15,101 ETH and 566 BTC to Major CEX, Worth $75.96M
BlackRock recently transferred over $35 million in ETH and $41 million in BTC through its ETFs to a major CEX, totaling nearly $76 million in value.
GateNews12h ago
On-Chain Trader 0x049b Opens 20x Leveraged Long on BTC and ETH, Accumulates $5.17M Profit in Two Months
A trader known as 0x049b has opened a 20x leveraged long position, buying 269 BTC and 8,586 ETH. Over two months, they executed 47 trades, achieving a 63.83% win rate and a total profit of $5.17 million.
GateNews13h ago
Gate Idle Coin Wealth ETH 7-day fixed-term financial management additional reward pool is live; subscribe to enjoy a 10% annualized return bonus.
Gate News, according to Gate’s official announcement
Gate’s Yuebi Bao launches an ETH 7-day term wealth management product with an additional rewards pool. Subscription users can enjoy a 10% annualized return bonus. This rewards pool cumulatively provides 500,000 OFC in additional rewards, using a first-come, first-served mechanism.
The additional rewards will be distributed to users’ accounts on a daily basis in the form of an equivalent amount of OFC. The platform has an overall cap on the total activity rewards and a limit on the maximum amount each individual user can receive.
GateAnnouncement16h ago
