Research data from Mizuho Financial Group shows that the adjusted trading volume of USDC reached approximately $2.2 trillion in 2026 so far, while USDT was $1.3 trillion, marking the first time since 2019 that USDC has surpassed USDT in this key metric. At the same time, country-level holding data indicates that USDC holdings in Colombia, South Africa, Germany, Brazil, and the United States have overtaken USDT.
Reversal in Adjusted Trading Volume: A Key Indicator of “Real Usage” of Stablecoins
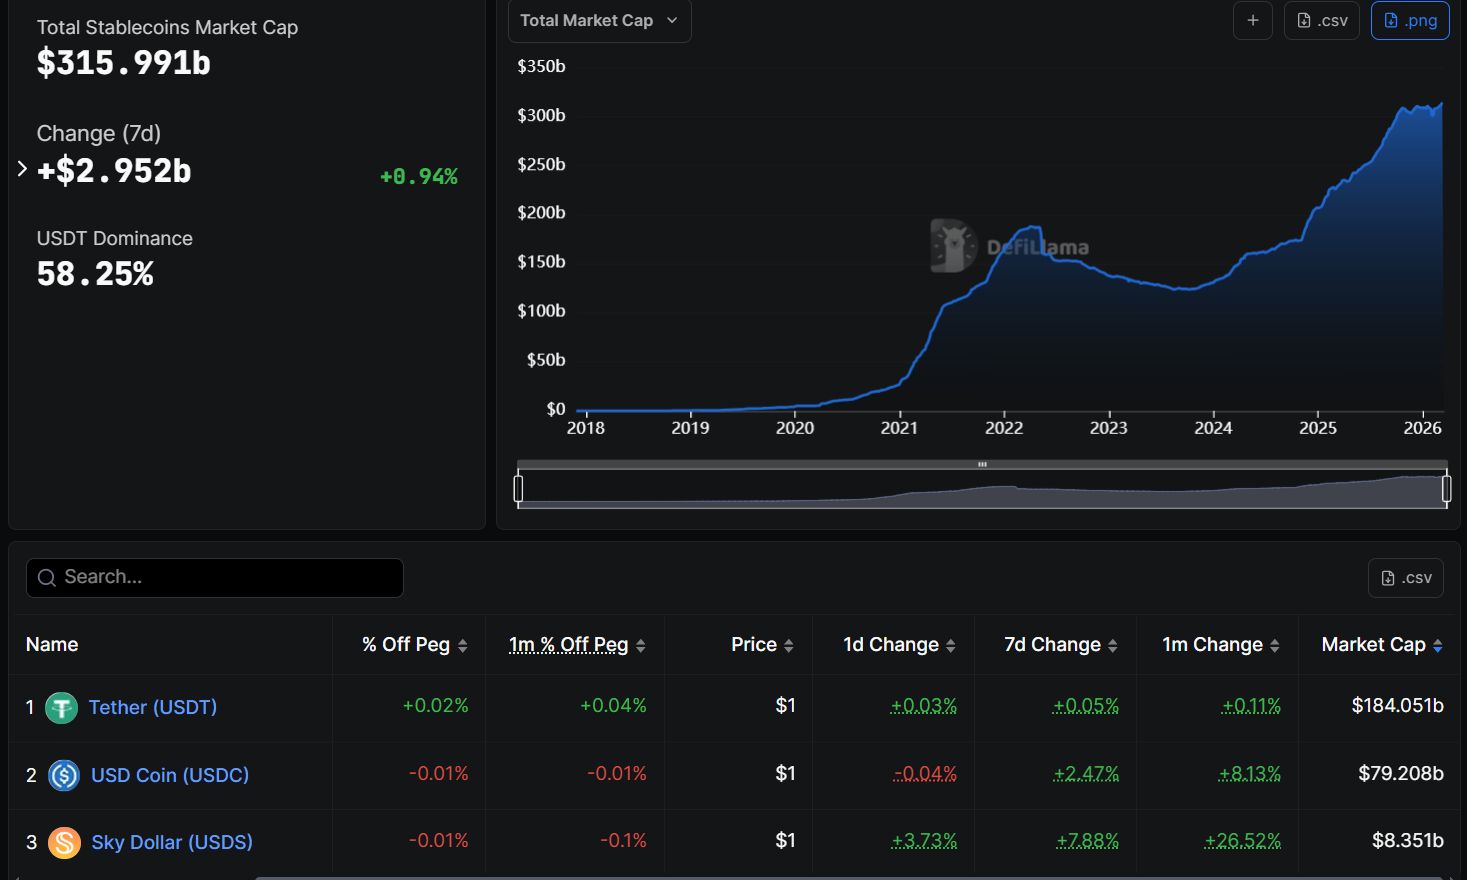
(Source: DeFiLlama)
Mizuho defines “adjusted trading volume” as transactions involving centralized exchanges, decentralized exchanges, and other identified entities—representing genuine value transfer rather than digital activity generated by automation or repetitive actions. This metric better reflects actual demand, and on this basis, USDC’s performance has completely overturned historical patterns:
Between 2019 and 2025, USDT dominated adjusted trading volume, with USDC averaging only about 30%; but in 2026 so far, this ratio has reversed to 64% for USDC and 36% for USDT.
Mizuho analysts Dan Dolev and Alexander Jenkins note in their report that when predicting the long-term winners among stablecoins, adjusted trading volume may be more important than market cap—this directly supports their decision to raise Circle’s stock target price from $100 to $120, citing USDC’s expanding influence in emerging applications such as prediction markets and AI-driven commercial services.
Market Share Overtakes in Five Countries: Deepening Geographical Divide
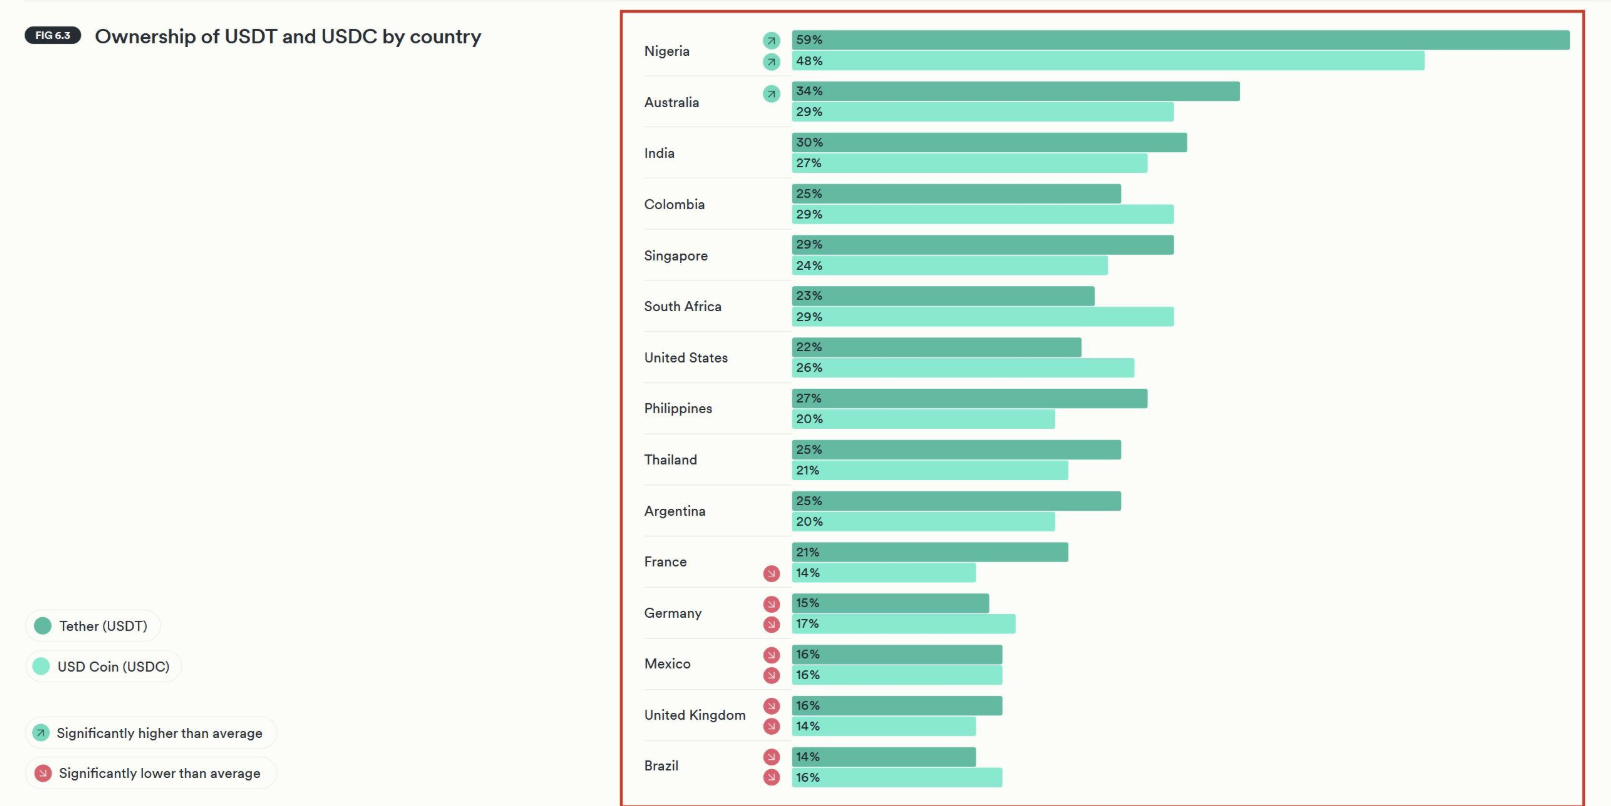
(Source: Leon)
BVNK’s “2026 Stablecoin Utility Report” compiles survey data from YouGov across 15 countries with 4,658 respondents, revealing a clear geographical split in the global stablecoin market:
Markets where USDT leads (often associated with currency instability or early crypto adoption):
Nigeria: USDT 59%, USDC 48%
India, Philippines, Singapore, Thailand, Argentina, France, UK: USDT leads in all
Markets where USDC has overtaken USDT (often associated with regulatory maturity):
Colombia: USDC 29% vs USDT 25%
South Africa: USDC 29% vs USDT 23%
United States: USDC 26% vs USDT 22%
Germany: USDC 17% vs USDT 15%
Brazil: USDC 16% vs USDT 14%
Lisk’s research director Leon Waidmann points out that this pattern reveals a deeper trend: “USDC is catching up. In Colombia, South Africa, the US, Germany, and Brazil, regulated stablecoins are on the rise.”
Differentiated Regulatory Strategies: Two Giants on Different Tracks
Behind these figures are starkly different strategic choices by USDT (Tether) and USDC (Circle). Circle’s USDC holds regulatory approval under European crypto asset regulation (MiCA) and complies with the U.S. GENIUS Act framework—giving it a natural advantage in the more regulated Western markets.
Tether, on the other hand, chooses not to comply with MiCA regulations, focusing growth efforts on Asia and other non-Western markets. This strategy allows it to maintain a strong presence in Nigeria (USDT 59%), India, and Southeast Asia, where adoption is driven more by the need to hedge against local currency devaluation than by regulatory compliance considerations.
Frequently Asked Questions
Q: Does the fact that USDC’s adjusted trading volume surpasses USDT mean USDC has “won” the stablecoin race?
A: Not necessarily. USDT’s market cap is about $184 billion, still more than double USDC’s approximately $81 billion, and its adoption in high-growth markets like Nigeria, Southeast Asia, and across Asia remains significantly higher. A more accurate view is that the stablecoin market is splitting geographically and by use case—USDC leads in regulated Western markets and trading volume, while USDT remains dominant in emerging markets and in total holdings.
Q: Why does USDC hold a larger share in the US than USDT?
A: This mainly reflects the preferences of institutional and regulated users. USDC fully complies with U.S. regulations and is heavily promoted by mainstream platforms like Coinbase, being widely used in DeFi and traditional finance integrations. Although USDT has a lead among retail and emerging market users globally, its adoption among U.S. institutions is comparatively lower.
Q: Is the surge in USDC demand in the Middle East sustainable?
A: Dubai analysts note that some of this demand stems from capital flight caused by the decline in Dubai’s real estate market (DFM real estate index down about 31% from recent highs), with investors turning to USDC as a digital dollar alternative. The sustainability of this trend depends on the recovery speed of Dubai’s real estate sector and broader geopolitical factors, but overall, the long-term trend of digital dollars replacing traditional dollar accounts may continue.
Disclaimer: The information on this page may come from third parties and does not represent the views or opinions of Gate. The content displayed on this page is for reference only and does not constitute any financial, investment, or legal advice. Gate does not guarantee the accuracy or completeness of the information and shall not be liable for any losses arising from the use of this information. Virtual asset investments carry high risks and are subject to significant price volatility. You may lose all of your invested principal. Please fully understand the relevant risks and make prudent decisions based on your own financial situation and risk tolerance. For details, please refer to
Disclaimer.
