
Pi Network (PI) tokens declined for four consecutive trading days, closing at $0.1955 on Monday. Last week, Pi developers launched on-chain smart contracts with the v20 node upgrade and announced plans for a second mainnet migration. Technically, PI’s price is currently stable near the 50-day EMA and the 61.8% Fibonacci retracement level, a position historically associated with technical rebounds.
Significance of the Smart Contract Launch and Second Migration
Pi Network’s roadmap is progressing as planned, with two recent major updates serving as key indicators of the project’s medium- to long-term fundamentals:
Smart Contract Launch (v20 upgrade): The v20 node upgrade enables developers to deploy smart contracts on the Pi Network blockchain, facilitating the development of decentralized applications (dApps) across DeFi, NFTs, and on-chain gaming. As subsequent phases like v23 advance, smart contract capabilities will continue to improve. Notably, developers have revealed active efforts to build decentralized exchanges (DEX) and automated market maker (AMM) tools, and the token issuance platform’s testnet has already been initiated.
Second Migration: This migration offers early participants the opportunity to bring more tokens onto the mainnet and includes a referral reward mechanism for members who have completed KYC, helping to further expand the active user base of the mainnet.
Current key developments in the Pi Network ecosystem include:
Smart Contracts: v20 upgrade completed, supporting DeFi, NFTs, and dApp development
DEX/AMM: Under active development; token issuance platform testnet launched
Second Migration: Open for incremental migration of early participants to the mainnet, with KYC referral rewards
Whale Activity: The largest whale bought 282,000 PI on Monday, bringing total holdings to 398.3 million PI
Technical Analysis: Fibonacci Support and Potential Rebound Structure
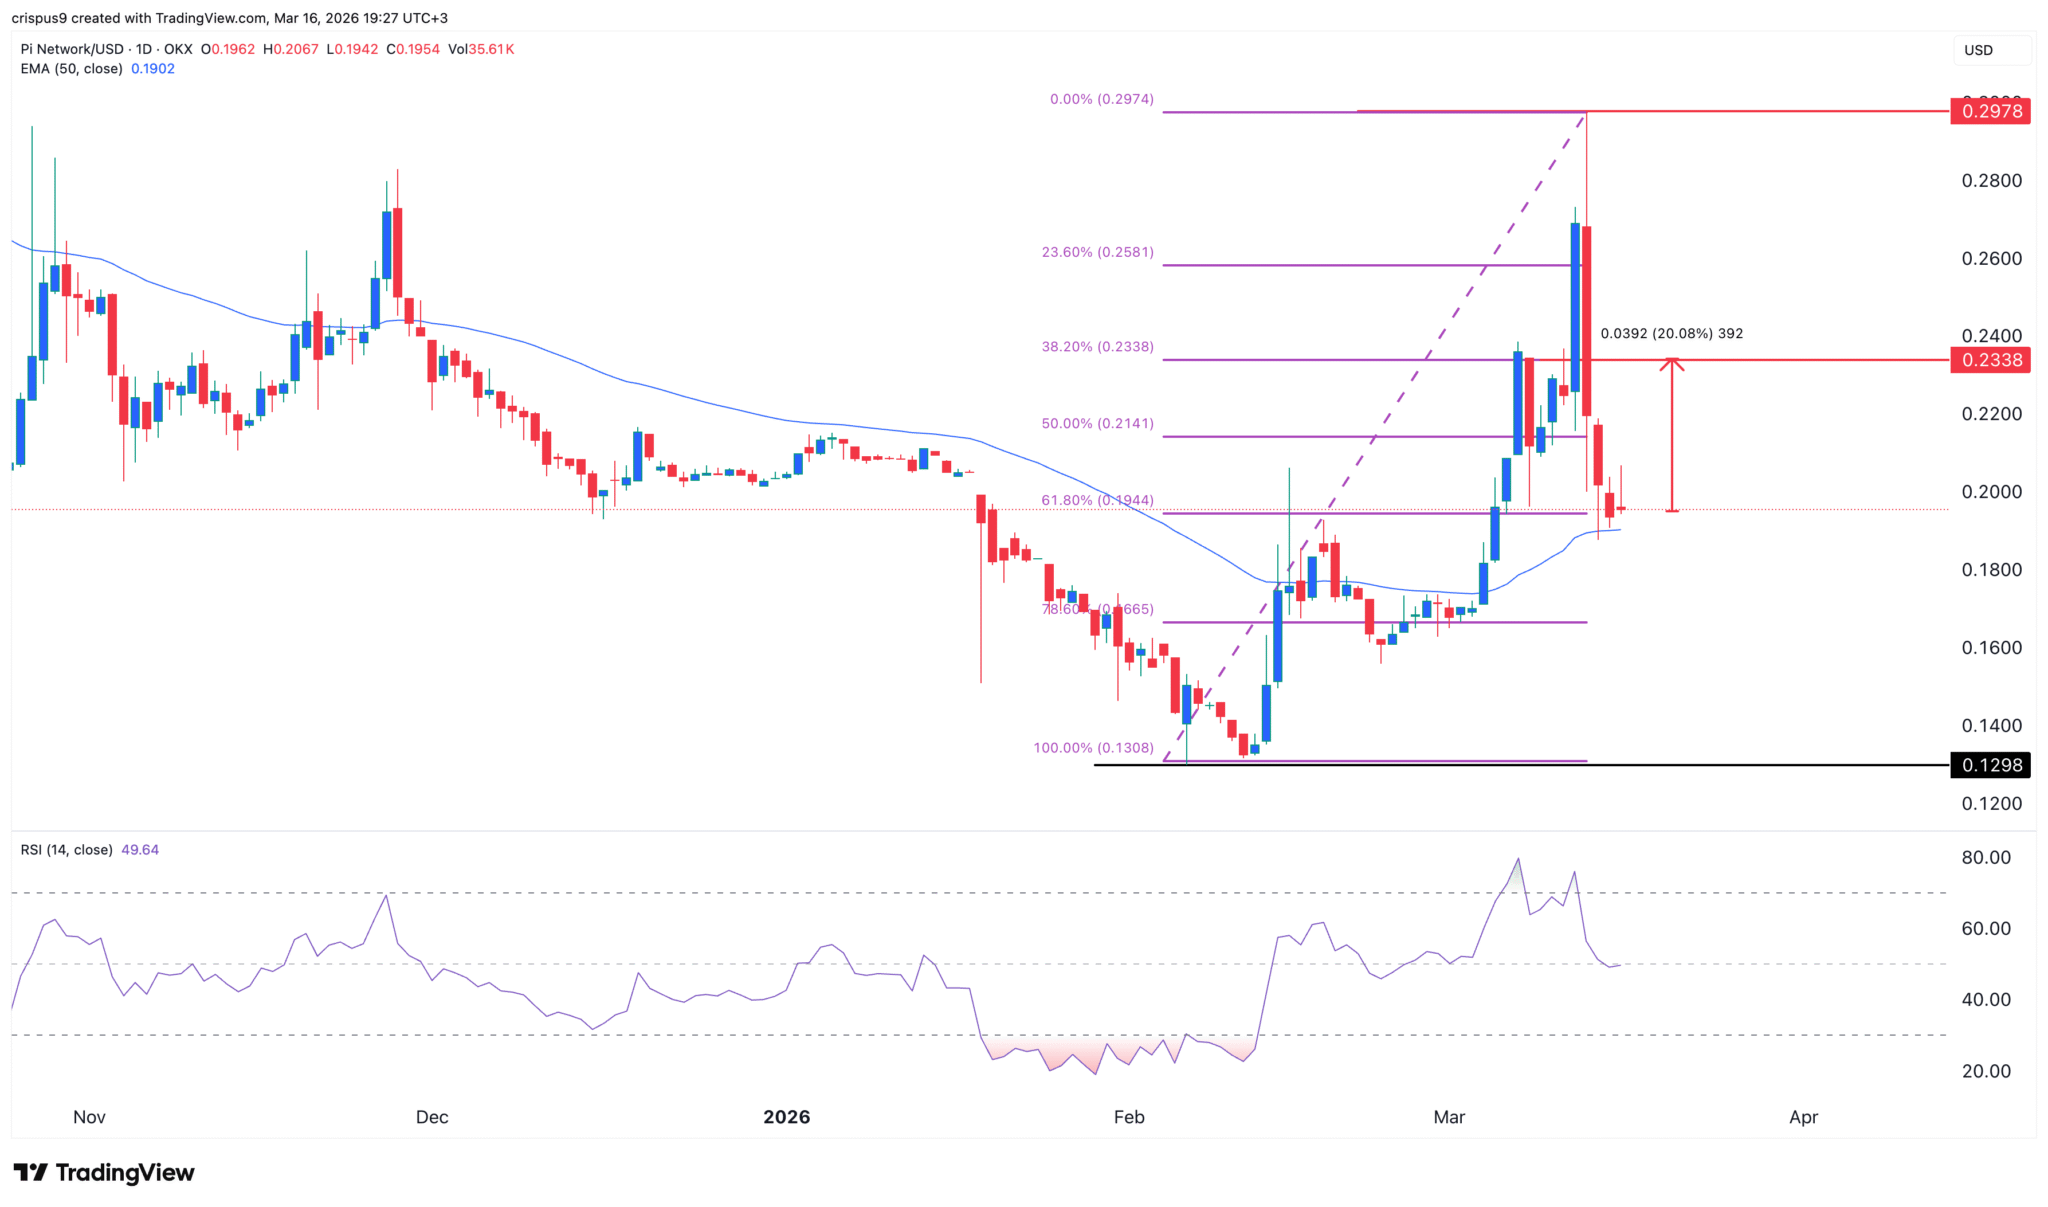 (Source: Trading View)
On the daily chart, Pi Network has fallen from last week’s high of $0.2978 to the current $0.1955, a move typical of “profit-taking” after Kraken listing. The core technical observations are as follows:
Current Support Level: PI’s price is stable near the 61.8% Fibonacci retracement, which connects this year’s high and low, and closely overlaps with the 50-day exponential moving average (EMA). When an asset is supported by both a key moving average and a golden retracement level, the technical conditions for a rebound are relatively favorable.
Bullish Scenario Target: If support holds and buying momentum resumes, the initial rebound target indicated by technical analysis is $0.2340 (38.2% Fibonacci retracement), representing approximately 20% upside from current levels.
Bearish Risk: If the critical support at $0.1800 is broken, the current bullish technical structure will be invalidated, requiring reassessment of the downside potential.
Frequently Asked Questions
Why is the smart contract launch on Pi Network significant for PI token’s price?
Before the smart contract launch, Pi Network was mainly a large user base public chain lacking on-chain ecosystem activity. The introduction of smart contracts allows third-party developers to build DeFi protocols, NFT platforms, and gaming applications on Pi Network, which is a core driver for real demand for the token (as gas fees and ecosystem medium). If the ecosystem attracts enough dApps, the demand for PI tokens will upgrade from “community tokens” to “ecosystem tokens” with actual use cases.
Does the “profit-taking sell-off” phenomenon indicate deteriorating fundamentals for Pi Network?
Not necessarily. Profit-taking is a common short-term market behavior rather than a fundamental negative signal. Kraken listing and Pi Day are just specific triggers; some short-term investors take profits during such events, which is normal. When assessing fundamentals, more important indicators are the actual ecosystem activity after the smart contract launch, the number of developers, and the usage of dApps.
Why is the 61.8% Fibonacci retracement level considered a key support by technical analysts?
The 61.8% Fibonacci retracement (the golden ratio) is one of the most widely used support/resistance levels in technical analysis, based on the mathematical golden ratio’s statistical appearance in market behavior. When an asset bottoms or slows down at this level during a decline, it is often interpreted as the market digesting previous gains, with potential accumulation and support forming at this point.
Disclaimer: The information on this page may come from third parties and does not represent the views or opinions of Gate. The content displayed on this page is for reference only and does not constitute any financial, investment, or legal advice. Gate does not guarantee the accuracy or completeness of the information and shall not be liable for any losses arising from the use of this information. Virtual asset investments carry high risks and are subject to significant price volatility. You may lose all of your invested principal. Please fully understand the relevant risks and make prudent decisions based on your own financial situation and risk tolerance. For details, please refer to
Disclaimer.
