Ripple (XRP) is increasing selling pressure as it slips below the critical level of $1.40, trading around $1.37 at the time of recording on Friday. This movement extends the correction since the weekly peak of $1.61 set on March 17, reflecting a clear weakening trend. At the same time, XRP is not exempt from the widespread sell-off sweeping across the cryptocurrency market, amid macroeconomic instability and escalating geopolitical tensions, particularly in the Middle East.
XRP records light capital inflow amid prolonged risk-averse sentiment
Interest in investment products linked to XRP remains fragile, clearly reflected in the inflows into spot ETF funds. Although there have been consecutive increases in recent days, the scale of capital inflow remains modest, reaching only $1.12 million on Wednesday and $1.4 million on Tuesday.
Previously, the market was almost “frozen” on Monday with no new capital inflows recorded. Data from SoSoValue shows that in the previous week, there were only two sessions with inflows, with ETFs listed in the U.S. attracting $1.98 million on Friday and approximately $5 million on the session of March 17.
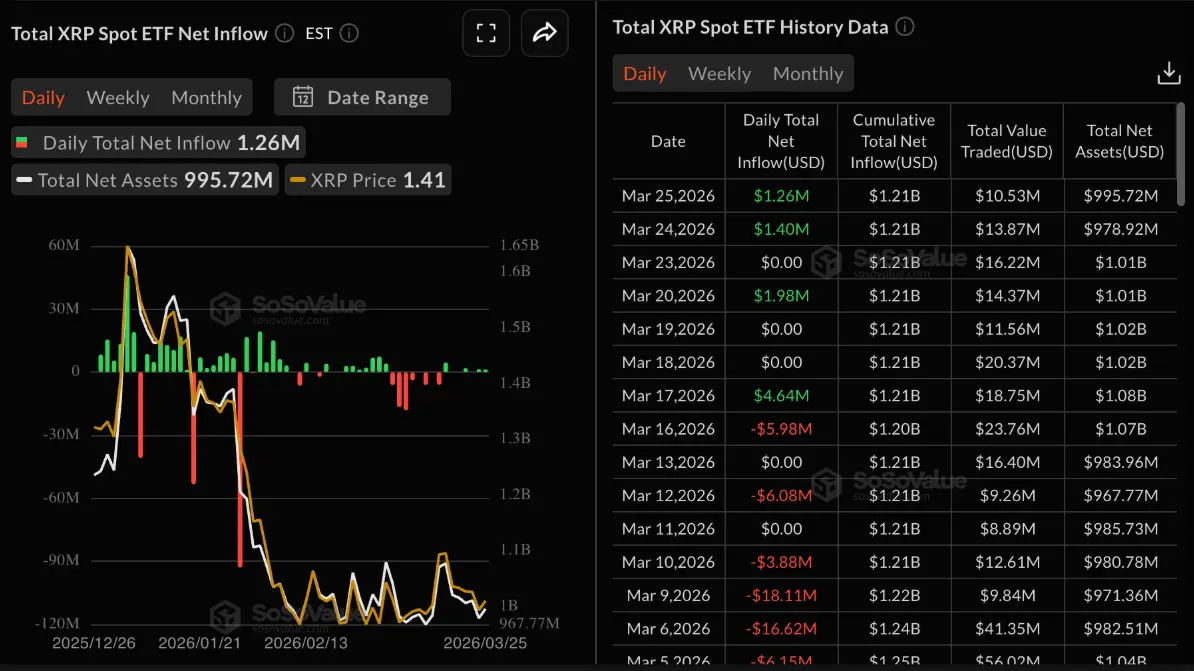 XRP ETF inflows | Source: SoSoValueThe declining pressure is also evident in the assets under management (AUM), which have fallen back to around $996 million, a significant decrease from $1.65 billion at the beginning of the year. Meanwhile, the total cumulative inflow remains around the average of $1.21 billion.
This trend reflects that risk-averse sentiment continues to dominate, suggesting that investor confidence in XRP’s ability to recover and maintain upward momentum is limited. If this trend persists, any rebounds are likely to be absorbed by increased supply pressure as investors actively lower their risk levels.
Technical outlook: XRP bears continue to dominate
The bears are in control, pulling the price of XRP down to $1.37 at the time of recording. In the short term, the trend remains bearish as the price continues to adjust from the nearest peak around $1.54 and stays below the 50, 100, and 200-day EMA lines — which currently converge above the $1.48 mark, reinforcing general downward pressure.
Breaking below the uptrend line from $1.12 indicates that buying strength has significantly weakened following a strong rally in mid-month. Additionally, the MACD indicator on the daily frame has crossed below the signal line, confirming that the upward momentum is fading, while the RSI has retreated to around 43, below the neutral threshold of 50, continuing to reflect a negative market state.
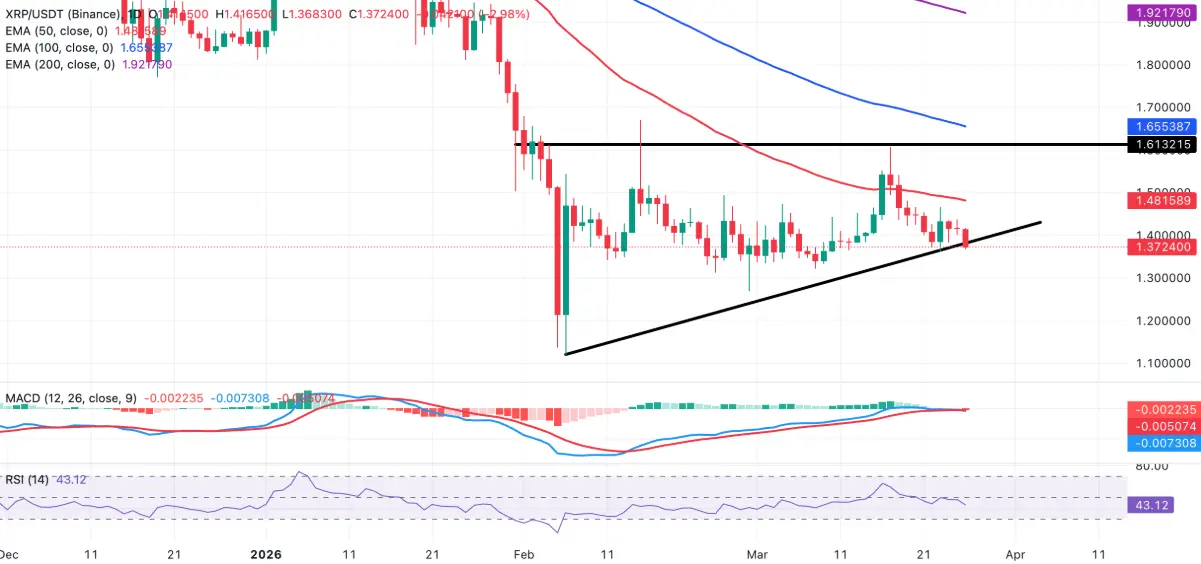 XRP/USDT daily chart | Source: TradingViewOn the upside, the nearest resistance level is at $1.40 and the supply zone at $1.43 — where recent rebounds have consistently been blocked. Further out, the 50-day EMA at $1.48 serves as an important barrier before the price can aim for the $1.54 area. If a successful breakout occurs, the next target will be the 100-day EMA at $1.66.
Conversely, the nearest support zone is identified at the weekly low of $1.36. Once this level is clearly breached, the price is likely to continue retreating to test the next important demand zone around $1.32.
SN_Nour
Disclaimer: The information on this page may come from third parties and does not represent the views or opinions of Gate. The content displayed on this page is for reference only and does not constitute any financial, investment, or legal advice. Gate does not guarantee the accuracy or completeness of the information and shall not be liable for any losses arising from the use of this information. Virtual asset investments carry high risks and are subject to significant price volatility. You may lose all of your invested principal. Please fully understand the relevant risks and make prudent decisions based on your own financial situation and risk tolerance. For details, please refer to
Disclaimer.
