Trade
Basic
Futures
Futures
Hundreds of contracts settled in USDT or BTC
Options
HOT
Trade European-style vanilla options
Unified Account
Maximize your capital efficiency
Demo Trading
Futures Kickoff
Get prepared for your futures trading
Futures Events
Participate in events to win generous rewards
Demo Trading
Use virtual funds to experience risk-free trading
Earn
Launch
CandyDrop
Collect candies to earn airdrops
Launchpool
Quick staking, earn potential new tokens
HODLer Airdrop
Hold GT and get massive airdrops for free
Launchpad
Be early to the next big token project
Alpha Points
NEW
Trade on-chain assets and enjoy airdrop rewards!
Futures Points
NEW
Earn futures points and claim airdrop rewards
Investment
Simple Earn
Earn interests with idle tokens
Auto-Invest
Auto-invest on a regular basis
Dual Investment
Buy low and sell high to take profits from price fluctuations
Soft Staking
Earn rewards with flexible staking
Crypto Loan
0 Fees
Pledge one crypto to borrow another
Lending Center
One-stop lending hub
VIP Wealth Hub
Customized wealth management empowers your assets growth
Private Wealth Management
Customized asset management to grow your digital assets
Quant Fund
Top asset management team helps you profit without hassle
Staking
Stake cryptos to earn in PoS products
Smart Leverage
NEW
No forced liquidation before maturity, worry-free leveraged gains
GUSD Minting
Use USDT/USDC to mint GUSD for treasury-level yields
More
ChiefOfStaffOfCrypto
No content yet
ChiefOfStaffOfCrypto
📣1/7 Ethereum Trend Detailed Analysis and Steady Operation Recommendations:
Ethereum is currently in a high-level oscillation with a slight bullish bias on the 4-hour chart, with the core range between 3200-3300. Short-term bullish momentum is weakening, facing a need for a pullback to gather strength. Key support levels are at 3180-3200, and resistance is at 3300. Yesterday and midday, multiple profitable short positions were executed!
Analyzing the 4-hour Ethereum price trend, recent candlesticks show oscillation within the 3200-3300 range, forming long upper and lower shadows, indicating
ETH-4,19%

- Reward
- 2
- 1
- Repost
- Share
ZhannaSushko :
:
Thank you for the information provided 👋📣1/6 Ethereum Trend Detailed Analysis and Trading Recommendations:
The four-hour chart for Ethereum shows a pattern of "rising sharply then pulling back + narrow-range consolidation." The current price is around 3290. The bullish structure has not been broken, but momentum is waning. In the short term, the market is mainly consolidating and building up strength. Attention should be paid to volume and whether key levels are broken or held.
From the four-hour trend analysis, recent candlesticks show an upward oscillation with multiple consecutive bullish candles, indicating strong upward mome
View OriginalThe four-hour chart for Ethereum shows a pattern of "rising sharply then pulling back + narrow-range consolidation." The current price is around 3290. The bullish structure has not been broken, but momentum is waning. In the short term, the market is mainly consolidating and building up strength. Attention should be paid to volume and whether key levels are broken or held.
From the four-hour trend analysis, recent candlesticks show an upward oscillation with multiple consecutive bullish candles, indicating strong upward mome

- Reward
- like
- Comment
- Repost
- Share
📣1/5 Ethereum Trend Detailed Analysis and Steady Operation Strategy Sharing:
Ethereum's four-hour chart shows an overall bullish structure but with waning momentum, oscillating at a high range between 3100-3200. The area above 3200-3250 acts as strong resistance, while 3100-3080 serves as a short-term key support. There are two possible scenarios: a pullback to gather strength before pushing higher or encountering resistance and falling back. Recently, trading volume in the past few four-hour periods has decreased, so caution is advised regarding the risk of momentum exhaustion.
Analyzing
ETH-4,19%

- Reward
- 7
- 2
- Repost
- Share
DSYGX :
:
2026 Go Go Go 👊View More
📣1/1 Ethereum Trend Analysis and Strategy Sharing:
Goodbye 2025. This year had its joys and sorrows, successes and setbacks, but thankfully all are behind us. Looking forward to a better 2026. The Chief Strategist here wishes everyone good health, smooth sailing, and more USDT profits.
Ethereum’s 4-hour chart shows narrow-range consolidation with a balanced battle between bulls and bears. The price fluctuates around 2970, with a clear resistance at the 3000 level and strong support at the 2900 level, awaiting a breakout signal to confirm the direction. Recently, 4-hour candles alternate betwe
View OriginalGoodbye 2025. This year had its joys and sorrows, successes and setbacks, but thankfully all are behind us. Looking forward to a better 2026. The Chief Strategist here wishes everyone good health, smooth sailing, and more USDT profits.
Ethereum’s 4-hour chart shows narrow-range consolidation with a balanced battle between bulls and bears. The price fluctuates around 2970, with a clear resistance at the 3000 level and strong support at the 2900 level, awaiting a breakout signal to confirm the direction. Recently, 4-hour candles alternate betwe

- Reward
- 3
- Comment
- Repost
- Share
📣December 31 Ethereum Trend Detailed Analysis and Steady Strategy Sharing:
Yesterday, the Ethereum long positions at 2950-2960 were perfectly exited with profits. The 4-hour chart shows a weak oscillation, with prices trading between $2940 and $2980. Moving averages are intertwined, indicators are neutral, and volume is insufficient. As liquidity tends to be lower at year-end, the risk of a false breakout increases. Historically, Ethereum tends to rise around New Year’s, and this time should be no exception.
From the 4-hour trend analysis, recent candlesticks show an oscillating upward trend,
ETH-4,19%

- Reward
- like
- Comment
- Repost
- Share
📣12/30 Ethereum Trend Detailed Analysis and Steady Income Operation Recommendations:
Yesterday, Ethereum long positions closed profitably once again. Currently, Ethereum on the 4-hour chart shows a narrow range of weak consolidation, with prices oscillating between 2930 and 2970. Key resistance levels are at 2980–3000 USD, and critical support levels are at 2900–2908. During the New Year holiday, volatility is expected to be higher, so please pay attention to your positions.
From the 4-hour trend analysis, recent candlesticks show significant fluctuations, with a high of 3057.78 before pullin
View OriginalYesterday, Ethereum long positions closed profitably once again. Currently, Ethereum on the 4-hour chart shows a narrow range of weak consolidation, with prices oscillating between 2930 and 2970. Key resistance levels are at 2980–3000 USD, and critical support levels are at 2900–2908. During the New Year holiday, volatility is expected to be higher, so please pay attention to your positions.
From the 4-hour trend analysis, recent candlesticks show significant fluctuations, with a high of 3057.78 before pullin

- Reward
- 4
- Comment
- Repost
- Share
📣12/29 Ethereum Trend Detailed Analysis and Steady Strategy Layout Sharing:
Yesterday, Ethereum short positions closed with profits again. Currently, the four-hour chart shows a sideways to bullish pattern with limited bullish momentum, facing key resistance and support levels. Holiday liquidity is relatively weak, amplifying short-term volatility risks. Overall, it is in a range decision window.
Analyzing the four-hour Ethereum price trend, in recent four-hour cycles, the price has shown a rebound and pullback pattern, with highs around 3056 failing to break through, followed by oscillatio
ETH-4,19%

- Reward
- 2
- Comment
- Repost
- Share
📣12/28 Ethereum Trend Detailed Analysis and Steady Income Operation Recommendations:
The four-hour Ethereum chart shows a weak oscillation pattern, with the price around $2950, in a core range of $2900-$2970. Both bulls and bears lack momentum, mainly consolidating within the range. A breakout requires increased volume and a clear direction.
The core price and key levels are currently around $2950, with daily fluctuations of approximately ±1.6%. Trading is light, with the support level at the psychological barrier of $2900 and multiple tests. If broken, the next support is at $2850-
ETH-4,19%

- Reward
- like
- Comment
- Repost
- Share
📣12/26 Ethereum Trend Detailed Analysis and Trading Recommendations:
Ethereum today once again touched around 2890 and rebounded. From the four-hour trend chart, it has now touched this level four consecutive times. Current trading should focus on the 2890 level. If the trend breaks below 2890, further correction is likely.
Based on the four-hour Ethereum price trend analysis, recent candlestick prices have been oscillating between 2900-3000, showing a generally weak consolidation pattern. On the daily chart, December 23 and 24 closed with consecutive bearish candles, accompanied by long uppe
ETH-4,19%

- Reward
- like
- Comment
- Repost
- Share
📣12/24 Ethereum Trend Detailed Analysis and Steady Income Strategy Sharing:
Yesterday's short-term gains were expected, but from the trend perspective, Ethereum's movement is relatively weak. This week coincides with Christmas, and the market is expected to be relatively quiet, likely not stirring up much volatility. If you want to trade, you can take a small position for short-term gains; if not, taking a break is also good. After Christmas, the market may become clearer. Today is Christmas Eve, wishing everyone a Merry Christmas Eve!
Based on the four-hour price trend analysis of Ethereum
ETH-4,19%

- Reward
- like
- Comment
- Repost
- Share
📣Detailed analysis and trading suggestions for the Ethereum market trend on 12/23:
Ethereum quickly fell back 100 points after reaching a high, and the market has entered a state of high anxiety, with continuous tug-of-war between bulls and bears testing each other. The overall market during the day is under pressure and running downward, with Ether synchronously declining to a low of around 2945.
From the four-hour Ethereum price trend analysis, the K-line has recently formed a range around 3000, with a long upper shadow appearing on December 22, indicating significant selling pressure at hi
ETH-4,19%

- Reward
- like
- Comment
- Repost
- Share
📣12/22 Ethereum market detailed analysis and operational advice sharing:
Currently, the trend shows that Ethereum is facing resistance around 3060, and a short-term pullback may occur.
From the four-hour Ethereum price trend analysis, the recent K-line prices show a fluctuating upward trend, with continuous bullish closes since December 19, especially after a significant rise on December 19 that formed a strong rebound. The current K-line is making slight adjustments at a high level, indicating that bullish forces still dominate, but it may face some pullback pressure in the short term. MACD:
ETH-4,19%

- Reward
- 1
- Comment
- Repost
- Share
📣Detailed analysis of Ethereum trend and operation suggestions sharing on the evening of 12/21:
During the day, there is basically no significant fluctuation. In the evening, after a trend correction back to around 2940, it just touches the four small mid-tracks and then rebounds. From the trend perspective, a short-term correction may still occur.
From the four-hour Ethereum price trend analysis, the recent candlestick chart shows a fluctuating downward trend, with the price gradually retreating from the high of 3020 on December 19 to the current 2968.51. There is a long upper shadow (like o
ETH-4,19%

- Reward
- like
- Comment
- Repost
- Share
📣11/19 Ethereum Trend Detailed Analysis and Trading Recommendations:
Ethereum's trend has been fluctuating, and many people have been feeling frustrated with this kind of movement lately. Slight inattention could turn profits into losses. Currently, although Ethereum has experienced multiple rebounds, the bearish trend has not yet changed.
Based on the four-hour Ethereum price trend analysis, the recent candlestick price moved quickly from the low of 2828.57 on December 18 to 2975.57, forming a strong bullish candle, indicating increased bullish momentum. After a significant decline on Decemb
ETH-4,19%

- Reward
- like
- Comment
- Repost
- Share
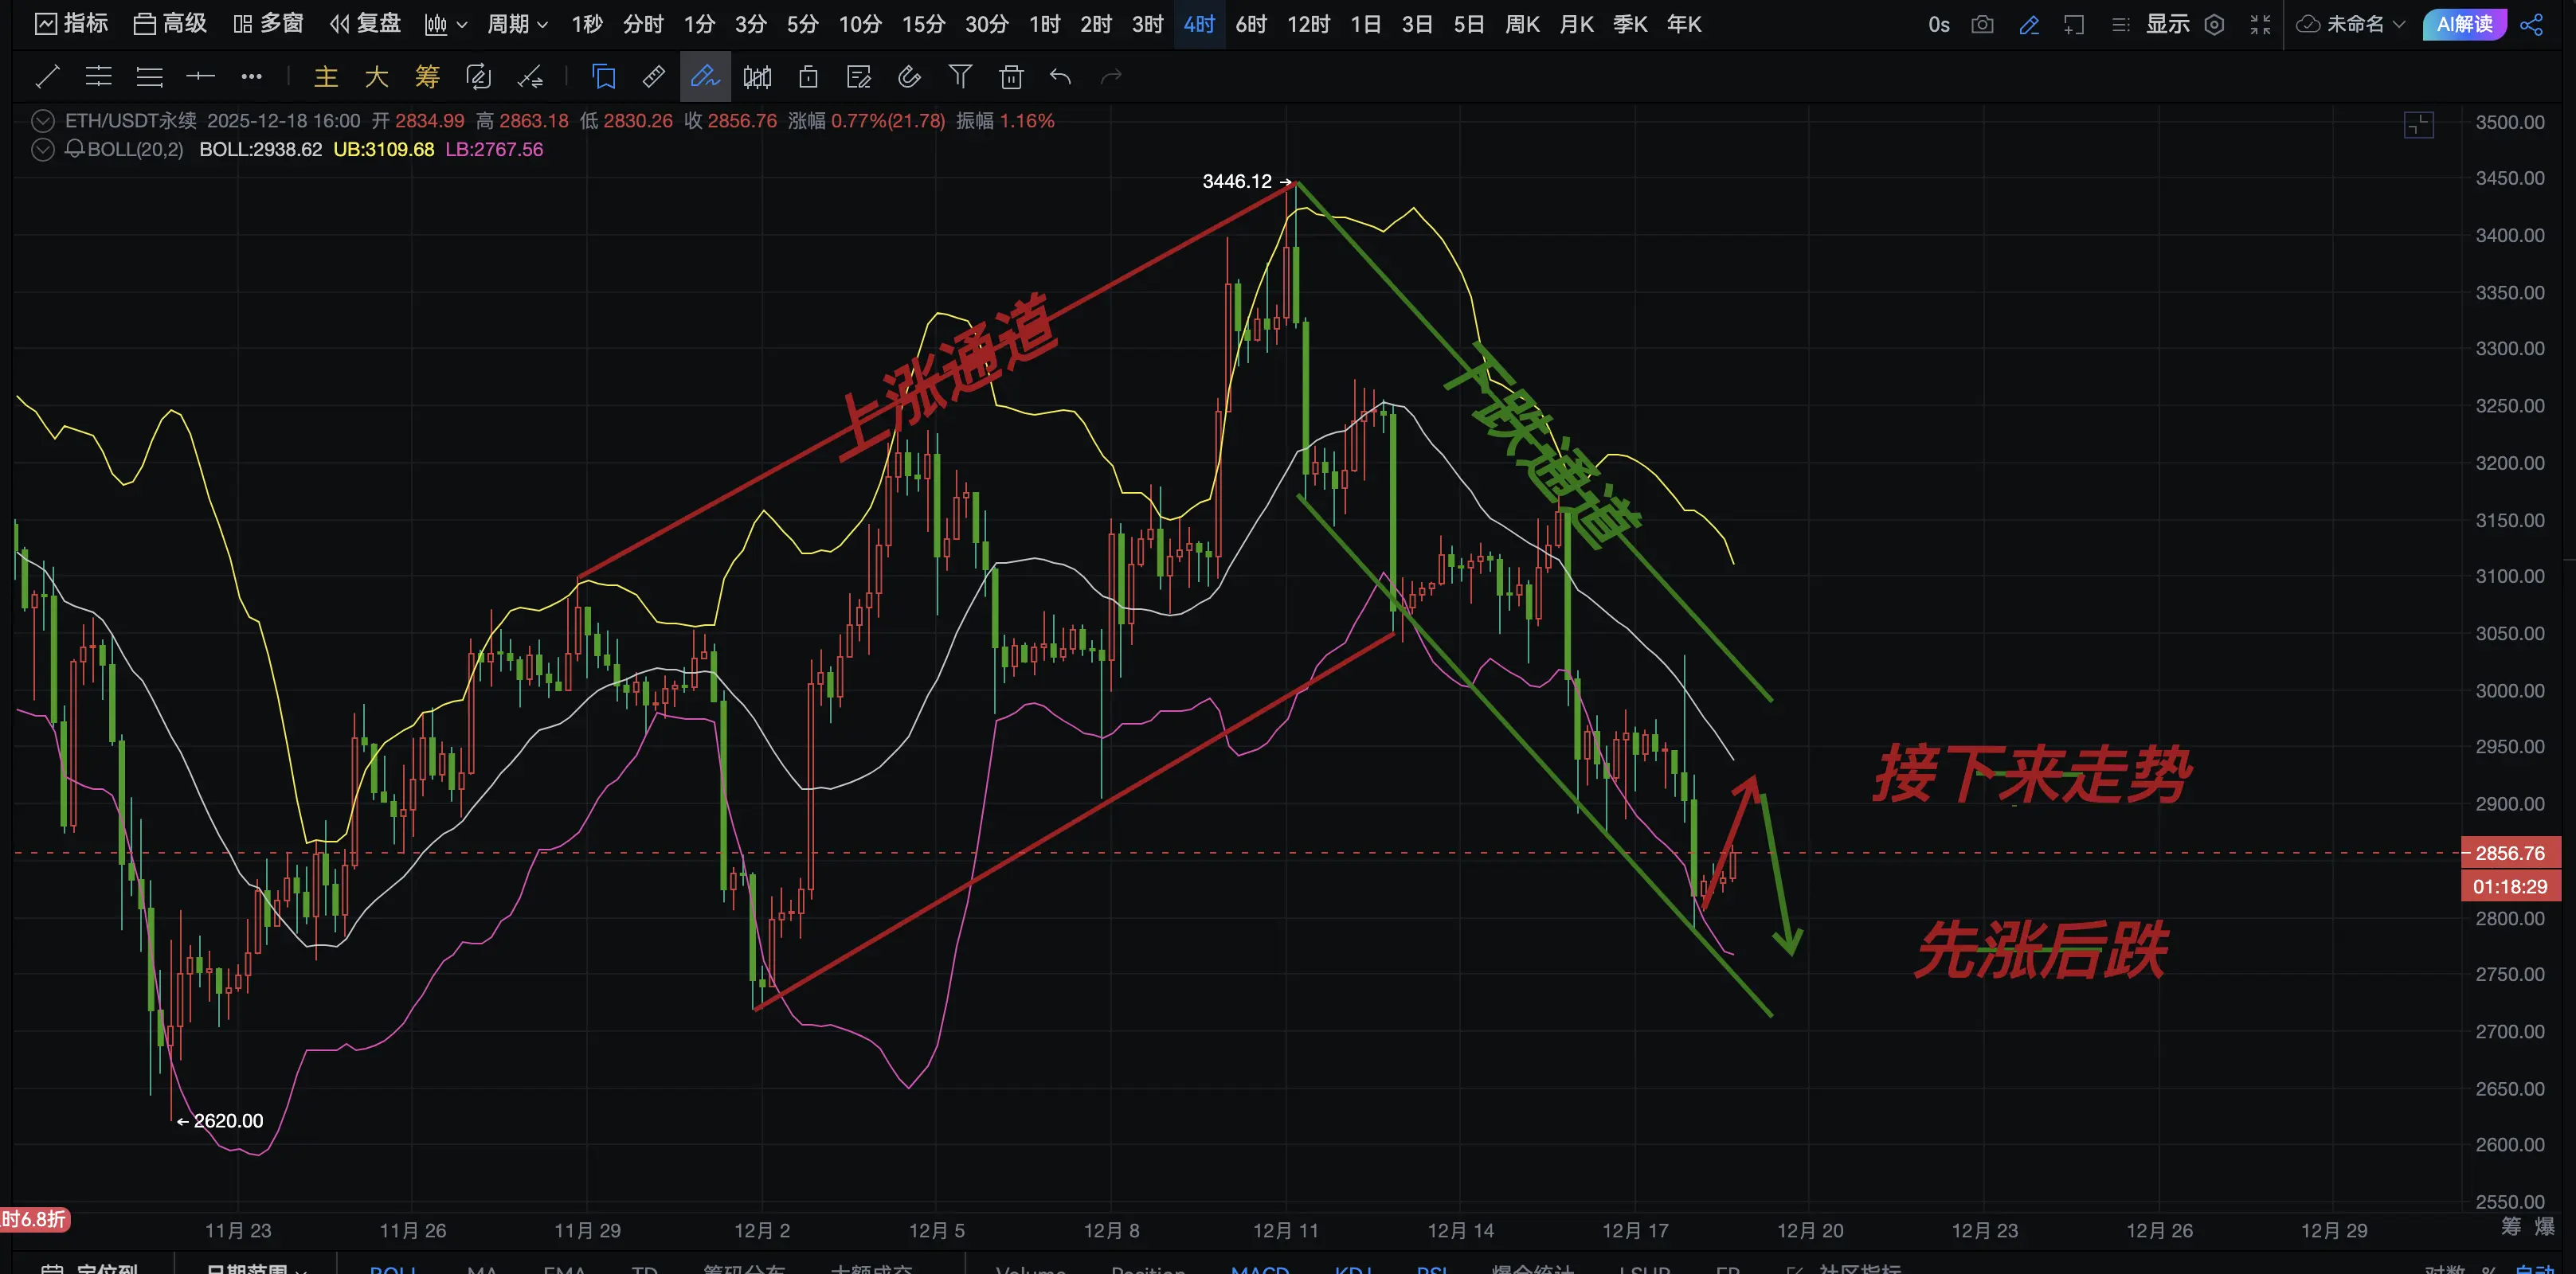
📣12/18 Ethereum Trend Analysis and Trading Recommendations:
Yesterday, I successfully secured profits from two consecutive short positions. I have emphasized for several days that Ethereum has shifted from an upward channel to a downward channel, with the lower side likely testing the previous low around 2710.
Based on the four-hour Ethereum price trend analysis, the recent candlestick pattern shows a oscillating downward trend, with continuous bearish closes since December 15 and significant volatility. On December 17, a long lower shadow appeared, indicating some buying support at low level
View OriginalYesterday, I successfully secured profits from two consecutive short positions. I have emphasized for several days that Ethereum has shifted from an upward channel to a downward channel, with the lower side likely testing the previous low around 2710.
Based on the four-hour Ethereum price trend analysis, the recent candlestick pattern shows a oscillating downward trend, with continuous bearish closes since December 15 and significant volatility. On December 17, a long lower shadow appeared, indicating some buying support at low level

- Reward
- like
- Comment
- Repost
- Share
📣12/17 Ethereum Trend Detailed Analysis and Steady Income Strategy Sharing:
Yesterday's short position was perfectly closed with profits. I emphasized yesterday that the current Ethereum trend has shifted from an upward channel to a downward channel. At present, Ethereum's trend remains relatively weak.
Based on the four-hour Ethereum price trend analysis, the recent candlestick prices show a oscillating downward trend. After a sharp decline on December 15, the price continued to retrace, but the rebound was weak. On the daily chart, there are consecutive bearish candles, and within the four-
View OriginalYesterday's short position was perfectly closed with profits. I emphasized yesterday that the current Ethereum trend has shifted from an upward channel to a downward channel. At present, Ethereum's trend remains relatively weak.
Based on the four-hour Ethereum price trend analysis, the recent candlestick prices show a oscillating downward trend. After a sharp decline on December 15, the price continued to retrace, but the rebound was weak. On the daily chart, there are consecutive bearish candles, and within the four-

- Reward
- like
- Comment
- Repost
- Share
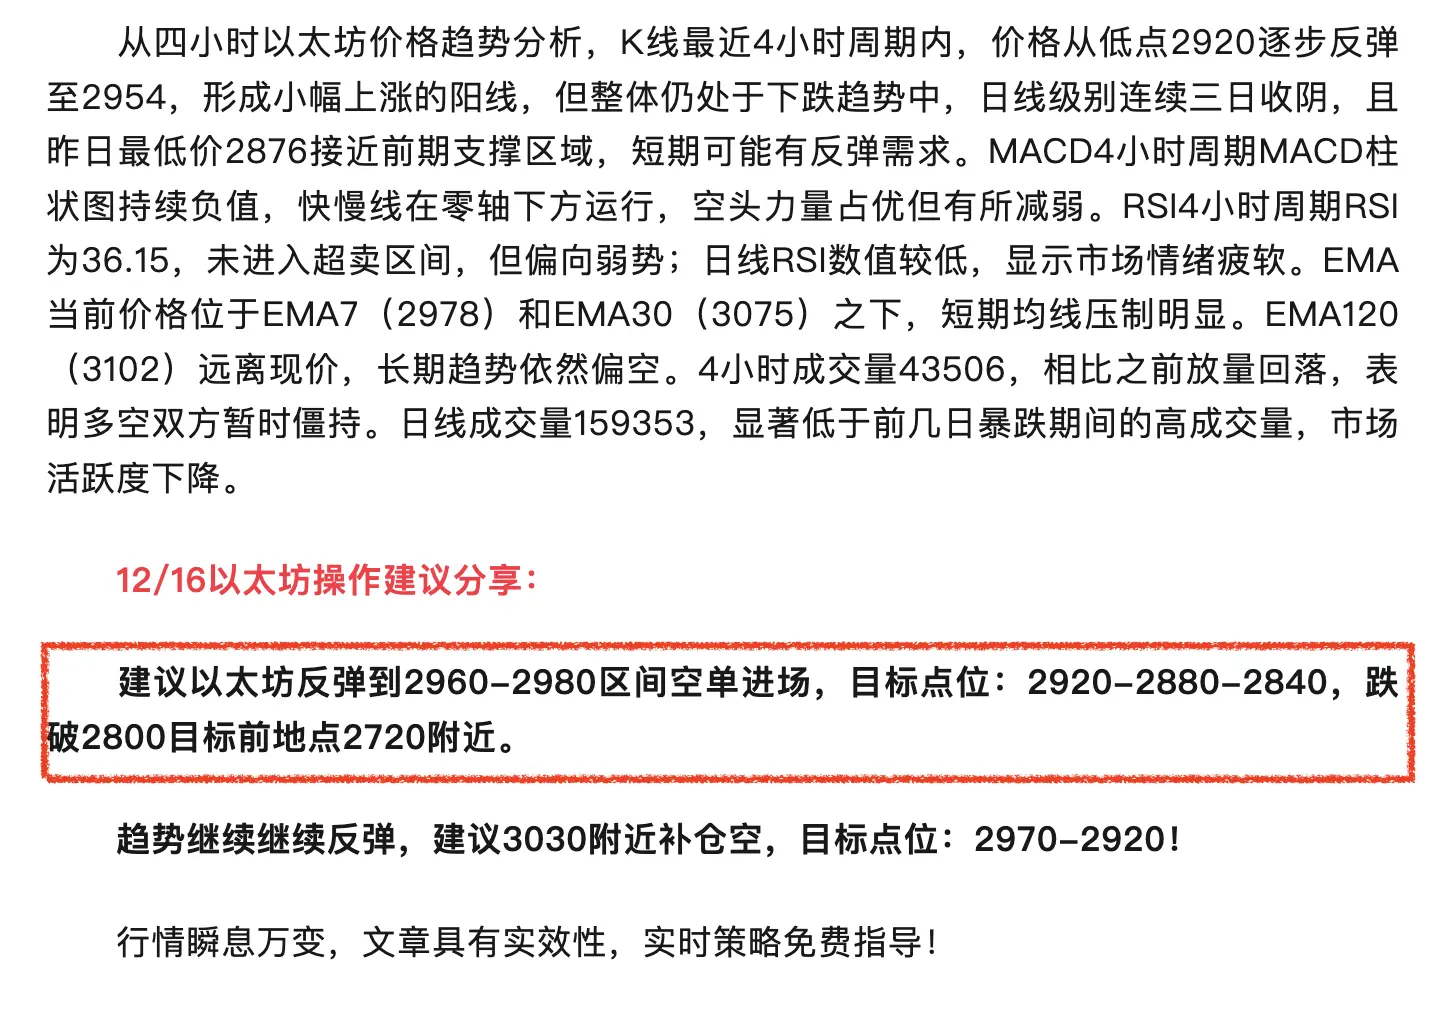
📣12/16 Ethereum Trend Detailed Analysis and Trading Recommendations:
As shown in the four-hour trend chart, currently Ethereum's movement has evolved from an upward channel into a downward channel. The current trend may see a pullback to test the previous low around 2720.
Based on the four-hour Ethereum price trend analysis, in the last 4-hour cycle, the price rebounded gradually from a low of 2920 to 2954, forming a small bullish candlestick, but overall it remains in a downtrend. The daily chart shows three consecutive days of bearish closes, and yesterday's low of 2876 approached th
View OriginalAs shown in the four-hour trend chart, currently Ethereum's movement has evolved from an upward channel into a downward channel. The current trend may see a pullback to test the previous low around 2720.
Based on the four-hour Ethereum price trend analysis, in the last 4-hour cycle, the price rebounded gradually from a low of 2920 to 2954, forming a small bullish candlestick, but overall it remains in a downtrend. The daily chart shows three consecutive days of bearish closes, and yesterday's low of 2876 approached th

- Reward
- like
- Comment
- Repost
- Share
📣12/14 Ethereum Trend Analysis and Trading Recommendations:
The overall trend on Saturday and Sunday was mainly sideways, so no specific trading advice was provided to allow everyone to spend quality time with family. Currently, Ethereum has broken below the 3100 level, with a low of 3148. Watch the four-hour Ethereum lower band for support!
Analyzing the four-hour Ethereum price trend, recent candles show consolidation after a sharp decline. On December 12, it plummeted to around 3050, forming a local low. Afterwards, it rebounded but failed to break previous highs. The current candles alt
View OriginalThe overall trend on Saturday and Sunday was mainly sideways, so no specific trading advice was provided to allow everyone to spend quality time with family. Currently, Ethereum has broken below the 3100 level, with a low of 3148. Watch the four-hour Ethereum lower band for support!
Analyzing the four-hour Ethereum price trend, recent candles show consolidation after a sharp decline. On December 12, it plummeted to around 3050, forming a local low. Afterwards, it rebounded but failed to break previous highs. The current candles alt

- Reward
- 1
- Comment
- Repost
- Share
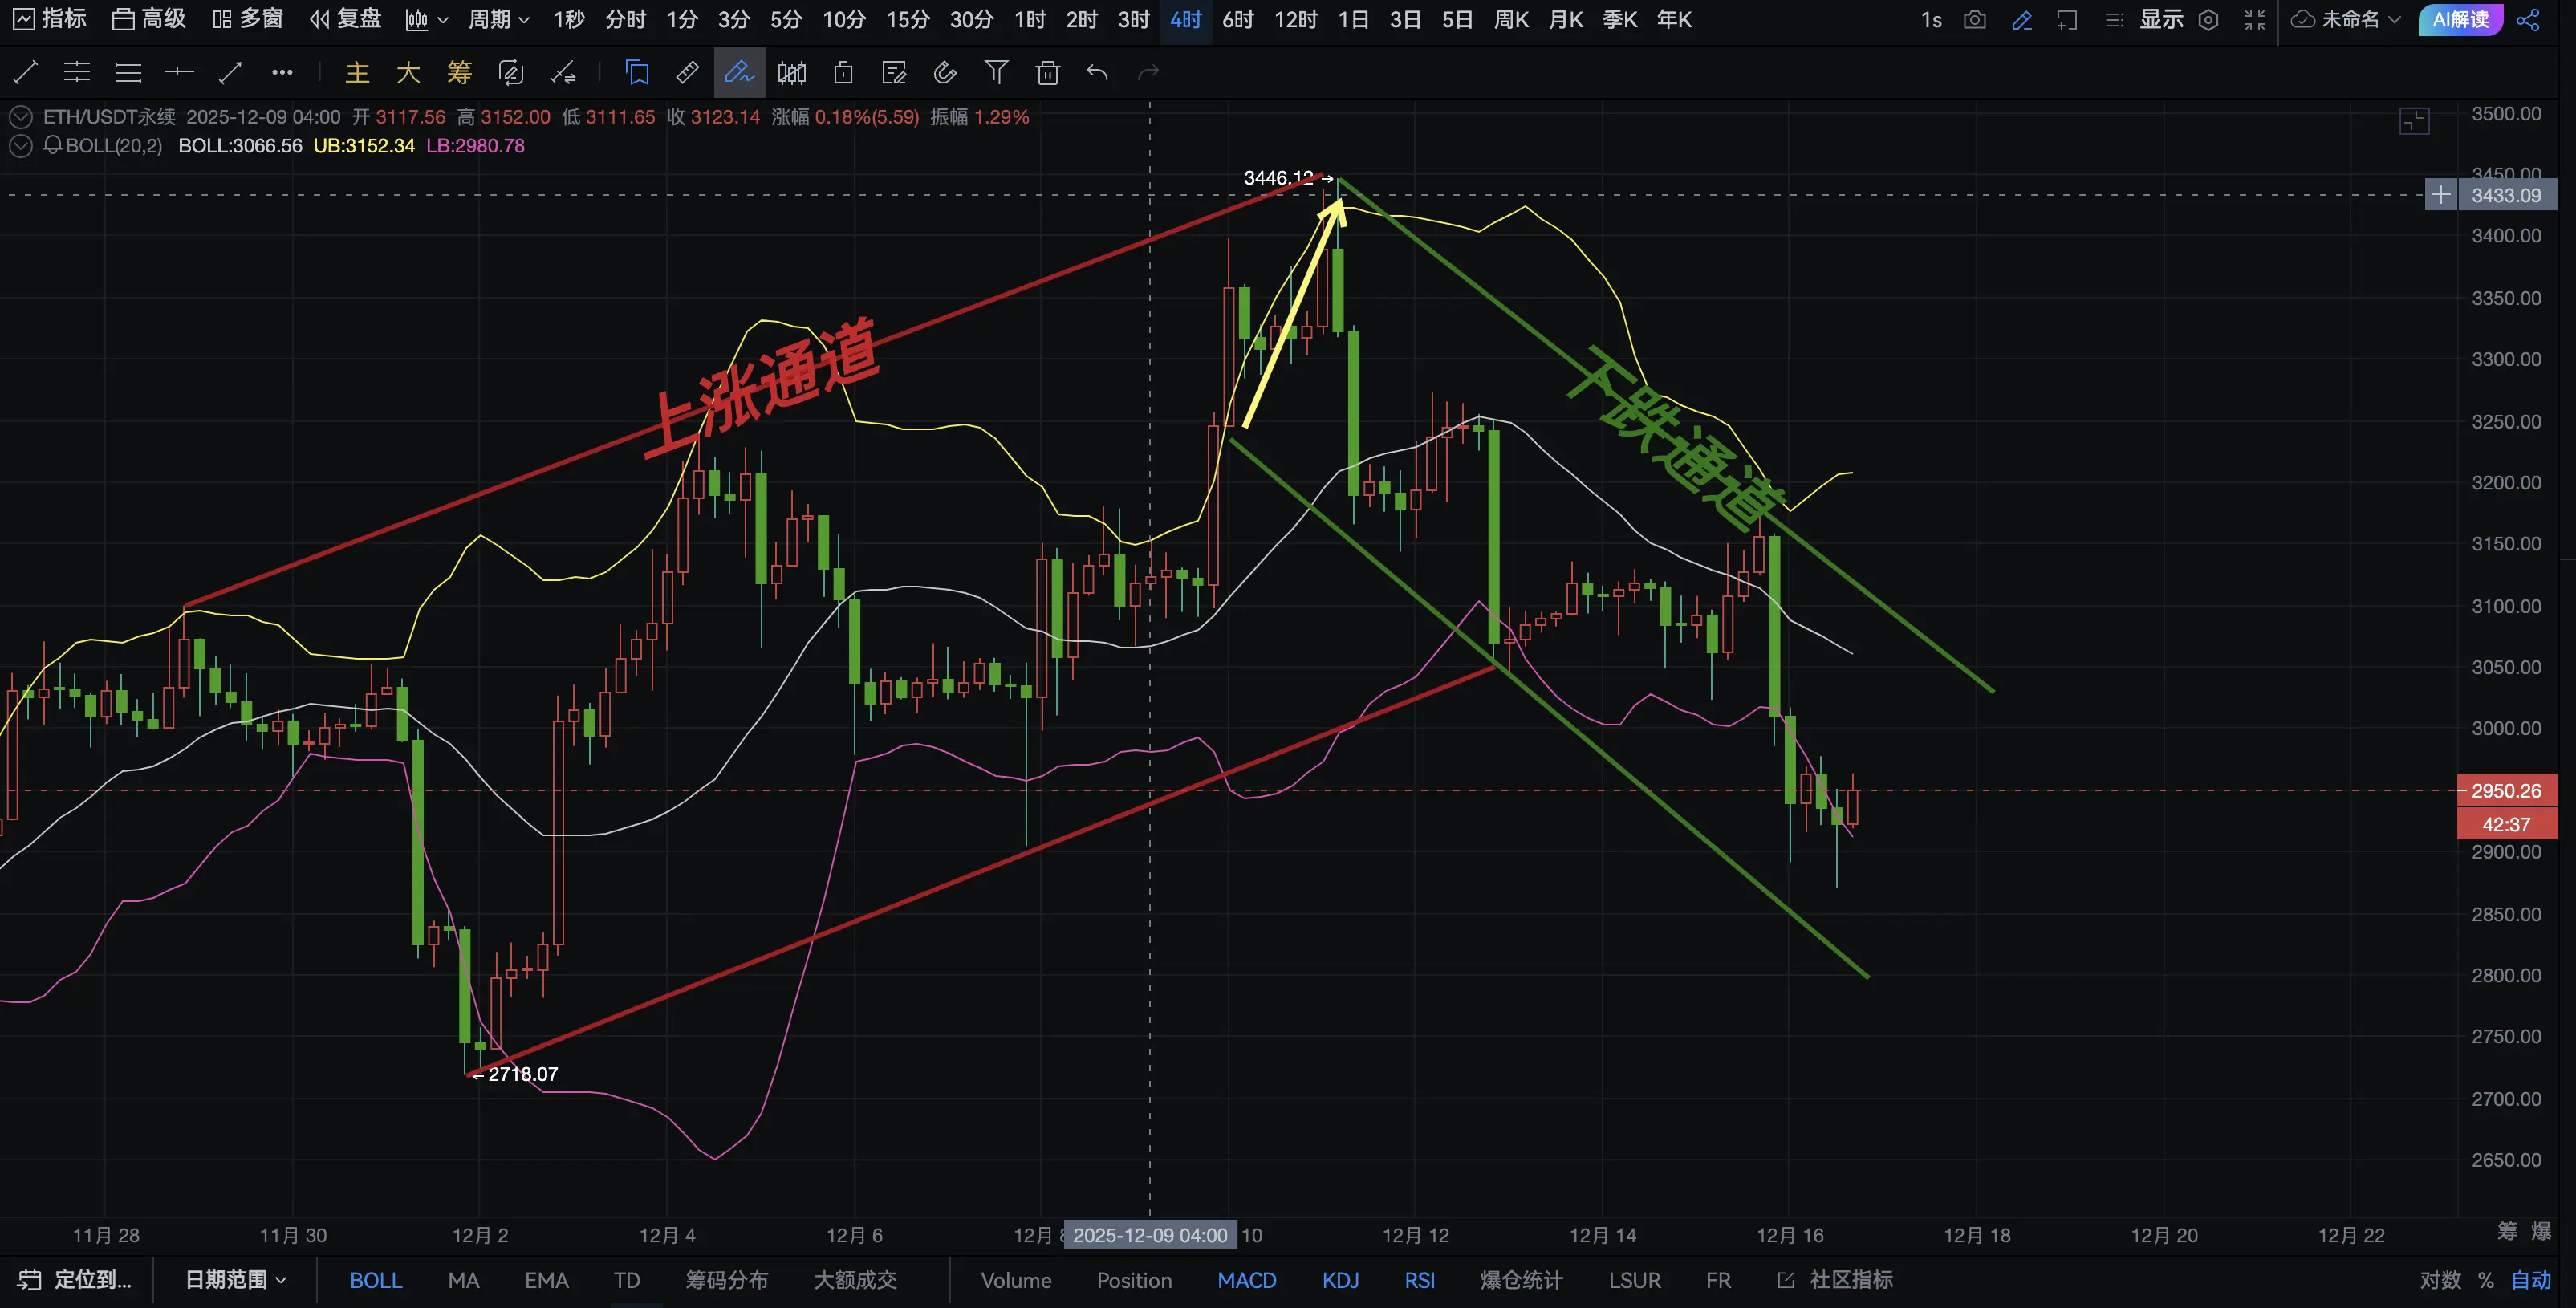
📣12/11 Ethereum Trend Analysis and Trading Strategy Sharing:
A 25 basis point rate cut has been implemented, and Bitcoin is performing a textbook "good news is bad news" scenario, with the market soaring then plunging without hesitation.
Based on four-hour Ethereum price trend analysis, recent candle patterns show a rapid rally after December 9th, reaching a high of 3446.73, but then pulling back. Currently, the price is in a consolidation phase with a downward trend. The daily candlestick shows a long upper shadow with a bearish sign, indicating heavy selling pressure above and potential
View OriginalA 25 basis point rate cut has been implemented, and Bitcoin is performing a textbook "good news is bad news" scenario, with the market soaring then plunging without hesitation.
Based on four-hour Ethereum price trend analysis, recent candle patterns show a rapid rally after December 9th, reaching a high of 3446.73, but then pulling back. Currently, the price is in a consolidation phase with a downward trend. The daily candlestick shows a long upper shadow with a bearish sign, indicating heavy selling pressure above and potential

- Reward
- 1
- Comment
- Repost
- Share