[The user has shared a Space. Please check the app for more details.]
Trade
Basic
Futures
Futures
Hundreds of contracts settled in USDT or BTC
Options
HOT
Trade European-style vanilla options
Unified Account
Maximize your capital efficiency
Demo Trading
Futures Kickoff
Get prepared for your futures trading
Futures Events
Participate in events to win generous rewards
Demo Trading
Use virtual funds to experience risk-free trading
Earn
Launch
CandyDrop
Collect candies to earn airdrops
Launchpool
Quick staking, earn potential new tokens
HODLer Airdrop
Hold GT and get massive airdrops for free
Launchpad
Be early to the next big token project
Alpha Points
NEW
Trade on-chain assets and enjoy airdrop rewards!
Futures Points
NEW
Earn futures points and claim airdrop rewards
Investment
Simple Earn
Earn interests with idle tokens
Auto-Invest
Auto-invest on a regular basis
Dual Investment
Buy low and sell high to take profits from price fluctuations
Soft Staking
Earn rewards with flexible staking
Crypto Loan
0 Fees
Pledge one crypto to borrow another
Lending Center
One-stop lending hub
VIP Wealth Hub
Customized wealth management empowers your assets growth
Private Wealth Management
Customized asset management to grow your digital assets
Quant Fund
Top asset management team helps you profit without hassle
Staking
Stake cryptos to earn in PoS products
Smart Leverage
NEW
No forced liquidation before maturity, worry-free leveraged gains
GUSD Minting
Use USDT/USDC to mint GUSD for treasury-level yields
More
BiteoLvBufan
No content yet
Pin
BiteoLvBufan
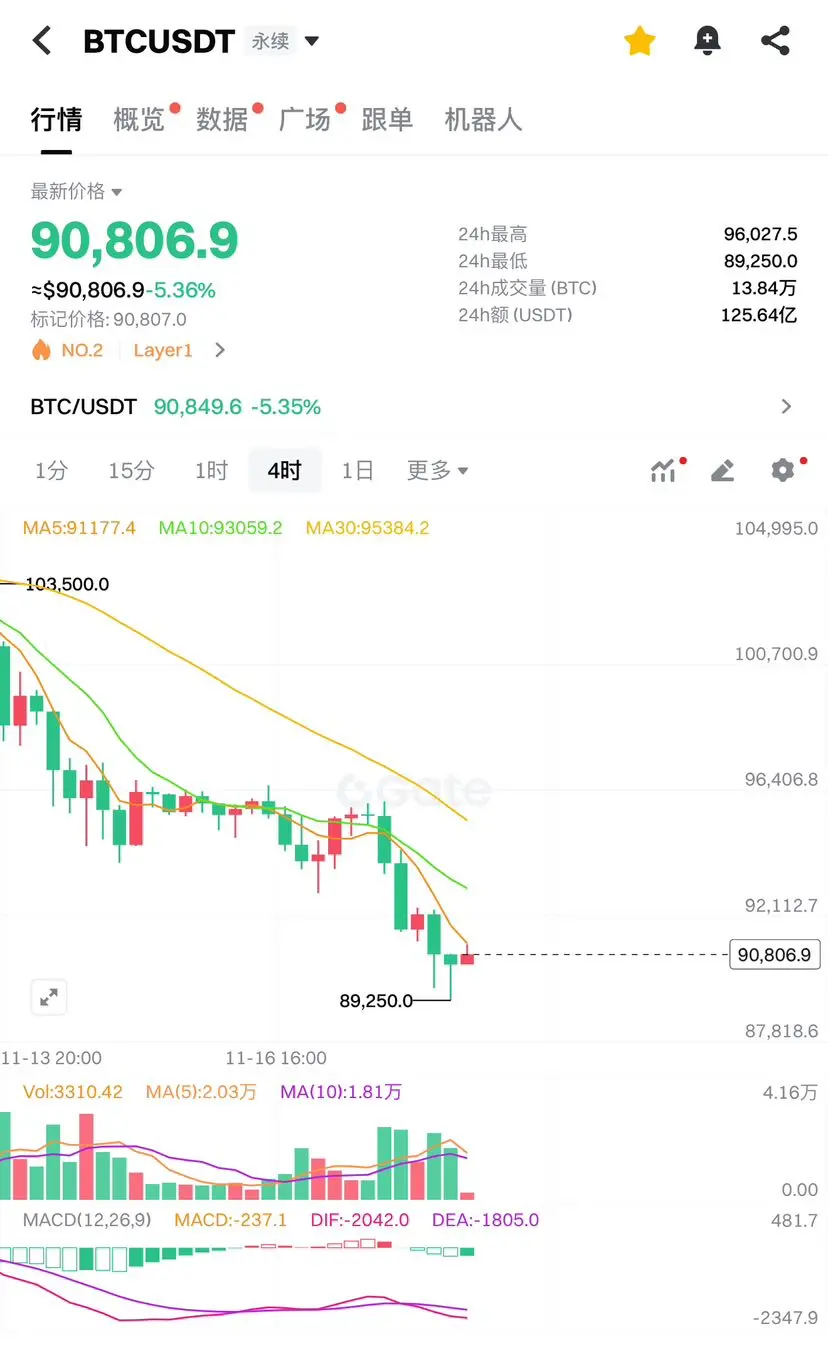
What to do in a situation of extreme market panic $BTC ?
Retail investors are all looking at lower positions. I can understand why they dared to enter when the BTC price was at 100,000, but I can't understand why they still don't dare to enter at the current price of 90,000.
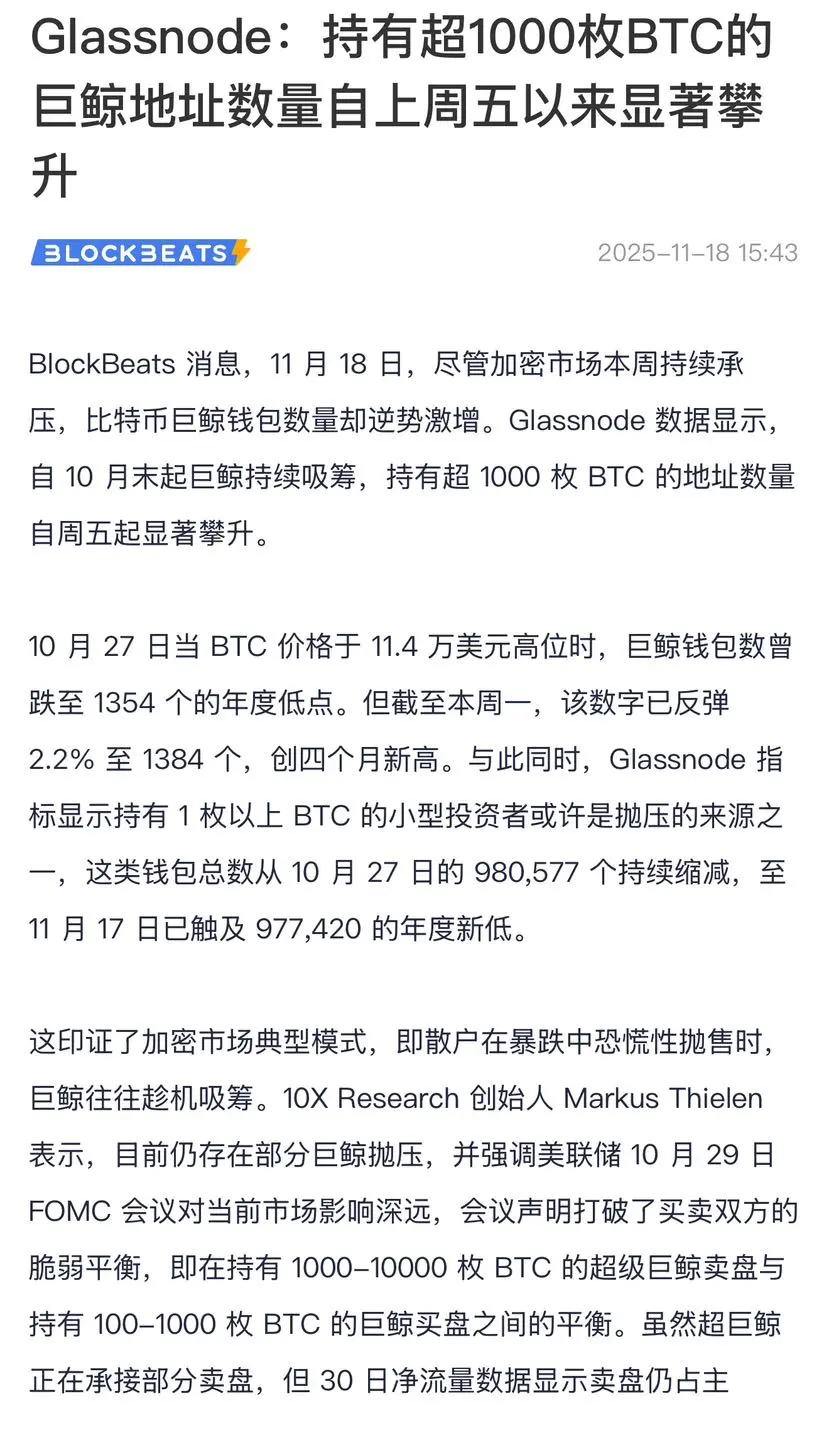
I checked on-chain, and indeed the price has been falling continuously for the past week, but the number of BTC in whale wallets has been increasing... I don't know why.
When BTC was at 100,000, the expectation was for it to drop to 95,000. When it was at 95,000, the expectation was for it to drop to 92,000. Wh
Retail investors are all looking at lower positions. I can understand why they dared to enter when the BTC price was at 100,000, but I can't understand why they still don't dare to enter at the current price of 90,000.
I checked on-chain, and indeed the price has been falling continuously for the past week, but the number of BTC in whale wallets has been increasing... I don't know why.
When BTC was at 100,000, the expectation was for it to drop to 95,000. When it was at 95,000, the expectation was for it to drop to 92,000. Wh
BTC-1,22%
- Reward
- 2
- Comment
- Repost
- Share
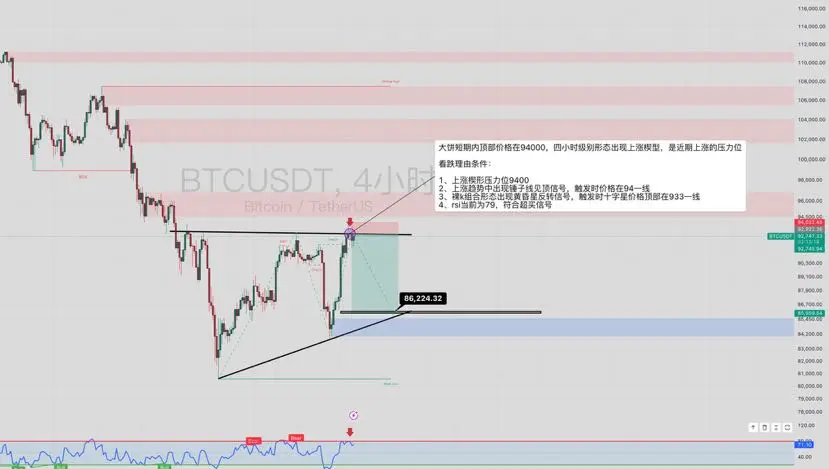
Short-term BTC top price is at 94,000. A rising wedge pattern has appeared on the 4-hour chart, which is the resistance level for the recent uptrend.
Bearish conditions for BTC:
1. Rising wedge upper resistance at 94,000
2. A hammer candlestick has appeared in the uptrend as a topping signal, triggered around the 94,000 level
3. A naked K candlestick pattern has shown an evening star reversal signal, with the doji top at the 93,300 level
4. RSI is currently at 79, indicating an overbought signal
BTC-1,22%
- Reward
- like
- 1
- Repost
- Share
10UChallenges100,000U :
:
Brother Fan, why are you everywhere?- Reward
- like
- Comment
- Repost
- Share
$BTC The trend line of BTC has been broken, last night the US stocks opened low and rose high, holding long positions the maximum space was about over one k, the pattern did not change, just broke even and exited, tonight I want to try for short positions.
The position at 87 has been unstable, holding it doesn't make much sense. The price has basically been sideways at the hourly level, and something big might happen tonight. After hitting the bottom at 80k on the daily chart, the price started to rise and is going smoothly. I estimate many people think they have successfully bottomed.
Wh
BTC-1,22%
- Reward
- 1
- Comment
- Repost
- Share
The weather is nice today on the afternoon of November 21, but my mood is quite bad.
Recently, everyone has seen that I can't seem to find the previous Lü Bufan anymore. I've been frequently making losses in trading, and in the face of the current market situation, I blindly pursue the perfect bottom, it seems that my path in trading is getting narrower and narrower...
The truth is that we all know it. Recently, the trades made in the live broadcast room have been a complete mess. Emotional trading and unstable mindset have caused us to overlook the small profits from each trade, leadi
BTC-1,22%
- Reward
- like
- Comment
- Repost
- Share
$BTC BTC this pattern feels like it's quickly approaching the 100,000 mark.
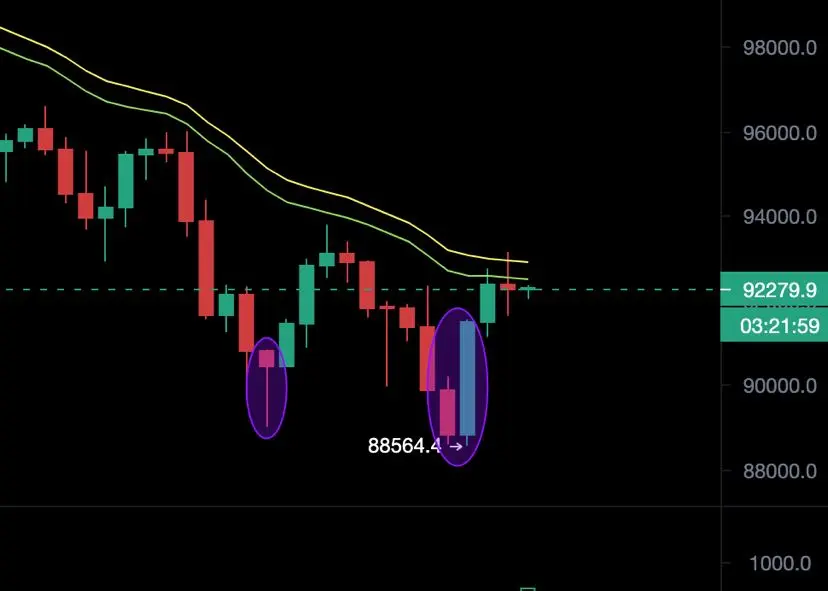
After quickly recovering from the bottom of the hammer line in the four-hour chart last night, it can be seen that this is a false drop operation. The closing price on the four-hour chart returned above 89000, so my position is still valid and there's no need to worry too much.
Careful friends may notice that after the price retraced, it formed a double-bottom pattern and a bullish engulfing pattern near the 885 level. On the daily chart, it has also formed a bullish hammer pattern. The RSI on both the daily a
BTC-1,22%
- Reward
- like
- Comment
- Repost
- Share
$BTC Go check the market data, 2B is here~
During the live broadcast yesterday, the big pie mentioned that there is a resistance level at 94, and the hammer line reversal signal is currently approaching a second test. The bottom at 89 will directly increase positions looking at #当前行情抄底还是观望? .
During the live broadcast yesterday, the big pie mentioned that there is a resistance level at 94, and the hammer line reversal signal is currently approaching a second test. The bottom at 89 will directly increase positions looking at #当前行情抄底还是观望? .
BTC-1,22%

- Reward
- like
- Comment
- Repost
- Share
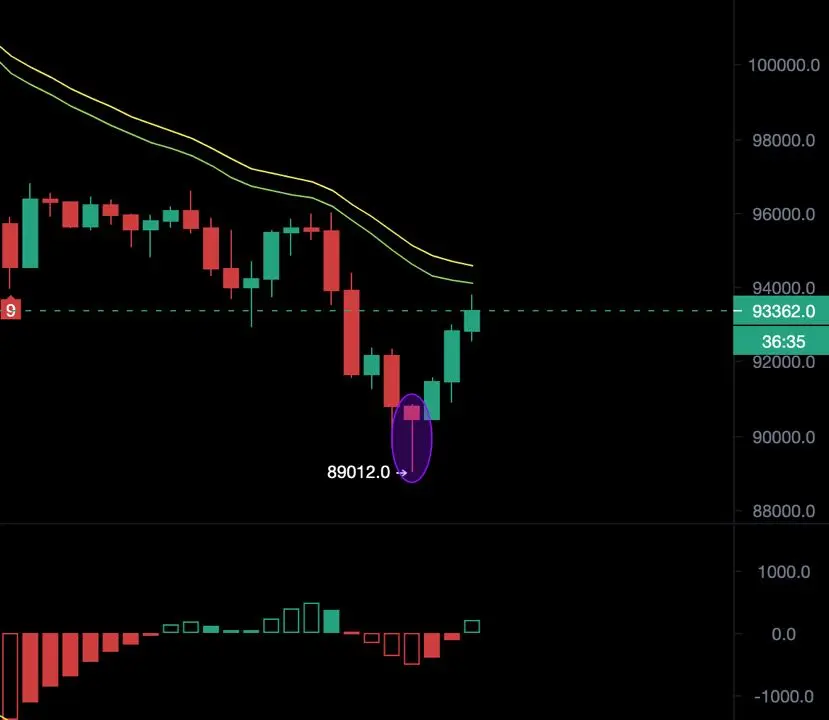
$BTC Today I happened to encounter a K-line like this, so let me briefly explain the technical characteristics of a low-position hammer line.
1. Appears in a downtrend, with a small body, and the body is positioned within the day.
The top position of the price.
2. The lower shadow is long, with a length of two times or more than that of the body.
3. The entity can be either a bearish candle or a bullish candle.
4. No upper shadow, and if there is one, it is very short.
The "hammer" candlestick pattern that appears in a downtrend at the four-hour level in Figure 1 looks like a "hammer" shape.
BTC-1,22%
- Reward
- like
- Comment
- Repost
- Share
How can $BTC become a trading master? First, you need to learn to go up and down more.
For example, based on the current price of Bitcoin.
The master said: "Tonight, focus on the 90000 key support level. If it holds, you can go long and look bullish; if it breaks and stabilizes below, you can go short and look bearish."
You see, I said that as long as we hold steady at ninety thousand, it would be good. Now, isn't there more than a thousand in upward space? As long as you have hands, you can trade 😂
BTC-1,22%
- Reward
- like
- Comment
- Repost
- Share
Thinking about the scene of last night's live trading makes me want to cry...
I have seen that in the cryptocurrency market, price rallies can be a trap for the unsuspecting, but I didn't expect that after the U.S. stock market opened low last night, it also experienced a significant rally that turned out to be a trap. Originally, during this period, trying to catch the bottom was already counter to the entire retail market, yet the U.S. stock market still had to mess with you a bit.
Last night before the market opened, BTC reached a bullish peak rebound of 96 at 93800. I opened two BT
BTC-1,22%
- Reward
- like
- Comment
- Repost
- Share
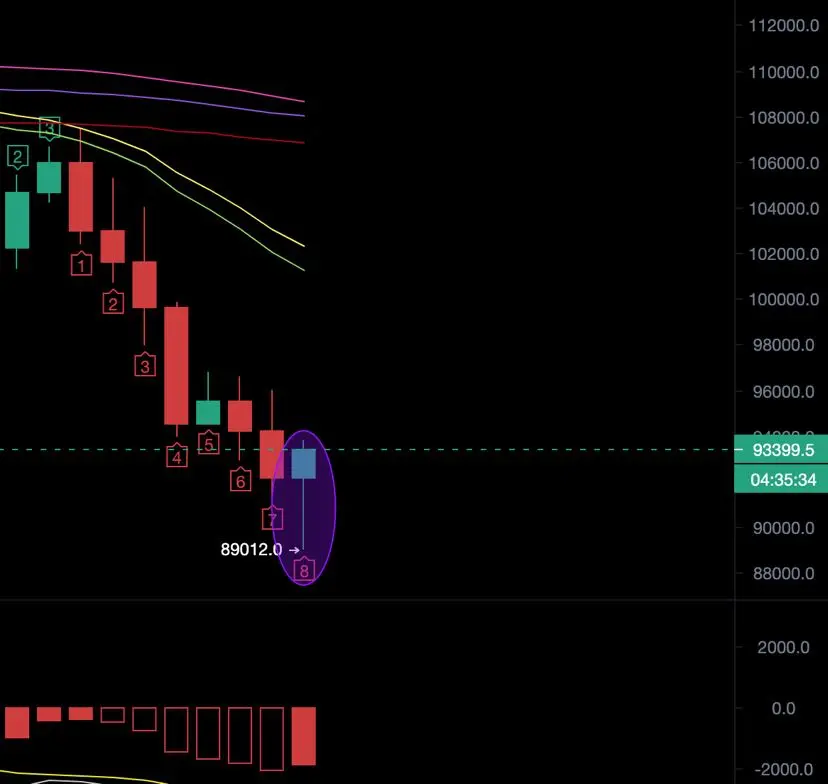
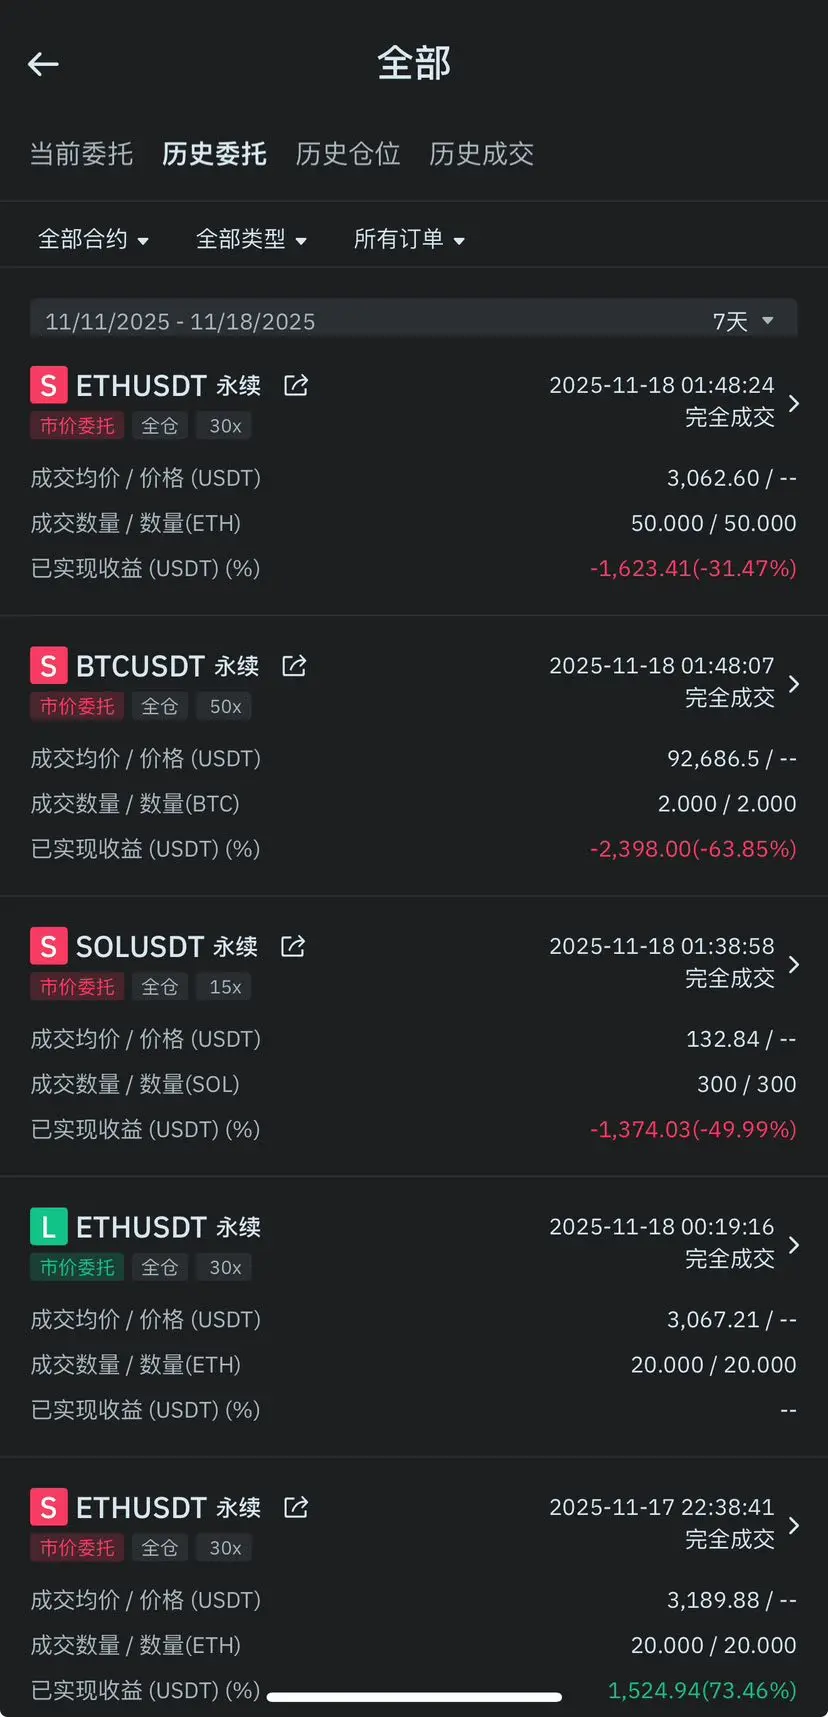
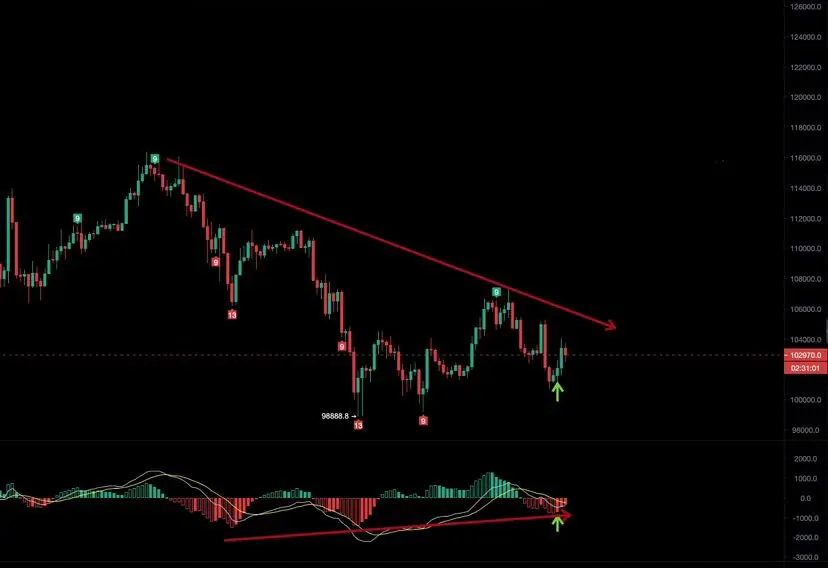
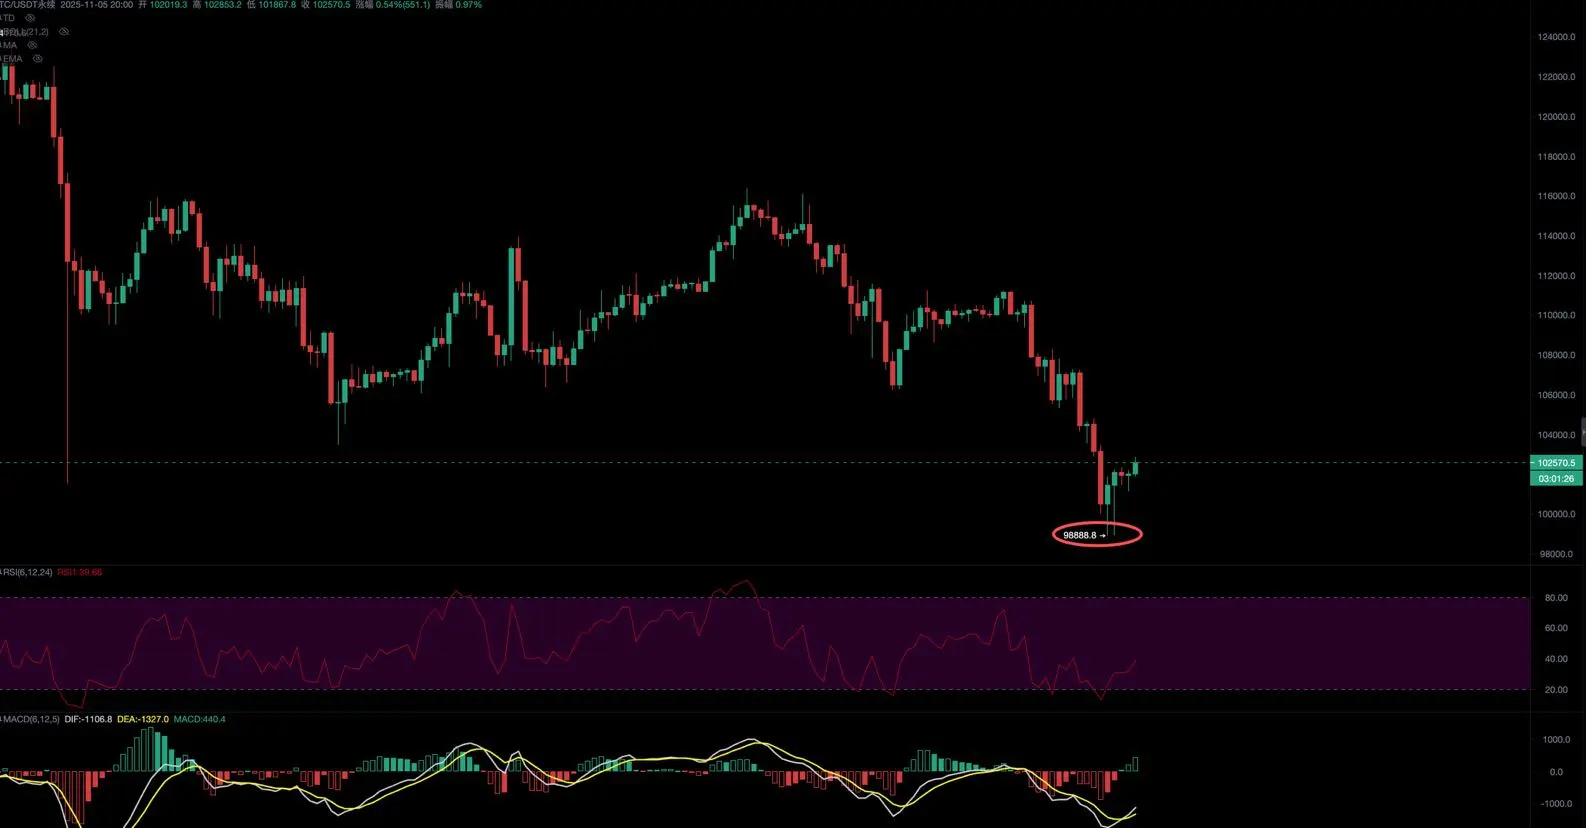
$BTC In the four-hour timeframe, BTC has completed three phases of decline since November 27, and is currently in the third phase. According to the MACD three-segment histogram, each phase of the decline is gradually weakening...
The first section formed a short-term bottom between 116 and 106, starting to rebound near 111, with a drop space of 10,000 points and a rebound space of 5,000 points.
The second section from 111 to 988 forms a short-term bottom and begins to rebound, reaching a high near 107, with a drop space of 10000 points and a rebound space of 6000 points.
The second section fr
BTC-1,22%
- Reward
- like
- Comment
- Repost
- Share
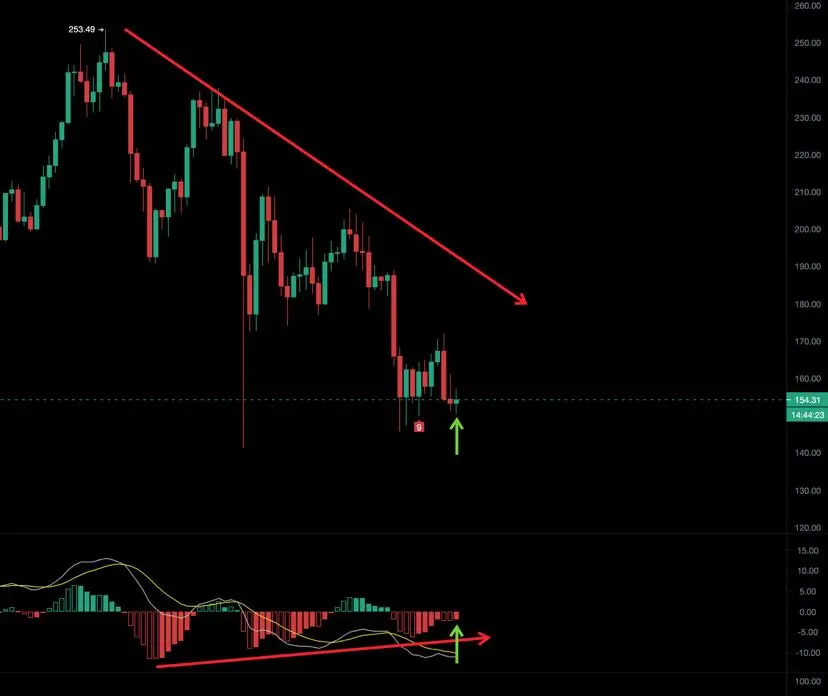
$SOL The three-section MACD histogram price divergence signal is here again, should we buy the dip?
Yesterday I arranged to buy the dip at a maximum of 161 and I didn't sell. I set a stop loss last night, and today I will continue to buy the dip. I shared a lot of valuable information during the live broadcast last night about how to use this signal, and I basically covered everything.
Simply put, this kind of daily level signal may only appear once a month, so there is no reason not to act on it. Even if it gets worn down 10 times at this position, I will still continue to choose bullish
SOL-1,61%
- Reward
- like
- Comment
- Repost
- Share
Bitcoin has formed a double bottom on the four-hour chart, and it currently seems to be stabilizing.
Yesterday, I publicly shared a plan to buy the dip at 103,000 and go long. I allocated 2% of my main position and added another 2% at the 99,000 level. If you followed my advice and did the same, you should be making a profit now.
While it looks like the market is stabilizing, we should also take protective measures. It's wise to reduce your positions now and wait for a second dip to add more, which is the safest approach.
For those who like to follow the trend, don’t worry about the 85,000 lev
BTC-1,22%
- Reward
- like
- Comment
- Repost
- Share
Yesterday, many of the brothers who attended the class online were mostly trapped by positions set down south, with an average price basically around 11. After analyzing the market data, I believe that breakeven is definitely not a problem. Just control the liquidation price well, and don't let your position disappear when the price comes back.
Yesterday during the class, it was also mentioned that for those who are in a flat position, BTC 122K can head south, and this position is better than ours. For the long term, let's temporarily look at the level of 108K, which has now dropped almost 5K
Yesterday during the class, it was also mentioned that for those who are in a flat position, BTC 122K can head south, and this position is better than ours. For the long term, let's temporarily look at the level of 108K, which has now dropped almost 5K
BTC-1,22%

- Reward
- like
- Comment
- Repost
- Share
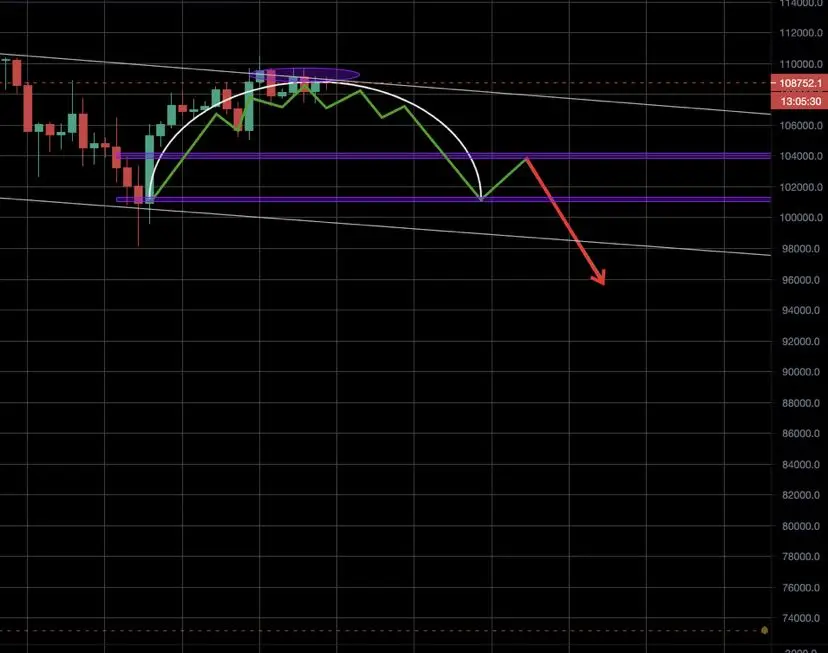
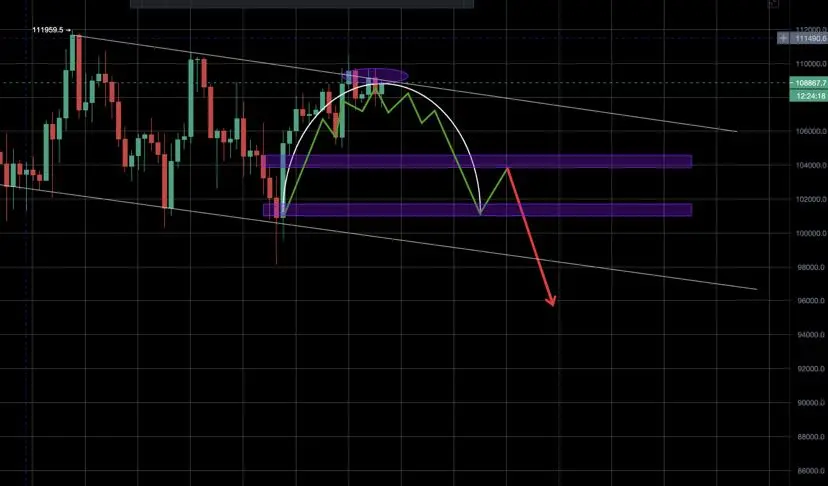
I have nothing to say about the current market trend. BTC's performance is developing completely as I expected, with a weak rebound and gradually forming a top. The daily chart's rounded top pattern is still valid.
In the short term, it's also quite good to trade BTC on a short line, for example, the range of 1088-1092 arranged yesterday, and the lowest came to around 108 in the evening, which is about a thousand points of space. Still, the same phrase: the market owes us a waterfall, spot players hurry and sell.
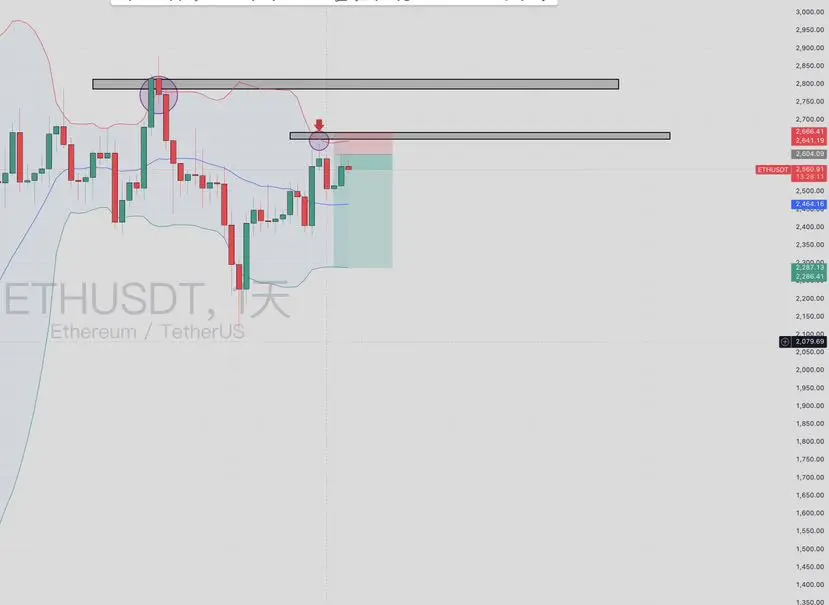
Yesterday, ETH surged up like it had taken gunpowder. The internal defense at 263
View OriginalIn the short term, it's also quite good to trade BTC on a short line, for example, the range of 1088-1092 arranged yesterday, and the lowest came to around 108 in the evening, which is about a thousand points of space. Still, the same phrase: the market owes us a waterfall, spot players hurry and sell.
Yesterday, ETH surged up like it had taken gunpowder. The internal defense at 263
- Reward
- like
- Comment
- Repost
- Share
Four-hour level symmetrical triangle formation characteristics of SOL
The symmetrical triangle pattern can be bullish or bearish, depending on the market. However, in either case, it is usually a continuation pattern, which means that once the pattern is formed, the market typically continues to move in the same direction as the overall trend.
When recommending trading techniques, pay attention to the upper and lower trend lines. If the coin price shows a unilateral breakthrough, you can enter the trade on the right side.
Currently, it is important to note the resistance at 152.5 and the suppo
SOL-1,61%

- Reward
- like
- Comment
- Repost
- Share
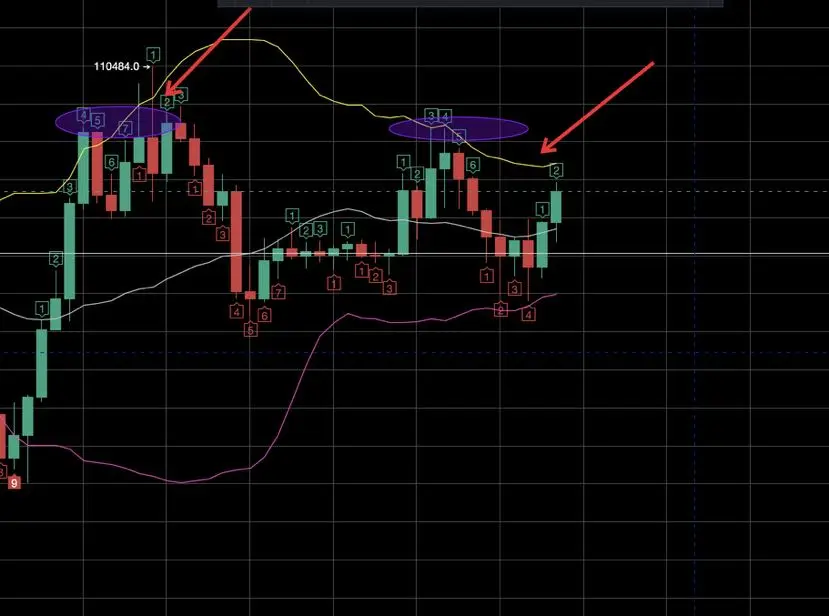
The trading hours experienced a slight rebound, but it does not affect our confidence in the downward trend. The price top divergence on the upper band of the four-hour Bollinger Bands on Monday is still valid, so long term players can wait patiently.
According to the current reliable daily arc top pattern, the previous content has explained the specific characteristics of the pattern, which completely match. Holding a bearish view will not be wrong. From a macro perspective, recent tariff news has been frequent, and all kinds of bulls and horses are continuously supporting BTC at the current
According to the current reliable daily arc top pattern, the previous content has explained the specific characteristics of the pattern, which completely match. Holding a bearish view will not be wrong. From a macro perspective, recent tariff news has been frequent, and all kinds of bulls and horses are continuously supporting BTC at the current
BTC-1,22%
- Reward
- like
- 1
- Repost
- Share
GateUser-481b560f:
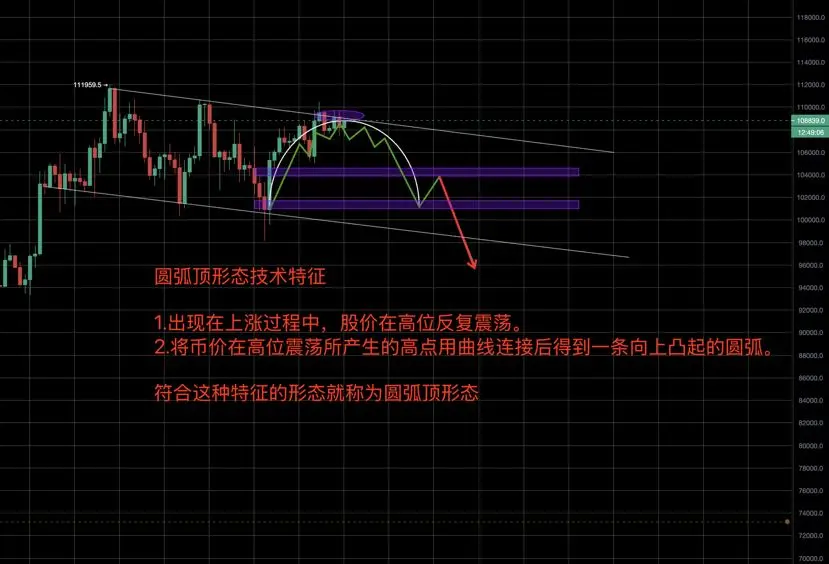
Just go for it💪btc daily arc top pattern
1. Appears during the uptrend, where the stock price fluctuates repeatedly at a high level.
2. Connect the highs produced by the stock price oscillating at a high level with a curve to obtain an upwardly convex arc.
The shape that conforms to this characteristic is called the arc top shape.
The rounded top pattern indicates that after a period of price increase, although the upward trend continues, the dominant buying force is gradually weakening. The price increase is slowing down and eventually reaches a stagnation state. Later, the selling force gradually strengthe
BTC-1,22%
- Reward
- like
- Comment
- Repost
- Share
From the perspective of the daily chart market data, looking at ETH, not shorting would really be disrespectful to myself. The market has consolidated for two days over the weekend, and a slight pump on Monday is also understandable.
Last week's short position at 260, the lowest reached was 2480. I don't know if the position I mentioned in the class was just a hindsight call. To put it plainly, the current rebound is just a gift entry opportunity. The upper divergence at 267 still hasn't broken. Be patient, the market owes us a waterfall.
On the four-hour level, ETH also showed a top divergenc
ETH-2,43%
- Reward
- like
- Comment
- Repost
- Share
A storm is coming! Just now, India proposed to impose retaliatory tariffs on the automotive industry in the United States under the guise of protective measures.
According to Old Trump's style, he will definitely not suffer losses on tariffs. If you dare to impose additional tariffs on me, I will dare to impose them on you. It all depends on who wins and who loses in this trade war. I believe that after Old Trump imposes additional tariffs, a negotiation script will unfold.
Regardless of the outcome, this process will definitely be bearish for the crypto space. Brothers, just hold on to your s
View OriginalAccording to Old Trump's style, he will definitely not suffer losses on tariffs. If you dare to impose additional tariffs on me, I will dare to impose them on you. It all depends on who wins and who loses in this trade war. I believe that after Old Trump imposes additional tariffs, a negotiation script will unfold.
Regardless of the outcome, this process will definitely be bearish for the crypto space. Brothers, just hold on to your s

- Reward
- like
- Comment
- Repost
- Share