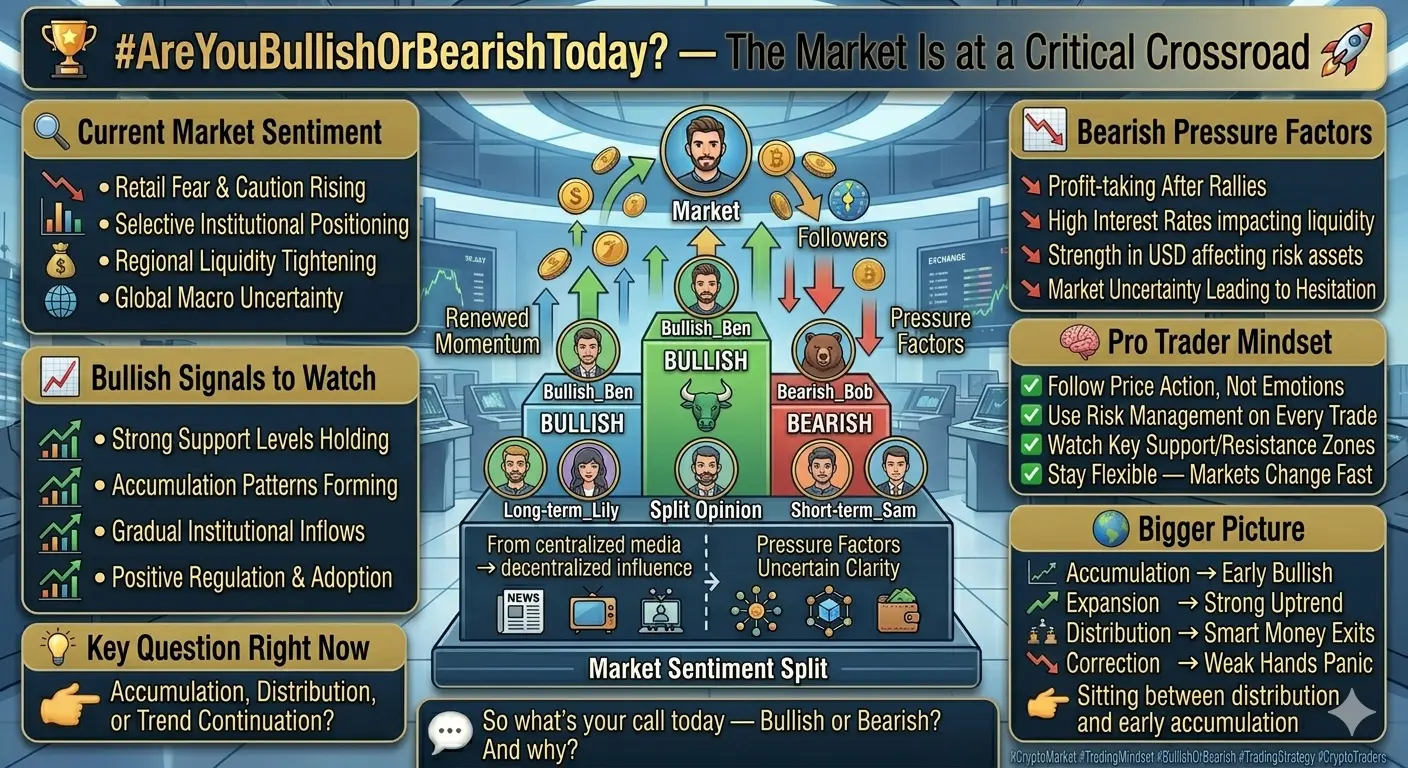
#AreYouBullishOrBearishToday?
BULLISH or BEARISH? Full Market Breakdown — April 4, 2026
The Short Answer First
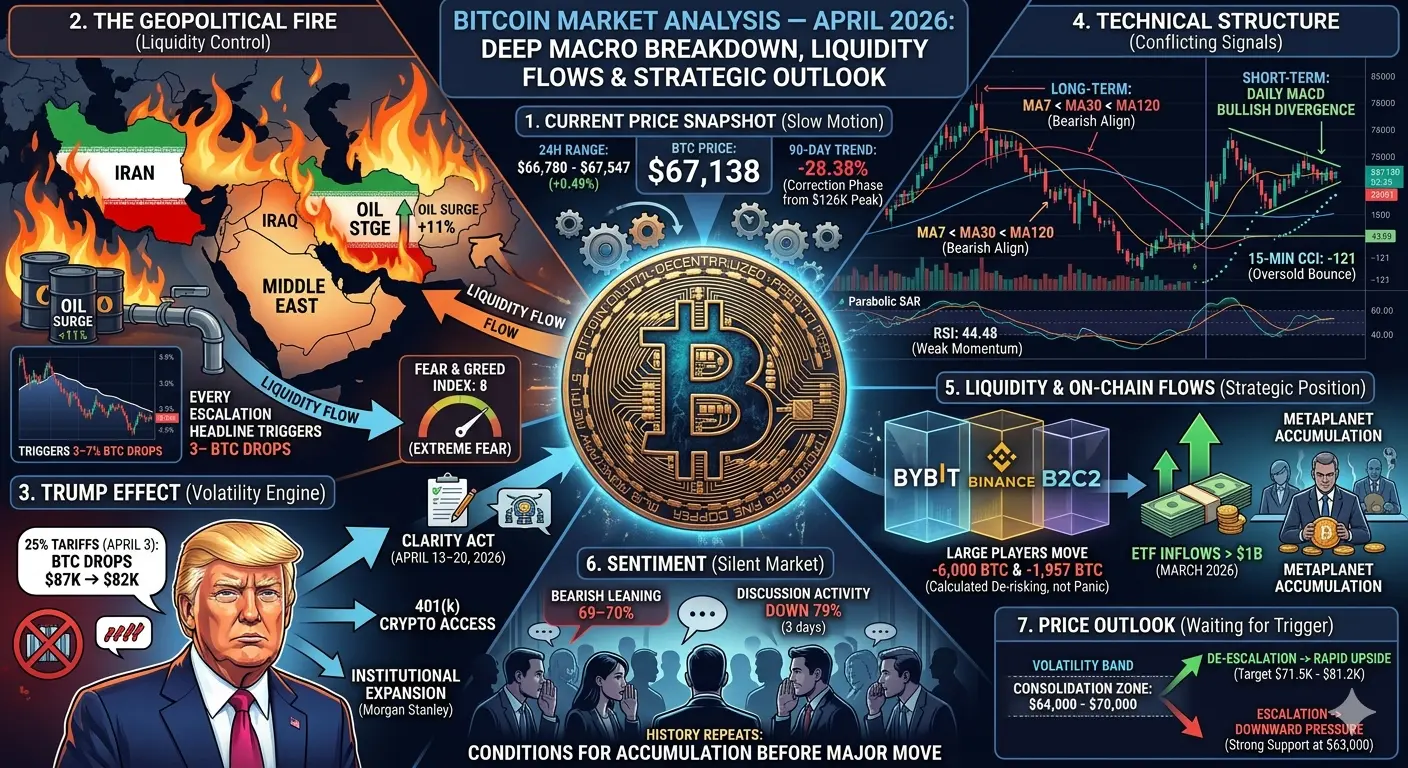
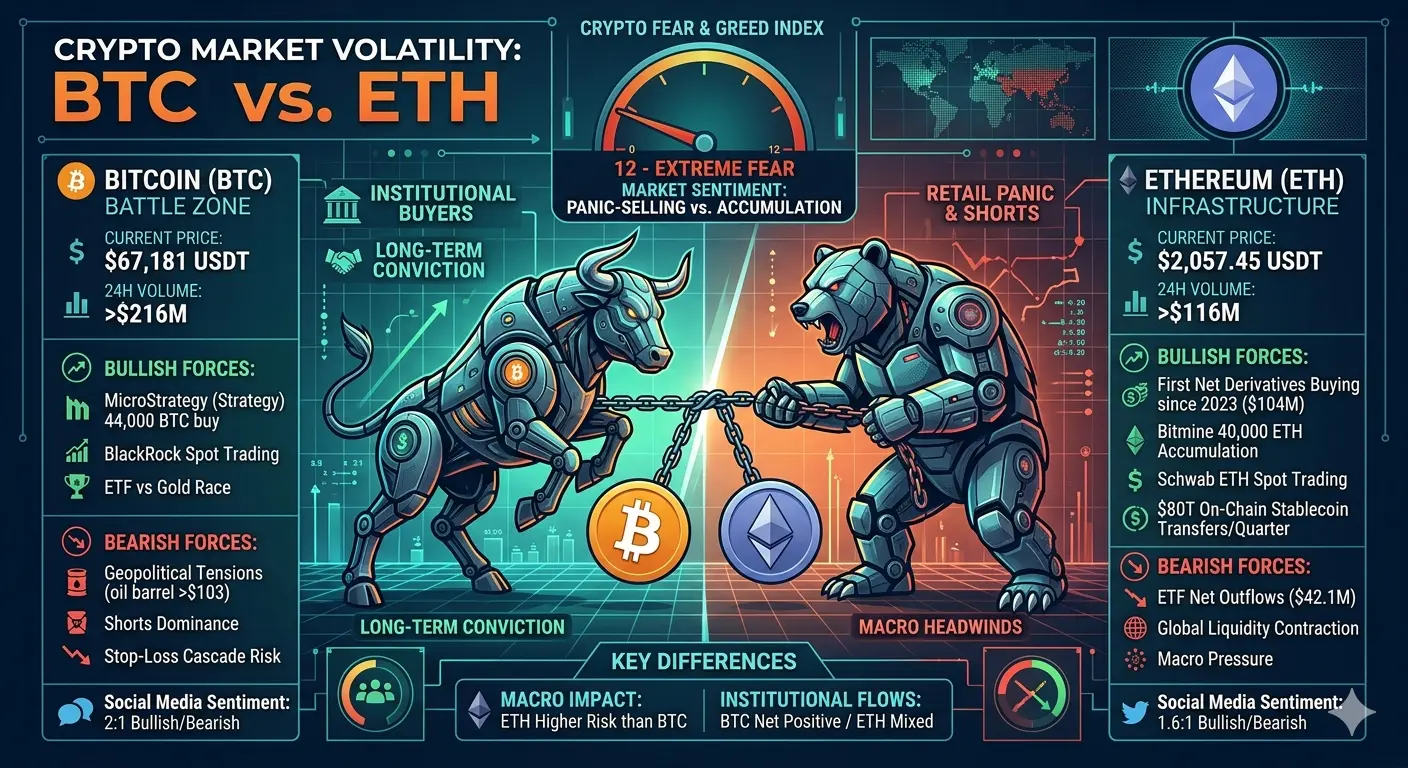
Currently BEARISH with selective safe-haven strength. The Fear & Greed Index is sitting at 11 out of 100 — Extreme Fear. That number alone tells you everything about the current market mood. Traders are scared, not greedy.
---
STEP 1 — The Big Picture: What Is Driving Markets Right Now?
Macro Environment (The Root Cause)
The single biggest factor crushing markets right now is Trump's sweeping tariff policy — essentially a modern version of the 1930 Smoot-Hawley tariffs that triggered the Great Depression. Here is what happened:
Trump announced massive tariffs on all major US trade partners
China immediately retaliated with counter-tariffs
This triggered a global risk-off sentiment — investors ran away from risk assets
Stock markets had their worst single-day drop since 2020
When stocks bleed, crypto usually bleeds harder. That is the current setup.
Liquidity Situation
The probability of a Fed rate cut in June dropped from 62% to 57% after tariff announcements
Less chance of rate cuts = tighter liquidity = less money flowing into risky assets like crypto
Oil prices are elevated (more on that below), which adds inflationary pressure and keeps the Fed cautious
---
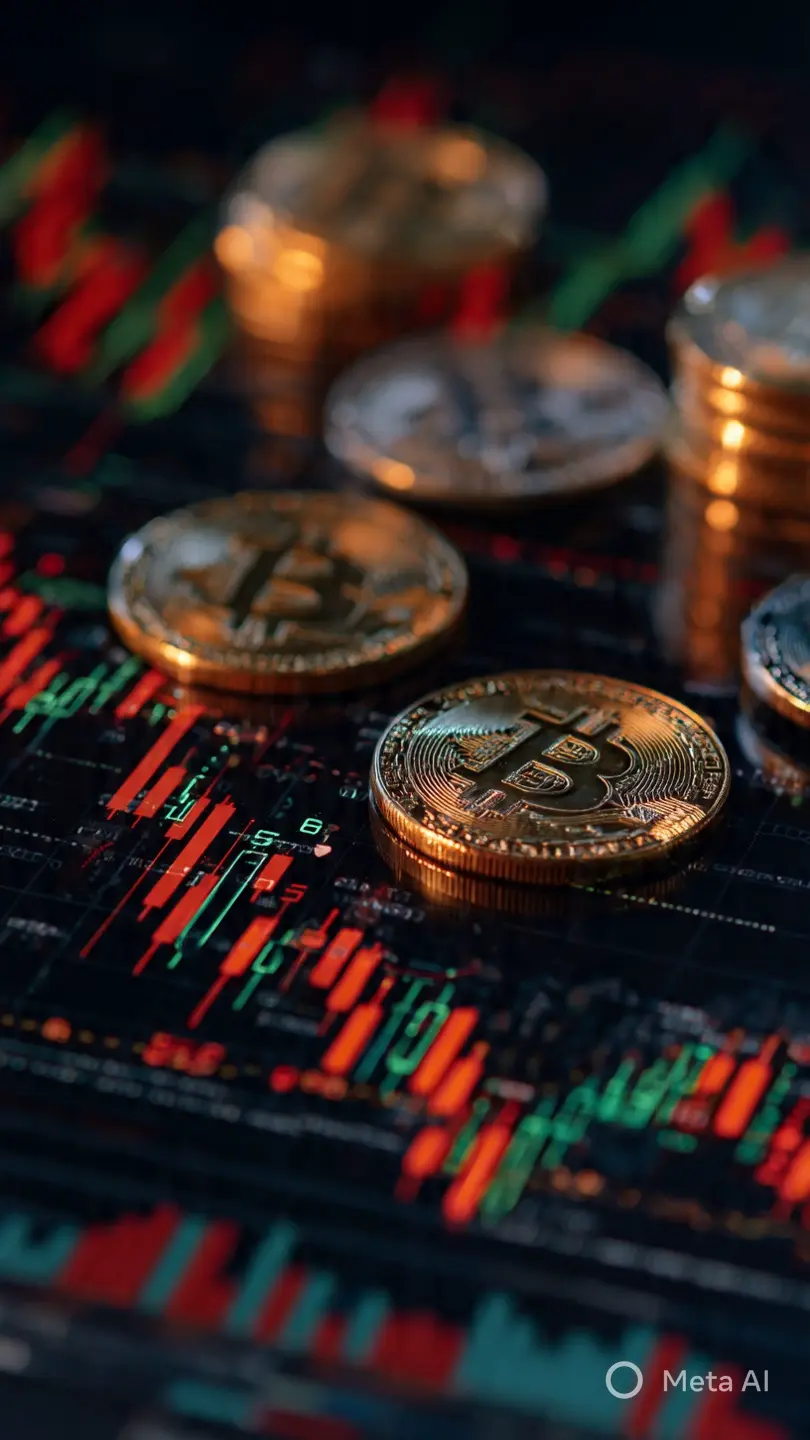
STEP 2 — BTC Current Status
Metric Value
Current Price $67,006
24h High $67,352
24h Low $66,514
24h Change +0.3%
7-Day Change +1.5%
30-Day Change -1.6%
90-Day Change -28.6%
Reading this data honestly:
BTC is stuck in the $65,500 - $69,200 range — no strong breakout direction
The 90-day number of -28.6% tells you we are in a clear downtrend on the bigger timeframe
Short-term (7 days) shows +1.5% — just noise, not a trend reversal
Whales (1,000–10,000 BTC holders) have collectively sold 188,000 BTC over the past year — this is heavy bearish pressure from the top
Bitcoin miners like Riot Platforms are selling BTC to cover operational costs — miner capitulation is a classic late-bear-market signal
Michael Saylor's Strategy continues buying — but he is a long-term HODLer, not a signal for short-term direction
BTC Sentiment on X (Social Media):
Bullish authors: 78
Bearish authors: 31
Total discussing: 127
So Twitter/X is still roughly 2.5x more bullish than bearish on BTC — but social sentiment often lags price reality. Do not trade social media alone.
---
STEP 3 — ETH Current Status
Metric Value
Current Price $2,051
24h High $2,080
24h Low $2,041
24h Change -0.36%
7-Day Change +3.3%
30-Day Change +3.6%
90-Day Change -36.4%
ETH is underperforming BTC on the 90-day chart
The ETH/BTC pair is hovering near a critical macro support zone (around 0.0197 BTC) — this level previously marked macro bottoms in 2016 and 2019
Ethereum Foundation recently increased its staking to 70,000 ETH — showing confidence in the network
Schwab and BlackRock are planning to launch BTC and ETH spot trading in H1 2026 — this is a long-term bullish signal, not near-term
---
STEP 4 — METALS vs OIL vs BTC Comparison
This is the real comparison a trader needs to understand:
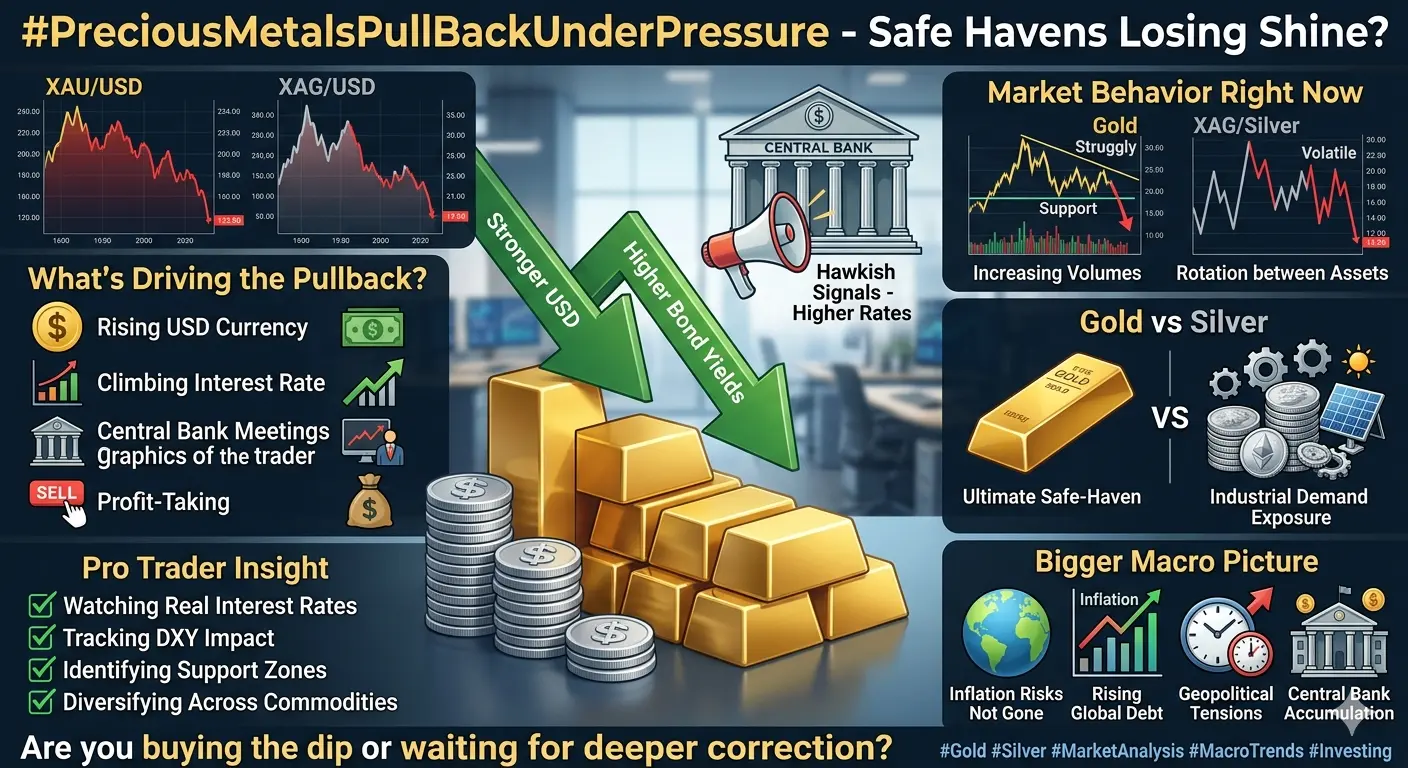
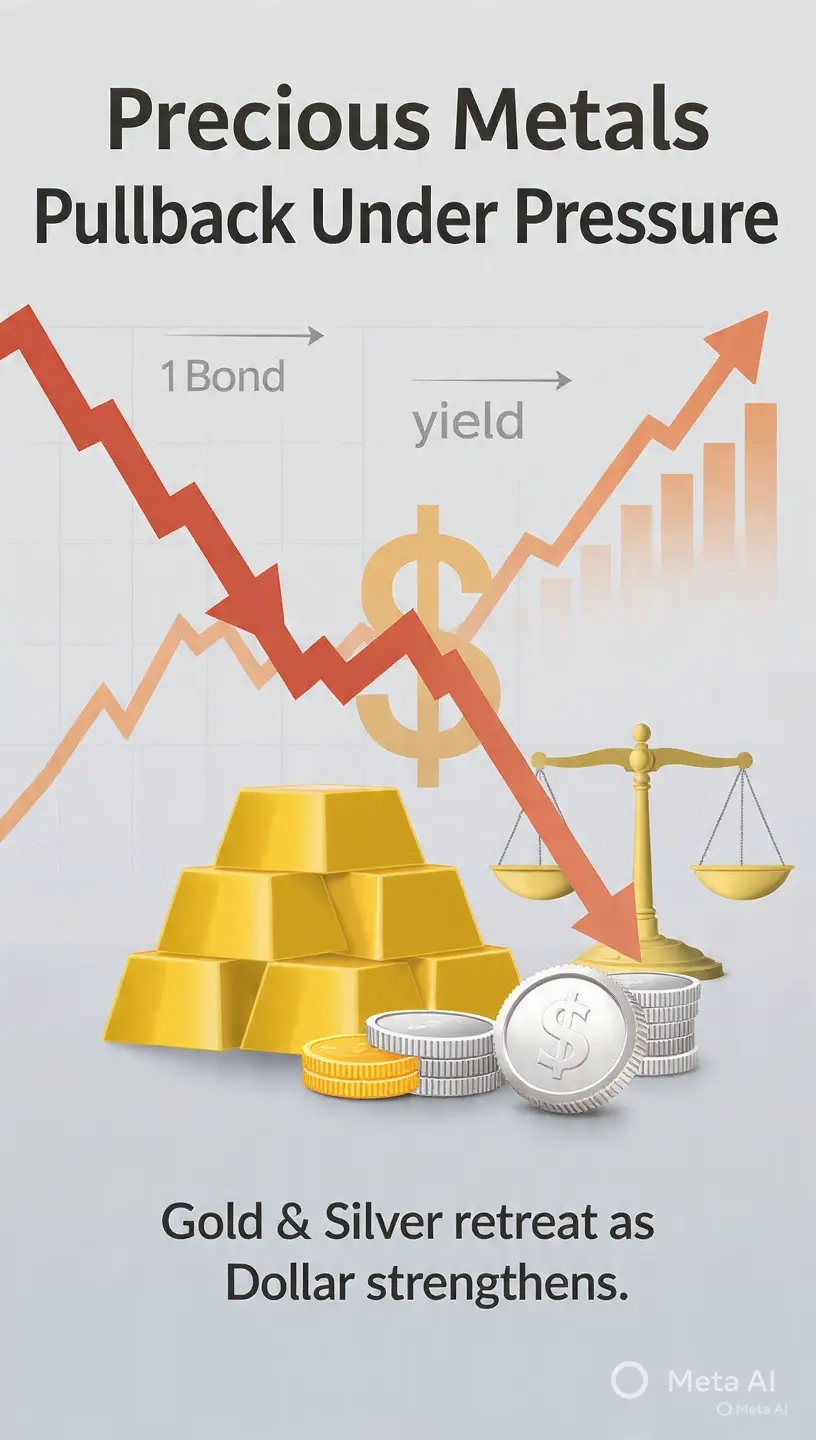
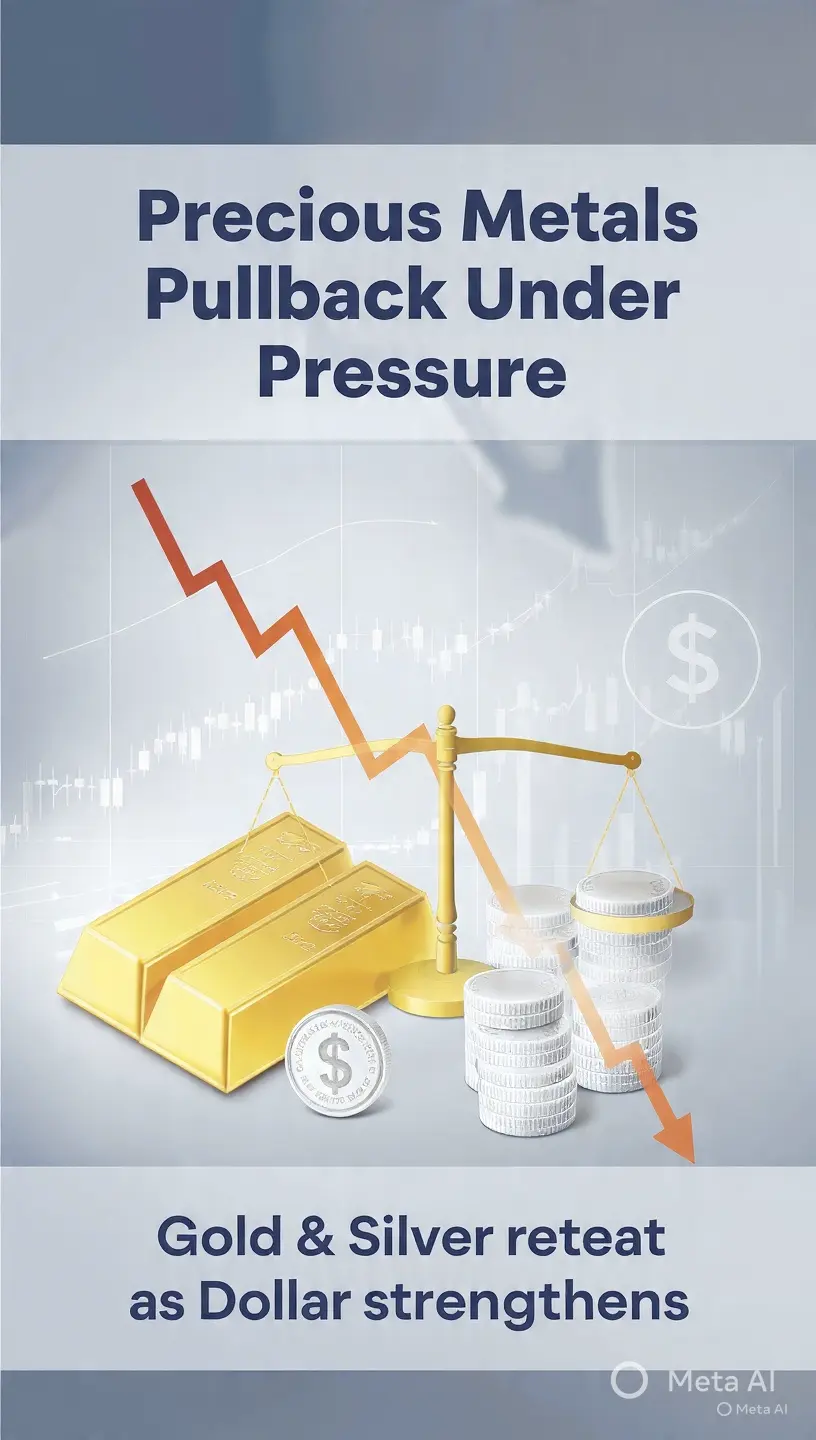
Gold (XAU/USD)
Fact Detail
Current Spot Price -$4,676 per ounce
Recent Performance +19.25% in past 3 months
Trend STRONGLY BULLISH
Gold is on an absolute monster run right now. Why? Because when there is geopolitical uncertainty, trade wars, and fear — money flows into gold as the ultimate safe haven. Institutions, governments, and retail traders are all piling into gold. Gold is doing its classic job perfectly.
Key message: Gold is the king of this current risk-off environment.
---
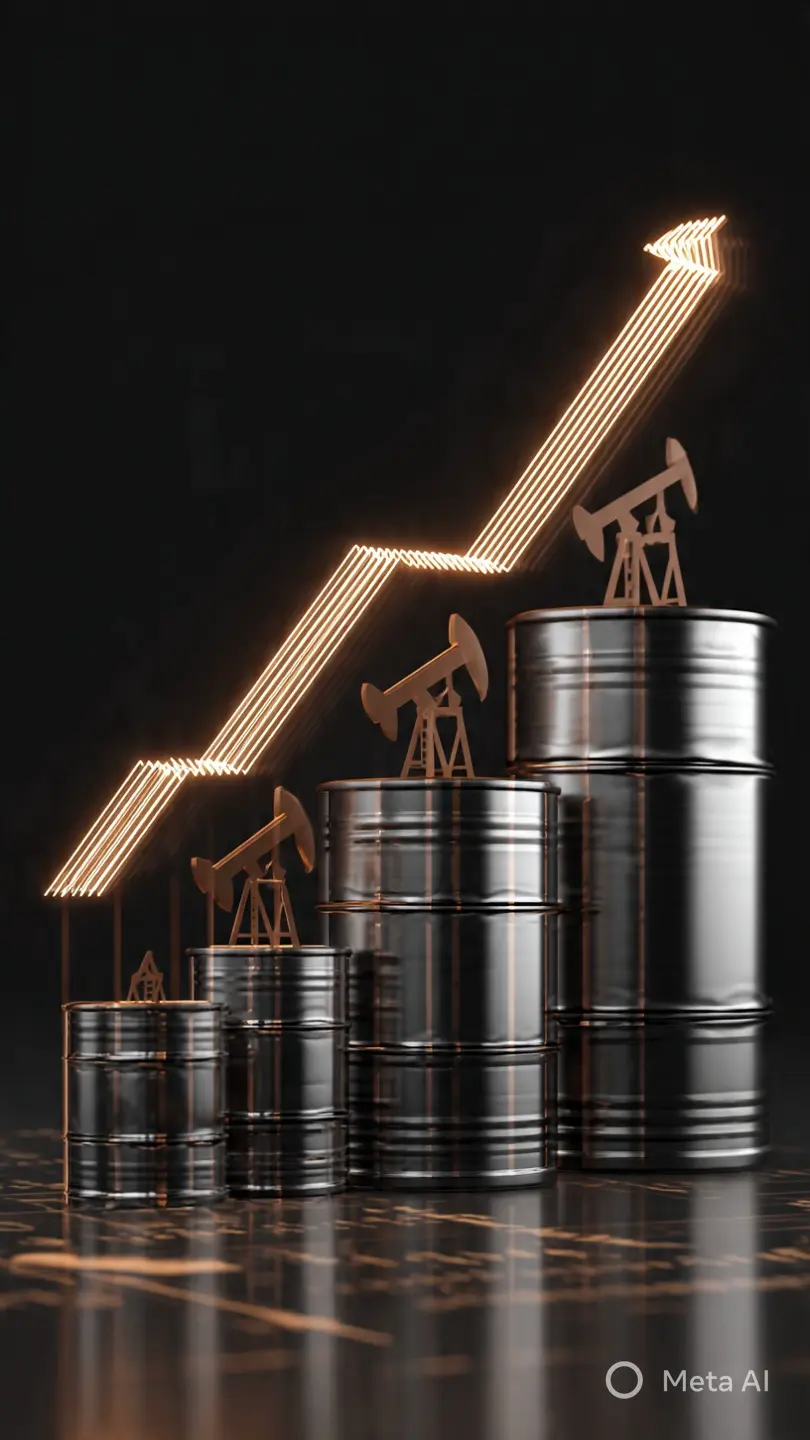
Crude Oil (WTI)
Fact Detail
Current WTI Price -$60–68 per barrel (near-term)
Trend BEARISH/WEAK
Key Driver Trade war fears crushing demand outlook
Oil is in a complicated spot:
Trade wars reduce global economic activity, which reduces oil demand
JP Morgan already cut its 2025 Brent forecast to $66/barrel (from $73)
OPEC+ supply decisions add further uncertainty
High oil prices hurt inflation → hurts crypto indirectly because the Fed stays hawkish
Oil is not a buy here for most traders — it is caught between supply pressure and weak demand outlook.
---
BTC vs Gold vs Oil — Who Wins in This Environment?
Asset Current Trend Safe Haven Status Short-Term
Gold Bullish Yes, classic Strong
Oil Weak/Bearish No Cautious
BTC Sideways/Bearish Partial (developing) Uncertain
BTC is trying to become a safe haven like gold, but it is not there yet. In a risk-off environment, gold wins. BTC still trades partly like a tech stock — when stocks fall, BTC falls with them. The 90-day -28.6% chart confirms this.
---
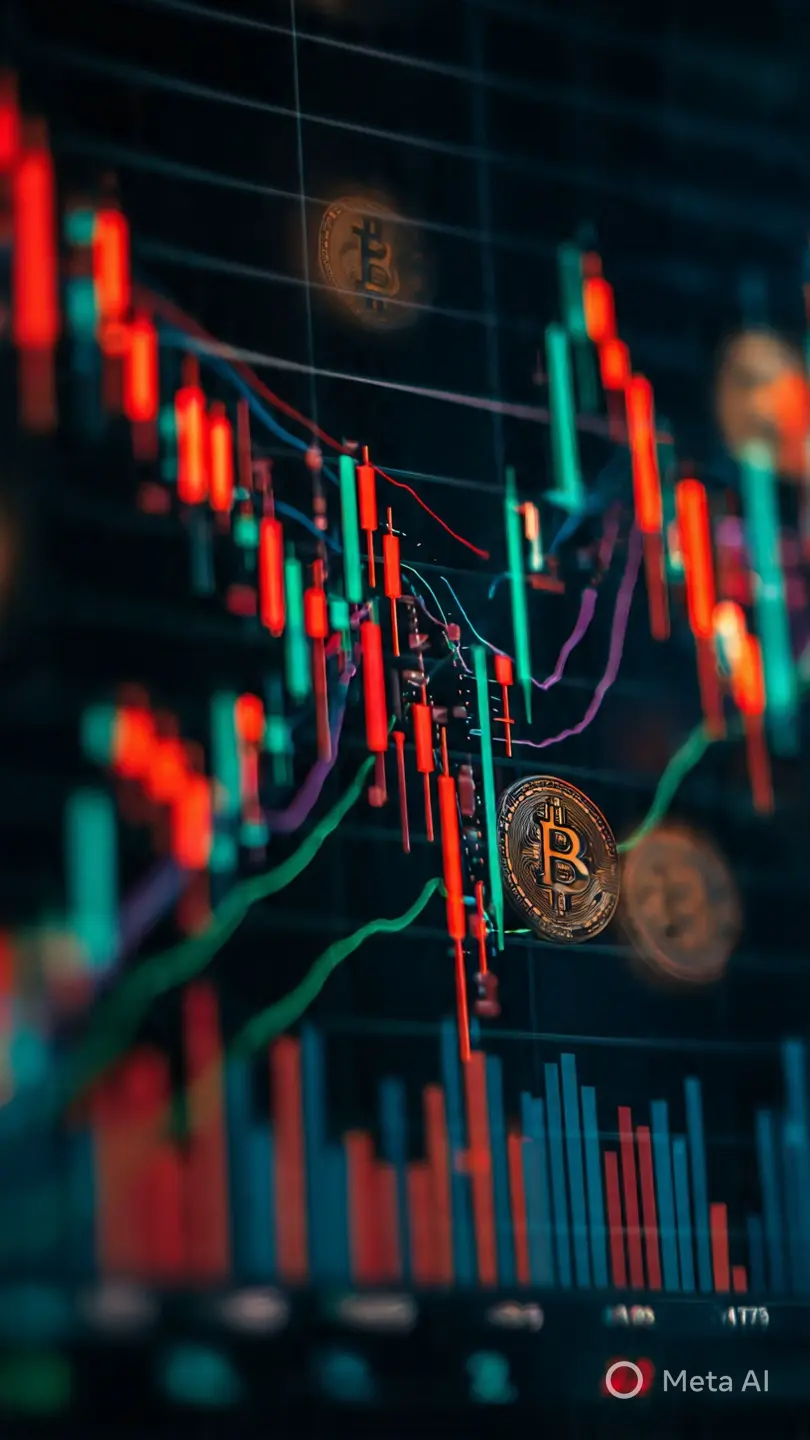
STEP 5 — Fear & Greed Index = 11 (Extreme Fear)
This is the most important single number right now.
What does 11/100 mean for a trader?
The market is oversold emotionally — people are panic-selling
Historically, extreme fear zones are buying opportunities, not selling zones — but timing matters
The legendary Warren Buffett principle: "Be greedy when others are fearful"
However: fear can stay at extreme levels for weeks or months before a reversal
Do NOT catch a falling knife just because fear is high
---
STEP 6 — TRADING TIPS for Trader Hazrat
If You Want to Trade RIGHT NOW — Here Is the Honest Advice:
Scenario A: You Want to Go LONG (Buy)
Wait for BTC to hold above $66,500 and show at least 2–3 daily closes above $68,000
Entry zone only if price breaks and holds above $70,000 — that would signal a real trend change
Use strict stop-loss below $65,000 — no exceptions
Position size should be maximum 20-30% of your trading capital — this is not the time for full size
Target: $72,000–$74,000 for a swing trade if breakout confirms
Scenario B: You Want to Go SHORT (Sell/Bearish Trade)
The trend on the 90-day chart is your friend
If BTC loses $65,000 support, short toward $60,000 is a valid thesis
Stop-loss above $68,500
Confirmation signal: BTC drops below $65,000 with high volume
Scenario C: You Are Unsure (Most Honest Answer for Current Market)
Stay in stablecoins (USDT) and wait for clarity
Use this time to set price alerts — if BTC breaks above $70,000, consider long; if it breaks below $65,000, consider short or wait
Capital preservation in extreme fear environments is a trade in itself
---
STEP 7 — Overall Verdict: Bullish or Bearish?
Timeframe Verdict Confidence
Right Now (hours) Neutral/Weak Bearish Medium
Short-term (1–2 weeks) Bearish High
Medium-term (1–3 months) Uncertain, watching $65K Medium
Long-term (6–12 months) Cautiously Bullish Medium
Bottom Line for the Trader
The market is in Extreme Fear with a bearish macro backdrop — trade wars, miner selling, whale distribution, and tight liquidity are all aligned against bulls right now. Gold is the clear winner in this environment. BTC is holding its ground but lacks the catalyst to break higher.
Do not FOMO into longs. Do not panic sell without a level. Have a plan, set alerts, protect your capital. The best trades in bear markets are often the ones you do NOT take.
> There will be clear opportunities — but right now, patience is the trade.
BULLISH or BEARISH? Full Market Breakdown — April 4, 2026
The Short Answer First
Currently BEARISH with selective safe-haven strength. The Fear & Greed Index is sitting at 11 out of 100 — Extreme Fear. That number alone tells you everything about the current market mood. Traders are scared, not greedy.
---
STEP 1 — The Big Picture: What Is Driving Markets Right Now?
Macro Environment (The Root Cause)
The single biggest factor crushing markets right now is Trump's sweeping tariff policy — essentially a modern version of the 1930 Smoot-Hawley tariffs that triggered the Great Depression. Here is what happened:
Trump announced massive tariffs on all major US trade partners
China immediately retaliated with counter-tariffs
This triggered a global risk-off sentiment — investors ran away from risk assets
Stock markets had their worst single-day drop since 2020
When stocks bleed, crypto usually bleeds harder. That is the current setup.
Liquidity Situation
The probability of a Fed rate cut in June dropped from 62% to 57% after tariff announcements
Less chance of rate cuts = tighter liquidity = less money flowing into risky assets like crypto
Oil prices are elevated (more on that below), which adds inflationary pressure and keeps the Fed cautious
---
STEP 2 — BTC Current Status
Metric Value
Current Price $67,006
24h High $67,352
24h Low $66,514
24h Change +0.3%
7-Day Change +1.5%
30-Day Change -1.6%
90-Day Change -28.6%
Reading this data honestly:
BTC is stuck in the $65,500 - $69,200 range — no strong breakout direction
The 90-day number of -28.6% tells you we are in a clear downtrend on the bigger timeframe
Short-term (7 days) shows +1.5% — just noise, not a trend reversal
Whales (1,000–10,000 BTC holders) have collectively sold 188,000 BTC over the past year — this is heavy bearish pressure from the top
Bitcoin miners like Riot Platforms are selling BTC to cover operational costs — miner capitulation is a classic late-bear-market signal
Michael Saylor's Strategy continues buying — but he is a long-term HODLer, not a signal for short-term direction
BTC Sentiment on X (Social Media):
Bullish authors: 78
Bearish authors: 31
Total discussing: 127
So Twitter/X is still roughly 2.5x more bullish than bearish on BTC — but social sentiment often lags price reality. Do not trade social media alone.
---
STEP 3 — ETH Current Status
Metric Value
Current Price $2,051
24h High $2,080
24h Low $2,041
24h Change -0.36%
7-Day Change +3.3%
30-Day Change +3.6%
90-Day Change -36.4%
ETH is underperforming BTC on the 90-day chart
The ETH/BTC pair is hovering near a critical macro support zone (around 0.0197 BTC) — this level previously marked macro bottoms in 2016 and 2019
Ethereum Foundation recently increased its staking to 70,000 ETH — showing confidence in the network
Schwab and BlackRock are planning to launch BTC and ETH spot trading in H1 2026 — this is a long-term bullish signal, not near-term
---
STEP 4 — METALS vs OIL vs BTC Comparison
This is the real comparison a trader needs to understand:
Gold (XAU/USD)
Fact Detail
Current Spot Price -$4,676 per ounce
Recent Performance +19.25% in past 3 months
Trend STRONGLY BULLISH
Gold is on an absolute monster run right now. Why? Because when there is geopolitical uncertainty, trade wars, and fear — money flows into gold as the ultimate safe haven. Institutions, governments, and retail traders are all piling into gold. Gold is doing its classic job perfectly.
Key message: Gold is the king of this current risk-off environment.
---
Crude Oil (WTI)
Fact Detail
Current WTI Price -$60–68 per barrel (near-term)
Trend BEARISH/WEAK
Key Driver Trade war fears crushing demand outlook
Oil is in a complicated spot:
Trade wars reduce global economic activity, which reduces oil demand
JP Morgan already cut its 2025 Brent forecast to $66/barrel (from $73)
OPEC+ supply decisions add further uncertainty
High oil prices hurt inflation → hurts crypto indirectly because the Fed stays hawkish
Oil is not a buy here for most traders — it is caught between supply pressure and weak demand outlook.
---
BTC vs Gold vs Oil — Who Wins in This Environment?
Asset Current Trend Safe Haven Status Short-Term
Gold Bullish Yes, classic Strong
Oil Weak/Bearish No Cautious
BTC Sideways/Bearish Partial (developing) Uncertain
BTC is trying to become a safe haven like gold, but it is not there yet. In a risk-off environment, gold wins. BTC still trades partly like a tech stock — when stocks fall, BTC falls with them. The 90-day -28.6% chart confirms this.
---
STEP 5 — Fear & Greed Index = 11 (Extreme Fear)
This is the most important single number right now.
What does 11/100 mean for a trader?
The market is oversold emotionally — people are panic-selling
Historically, extreme fear zones are buying opportunities, not selling zones — but timing matters
The legendary Warren Buffett principle: "Be greedy when others are fearful"
However: fear can stay at extreme levels for weeks or months before a reversal
Do NOT catch a falling knife just because fear is high
---
STEP 6 — TRADING TIPS for Trader Hazrat
If You Want to Trade RIGHT NOW — Here Is the Honest Advice:
Scenario A: You Want to Go LONG (Buy)
Wait for BTC to hold above $66,500 and show at least 2–3 daily closes above $68,000
Entry zone only if price breaks and holds above $70,000 — that would signal a real trend change
Use strict stop-loss below $65,000 — no exceptions
Position size should be maximum 20-30% of your trading capital — this is not the time for full size
Target: $72,000–$74,000 for a swing trade if breakout confirms
Scenario B: You Want to Go SHORT (Sell/Bearish Trade)
The trend on the 90-day chart is your friend
If BTC loses $65,000 support, short toward $60,000 is a valid thesis
Stop-loss above $68,500
Confirmation signal: BTC drops below $65,000 with high volume
Scenario C: You Are Unsure (Most Honest Answer for Current Market)
Stay in stablecoins (USDT) and wait for clarity
Use this time to set price alerts — if BTC breaks above $70,000, consider long; if it breaks below $65,000, consider short or wait
Capital preservation in extreme fear environments is a trade in itself
---
STEP 7 — Overall Verdict: Bullish or Bearish?
Timeframe Verdict Confidence
Right Now (hours) Neutral/Weak Bearish Medium
Short-term (1–2 weeks) Bearish High
Medium-term (1–3 months) Uncertain, watching $65K Medium
Long-term (6–12 months) Cautiously Bullish Medium
Bottom Line for the Trader
The market is in Extreme Fear with a bearish macro backdrop — trade wars, miner selling, whale distribution, and tight liquidity are all aligned against bulls right now. Gold is the clear winner in this environment. BTC is holding its ground but lacks the catalyst to break higher.
Do not FOMO into longs. Do not panic sell without a level. Have a plan, set alerts, protect your capital. The best trades in bear markets are often the ones you do NOT take.
> There will be clear opportunities — but right now, patience is the trade.