Trade
Basic
Futures
Futures
Hundreds of contracts settled in USDT or BTC
Options
HOT
Trade European-style vanilla options
Unified Account
Maximize your capital efficiency
Demo Trading
Futures Kickoff
Get prepared for your futures trading
Futures Events
Participate in events to win generous rewards
Demo Trading
Use virtual funds to experience risk-free trading
Earn
Launch
CandyDrop
Collect candies to earn airdrops
Launchpool
Quick staking, earn potential new tokens
HODLer Airdrop
Hold GT and get massive airdrops for free
Launchpad
Be early to the next big token project
Alpha Points
NEW
Trade on-chain assets and enjoy airdrop rewards!
Futures Points
NEW
Earn futures points and claim airdrop rewards
Investment
Simple Earn
Earn interests with idle tokens
Auto-Invest
Auto-invest on a regular basis
Dual Investment
Buy low and sell high to take profits from price fluctuations
Soft Staking
Earn rewards with flexible staking
Crypto Loan
0 Fees
Pledge one crypto to borrow another
Lending Center
One-stop lending hub
VIP Wealth Hub
Customized wealth management empowers your assets growth
Private Wealth Management
Customized asset management to grow your digital assets
Quant Fund
Top asset management team helps you profit without hassle
Staking
Stake cryptos to earn in PoS products
Smart Leverage
NEW
No forced liquidation before maturity, worry-free leveraged gains
GUSD Minting
Use USDT/USDC to mint GUSD for treasury-level yields
More
K线猎手西哥
No content yet
K线猎手西哥
Recent Directions of Double Coins and Today's Trading Strategy
Since January 6th, Ethereum has shown a volatile upward trend over the past two days, gradually breaking through from around 3100 to approximately 3260. The daily chart has formed a series of consecutive bullish candles, stabilizing above the 3200 key level.
The short-term upward trend is clear, but bullish momentum has weakened, and four-hour charts indicate signs of consolidation.
Support levels are primarily focused on the 3180-3200 range, followed by the recent low points at 3130-3150.
Deep support is at the 3000 level. R
ETH-4,19%


- Reward
- like
- Comment
- Repost
- Share
Bitcoin Recent Trends and Today's Trading Strategy
In the past two days, Bitcoin has been oscillating at high levels, gradually climbing from around 92,500 to approximately 93,300. The daily chart shows consecutive bullish candles, and on the 4-hour chart, the momentum remains high. Currently, the price is about 93,000, indicating a strong trend but with caution for selling pressure. The key support levels are at 92,200-92,500, followed by 91,800-92,000, with a strong support at 91,000-91,300. Resistance is concentrated at 93,300-93,500, 93,800-94,000, and the previous high at 94,500.
Today's
BTC-2,63%


- Reward
- like
- Comment
- Repost
- Share
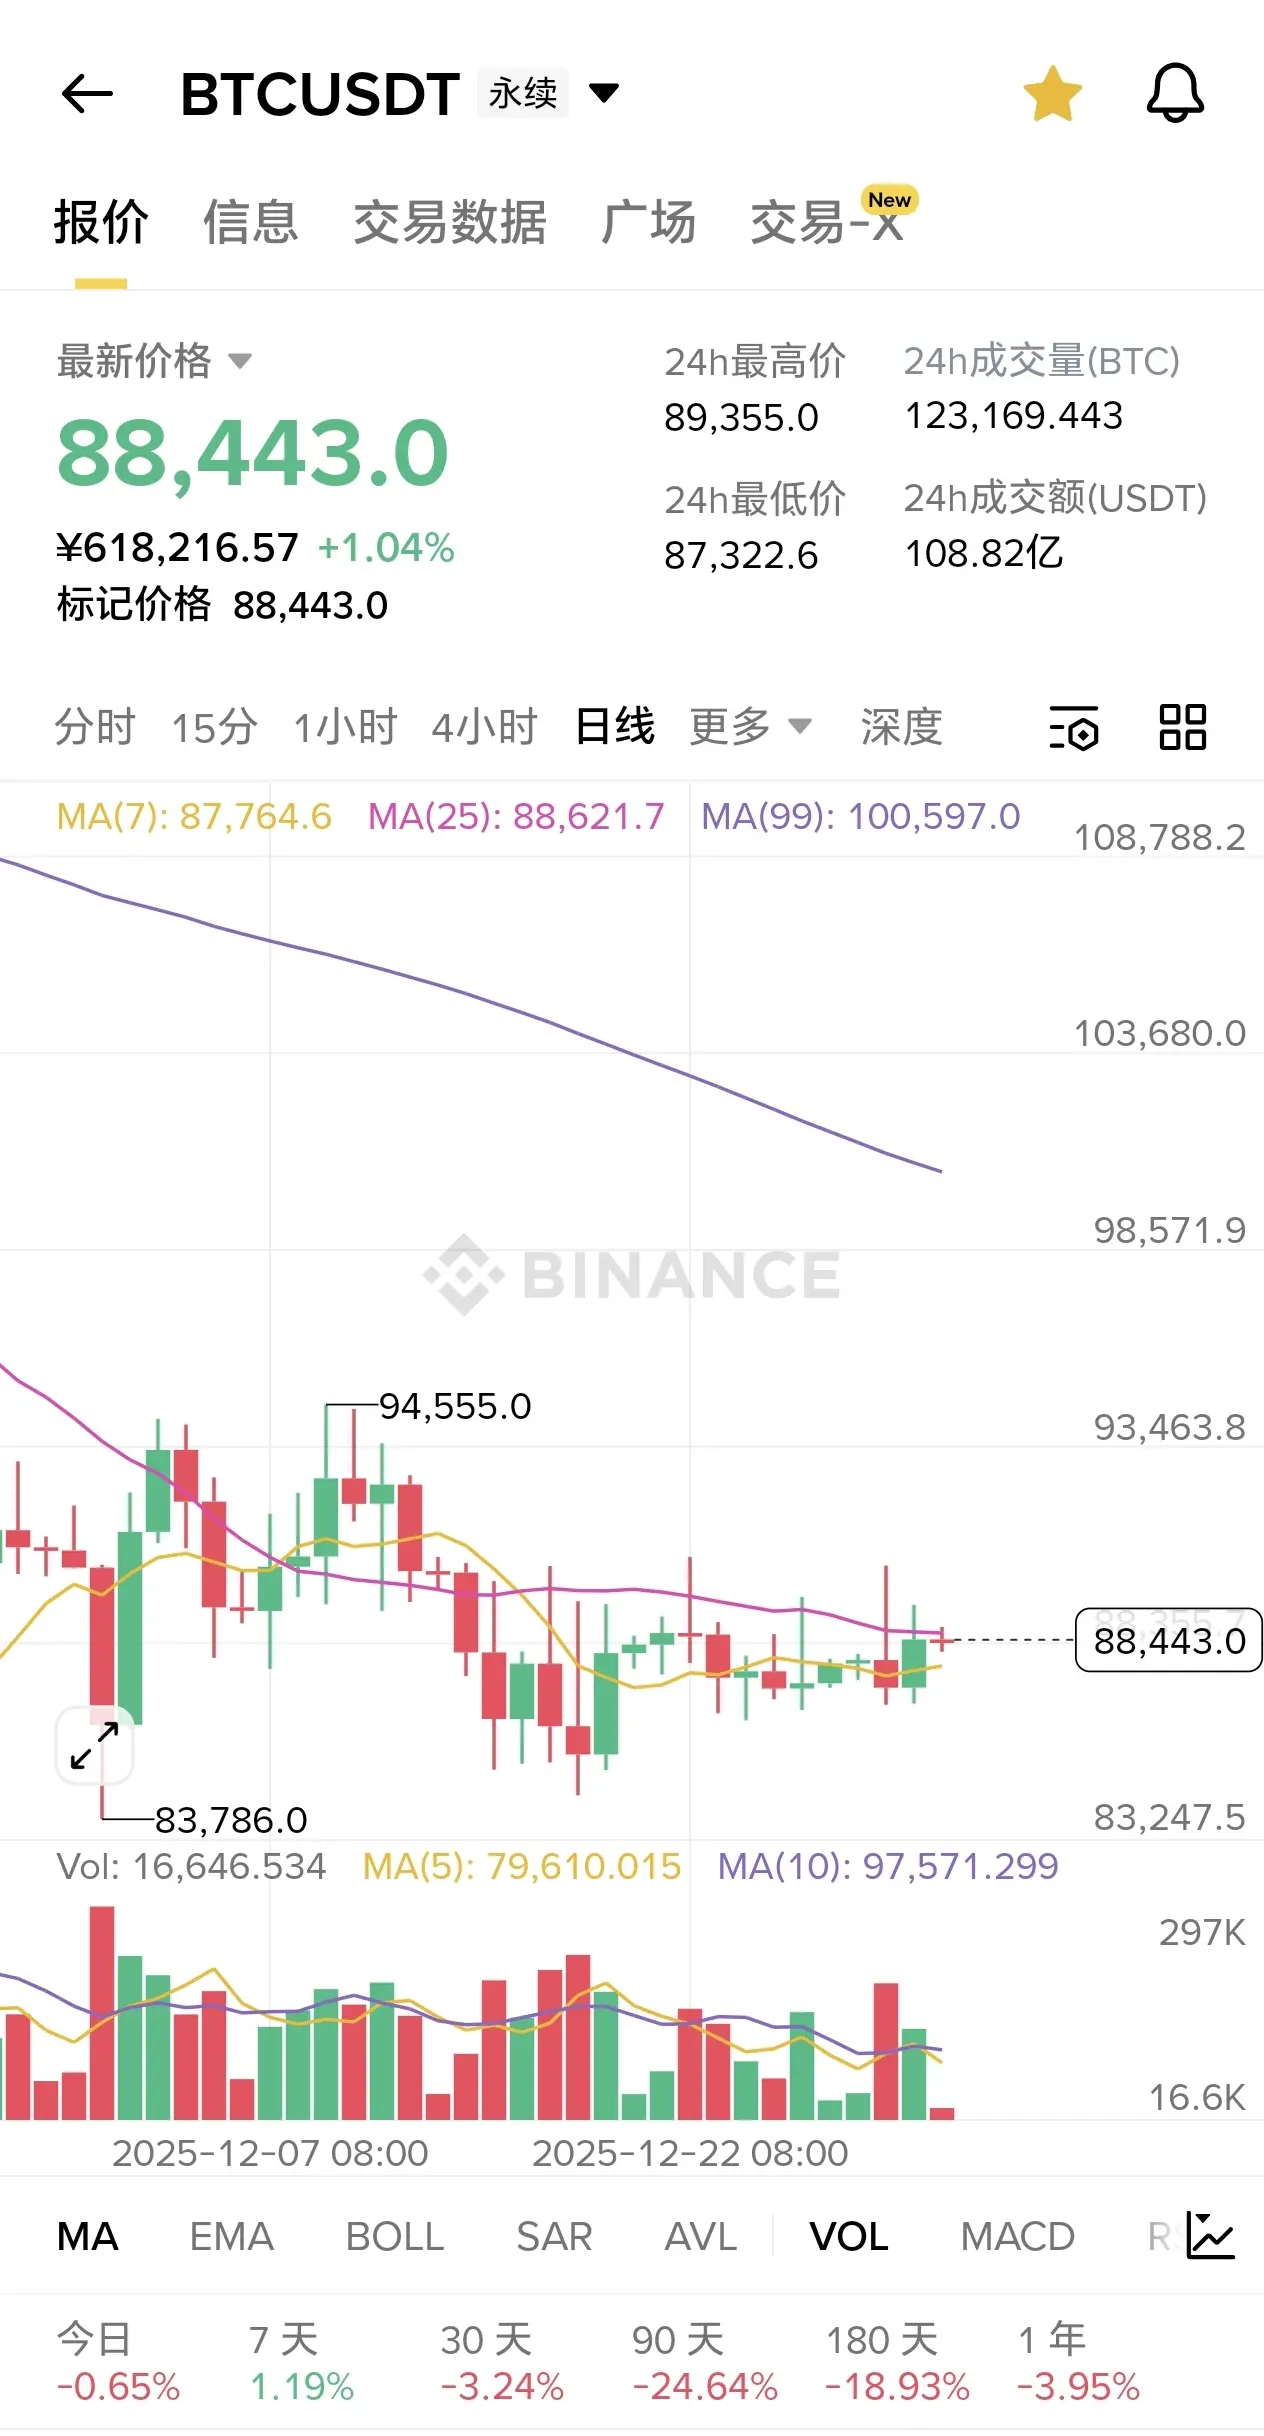
Bitcoin recent trend analysis and trading strategy for January 1, 2026 (New Year's Day)
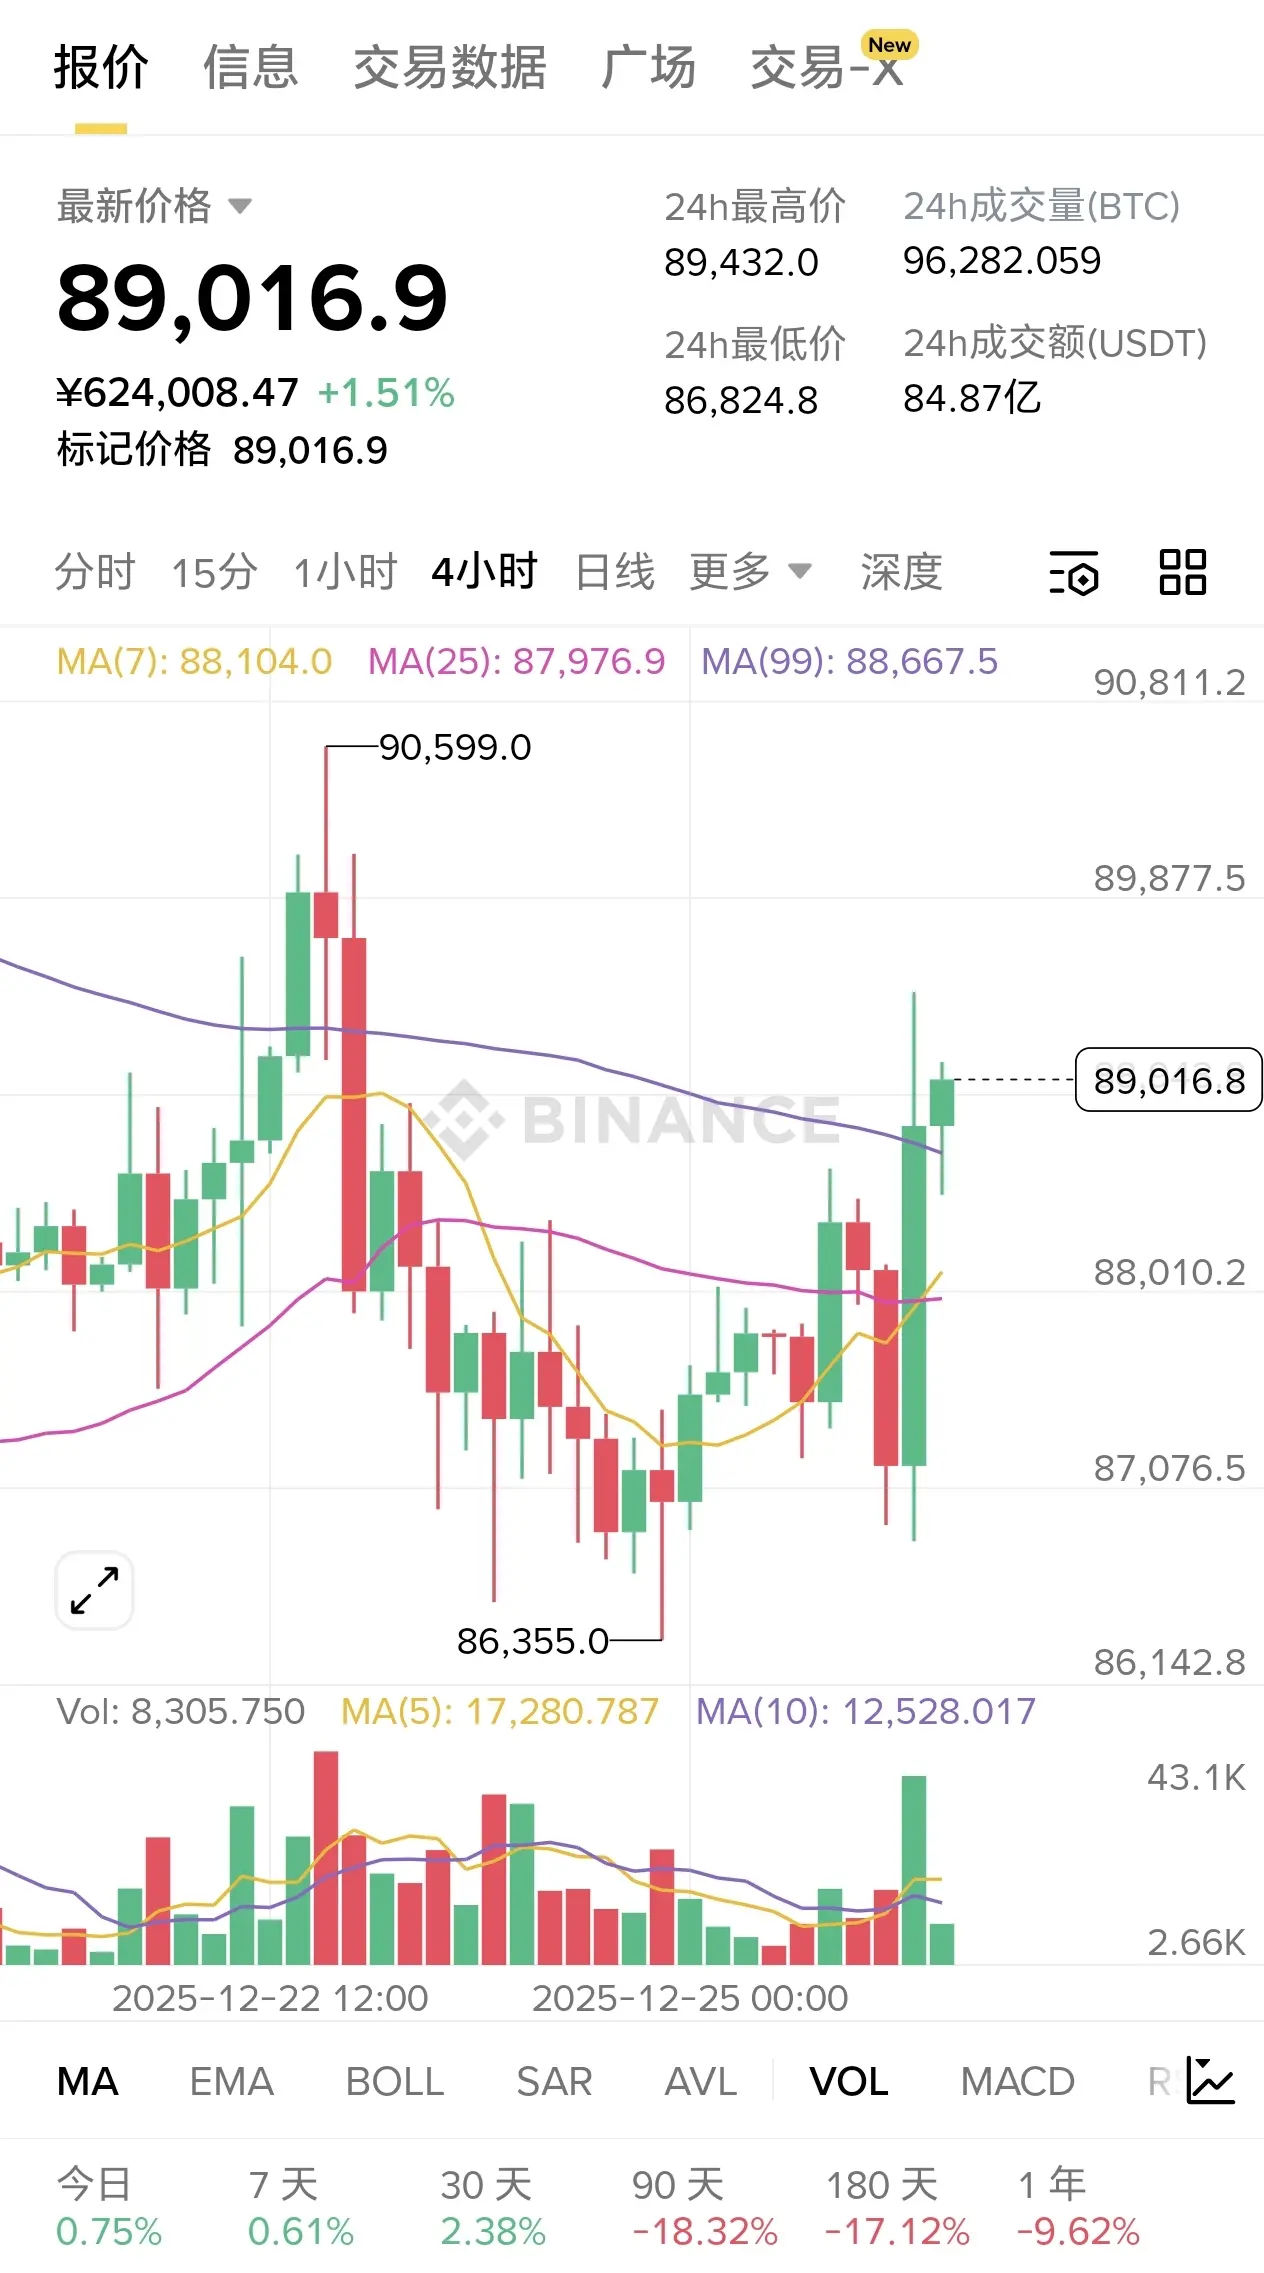
In the past two days, Bitcoin has shown a narrow range of oscillation and decline. After multiple failed attempts to break through the $90,000 level, it has been trading within the $87,000-$89,500 range, currently oscillating around $88,000. The daily chart is under the pressure of the EMA30 moving average, with the MACD maintaining a death cross, indicating a clear long-term bearish trend. However, buying interest around $87,000 is gradually strengthening, and the RSI shows weakening downward momentum, sug
View OriginalIn the past two days, Bitcoin has shown a narrow range of oscillation and decline. After multiple failed attempts to break through the $90,000 level, it has been trading within the $87,000-$89,500 range, currently oscillating around $88,000. The daily chart is under the pressure of the EMA30 moving average, with the MACD maintaining a death cross, indicating a clear long-term bearish trend. However, buying interest around $87,000 is gradually strengthening, and the RSI shows weakening downward momentum, sug

- Reward
- like
- 4
- Repost
- Share
K线猎手西哥:
3View More
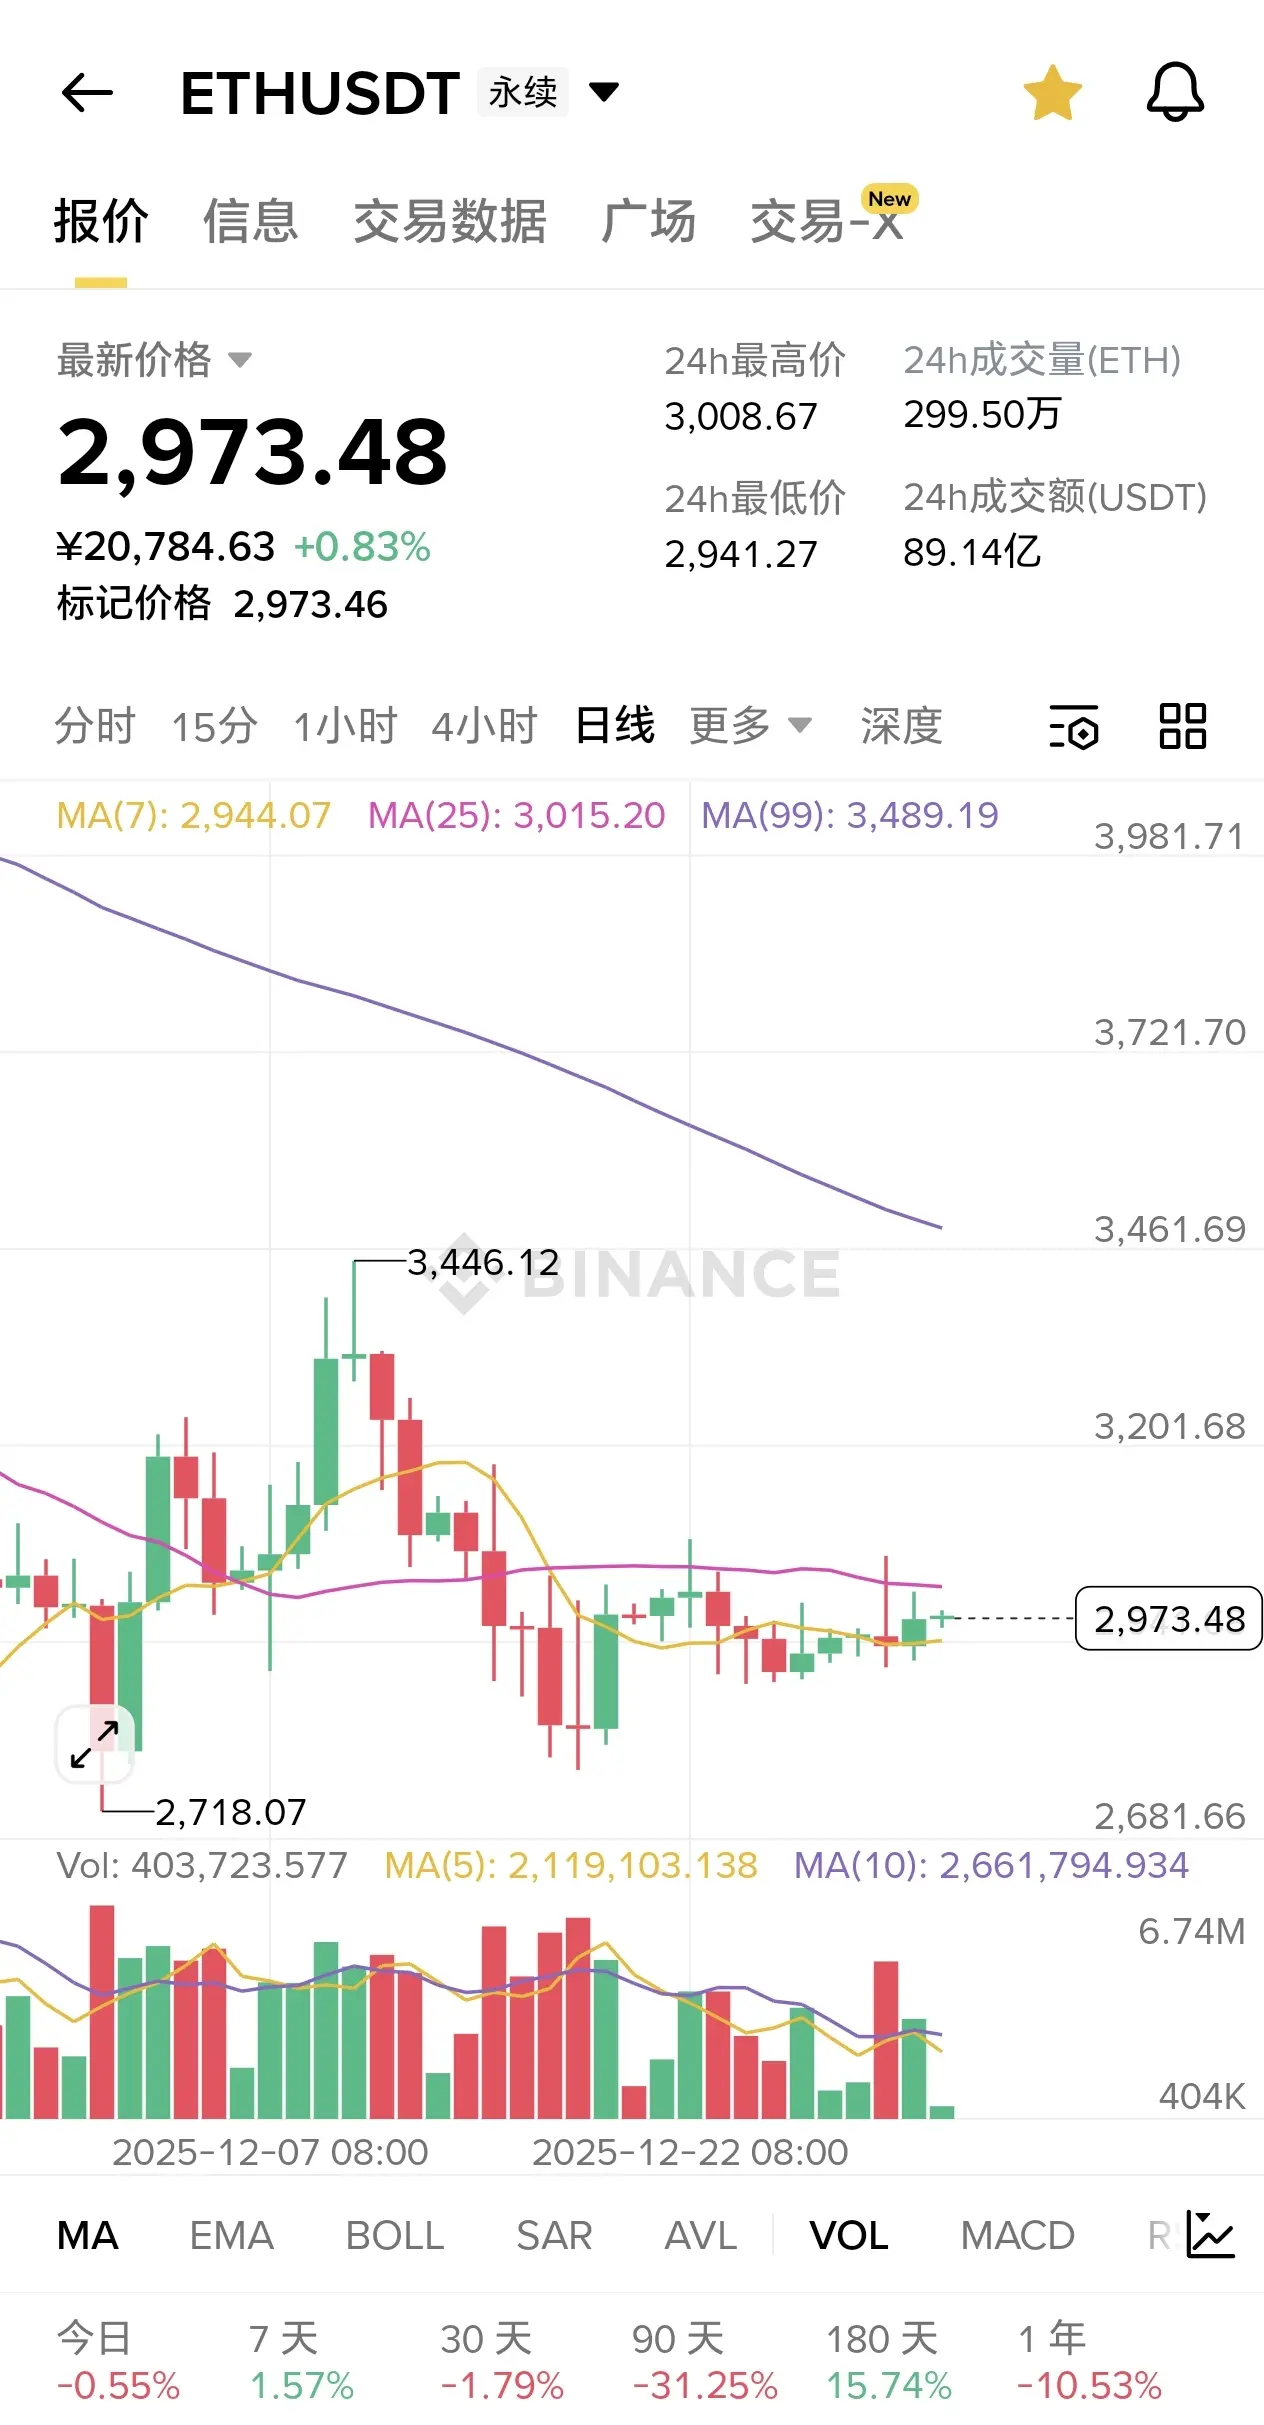
Analysis of Recent Trends of the Double Coin and Trading Strategies for January 1, 2026 (New Year's Day)
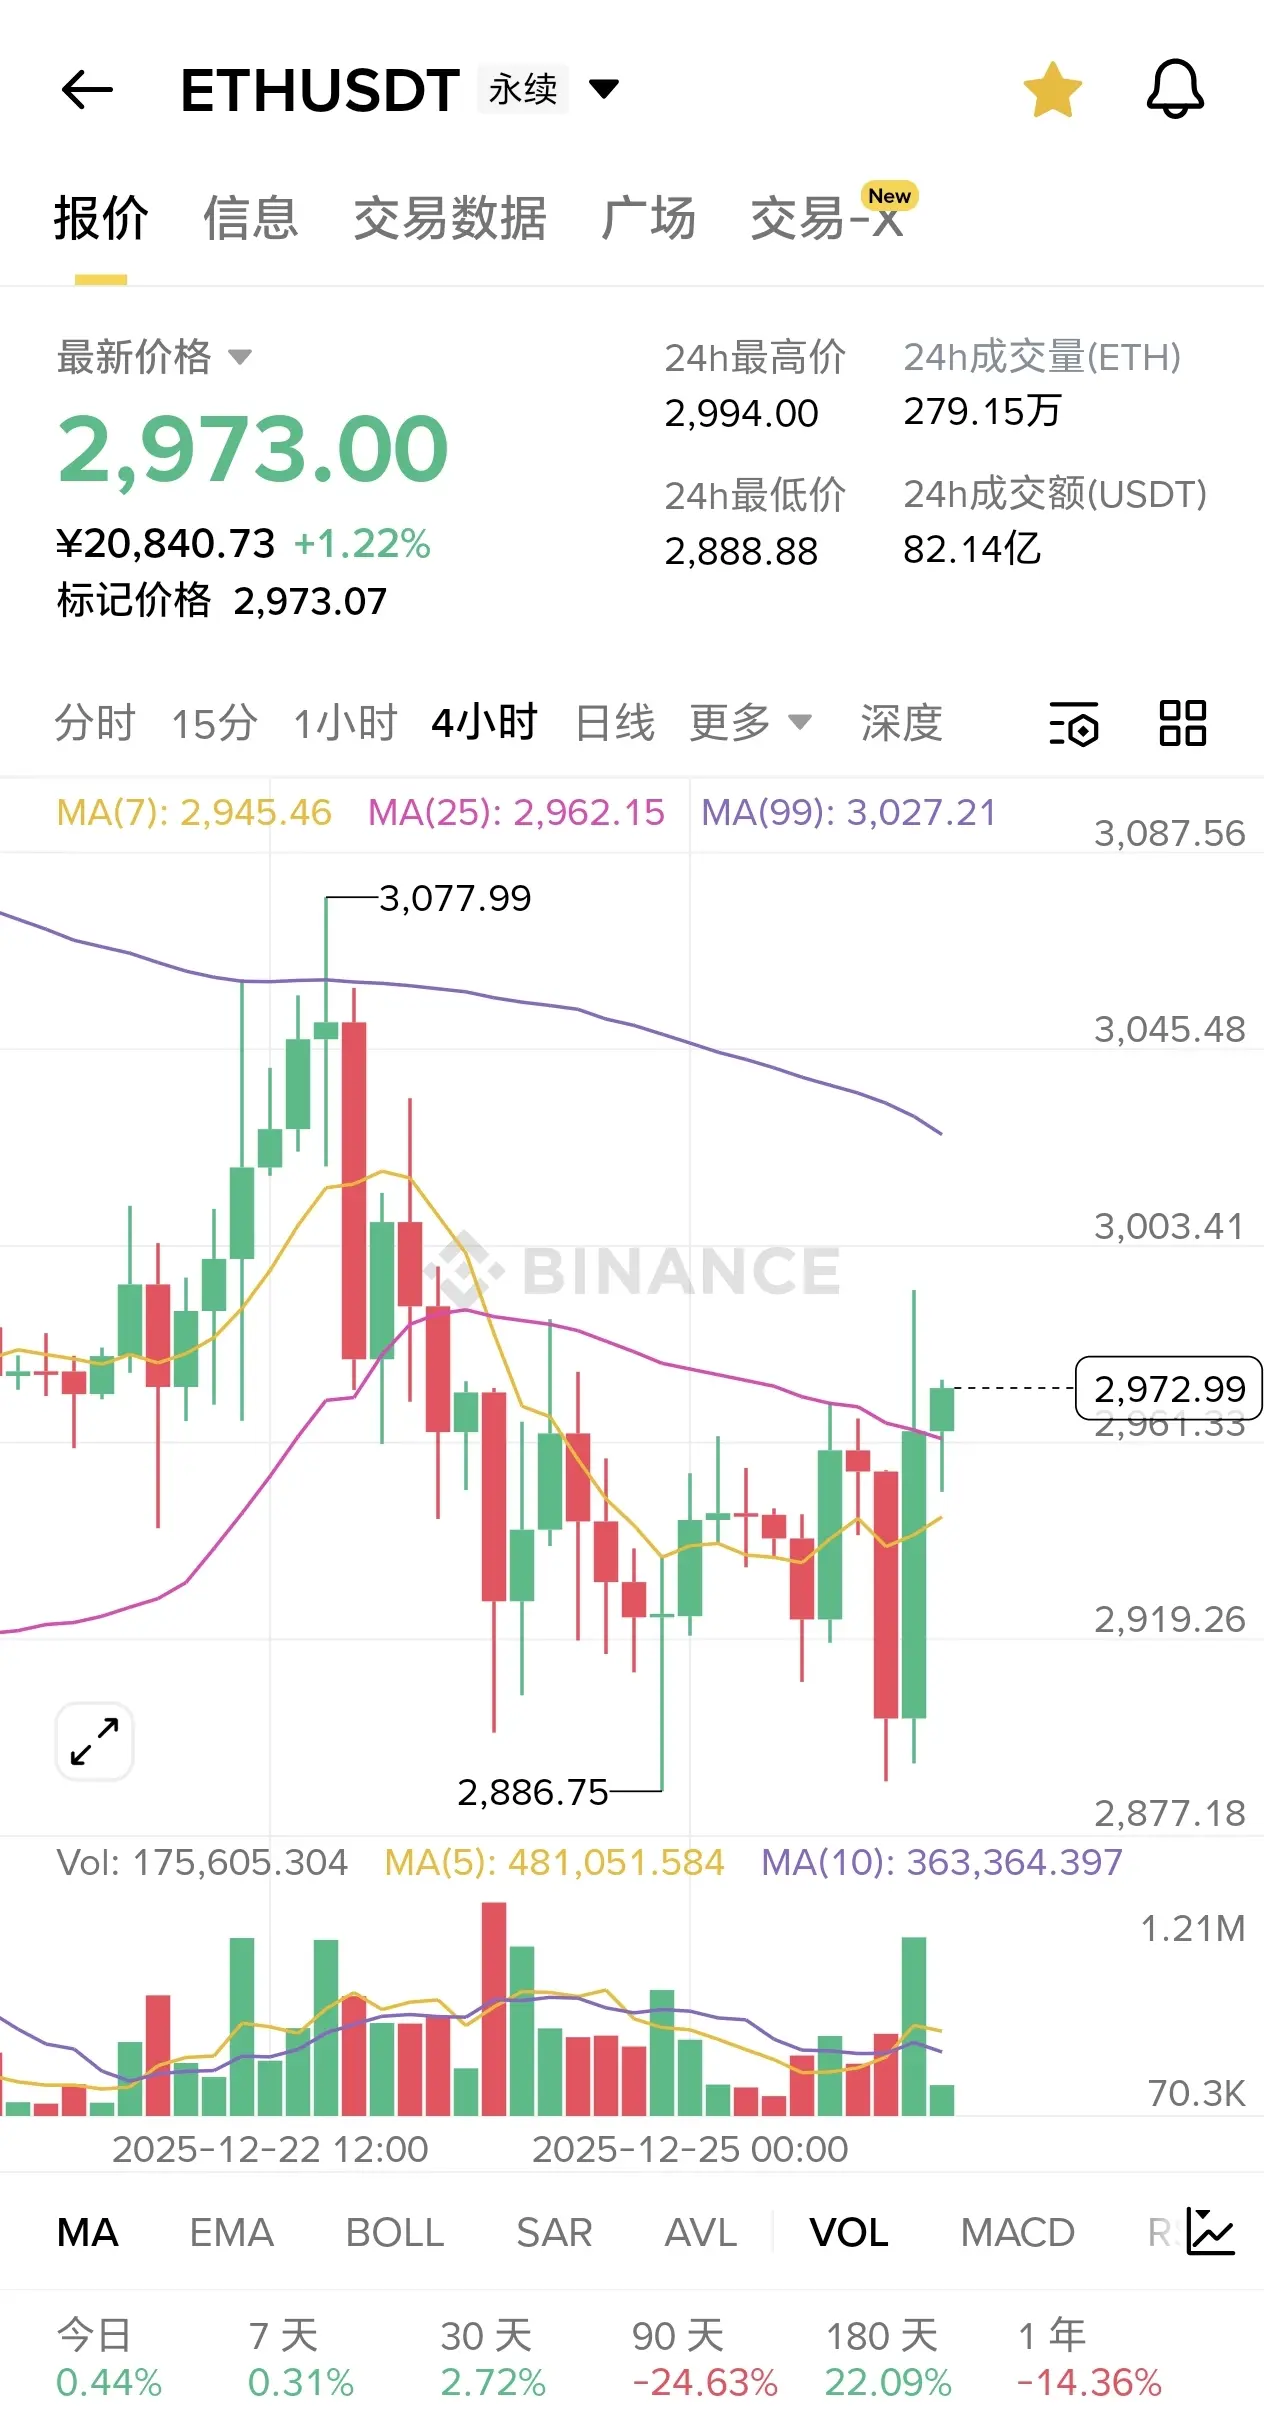
In the past two days, the Double Coin has shown a pattern of weak oscillation and rebound followed by a decline, trading within the range of $2900-$3002: initially rebounding near $2900 to reach $3002, but lacking sustained buying support, it quickly retreated. Currently, it is oscillating around $2970, with the daily chart still under long-term downward trendline resistance and below multiple moving averages, indicating that the bearish pressure has not been fully released. Institutional a
View OriginalIn the past two days, the Double Coin has shown a pattern of weak oscillation and rebound followed by a decline, trading within the range of $2900-$3002: initially rebounding near $2900 to reach $3002, but lacking sustained buying support, it quickly retreated. Currently, it is oscillating around $2970, with the daily chart still under long-term downward trendline resistance and below multiple moving averages, indicating that the bearish pressure has not been fully released. Institutional a

- Reward
- like
- 3
- Repost
- Share
K线猎手西哥:
View More
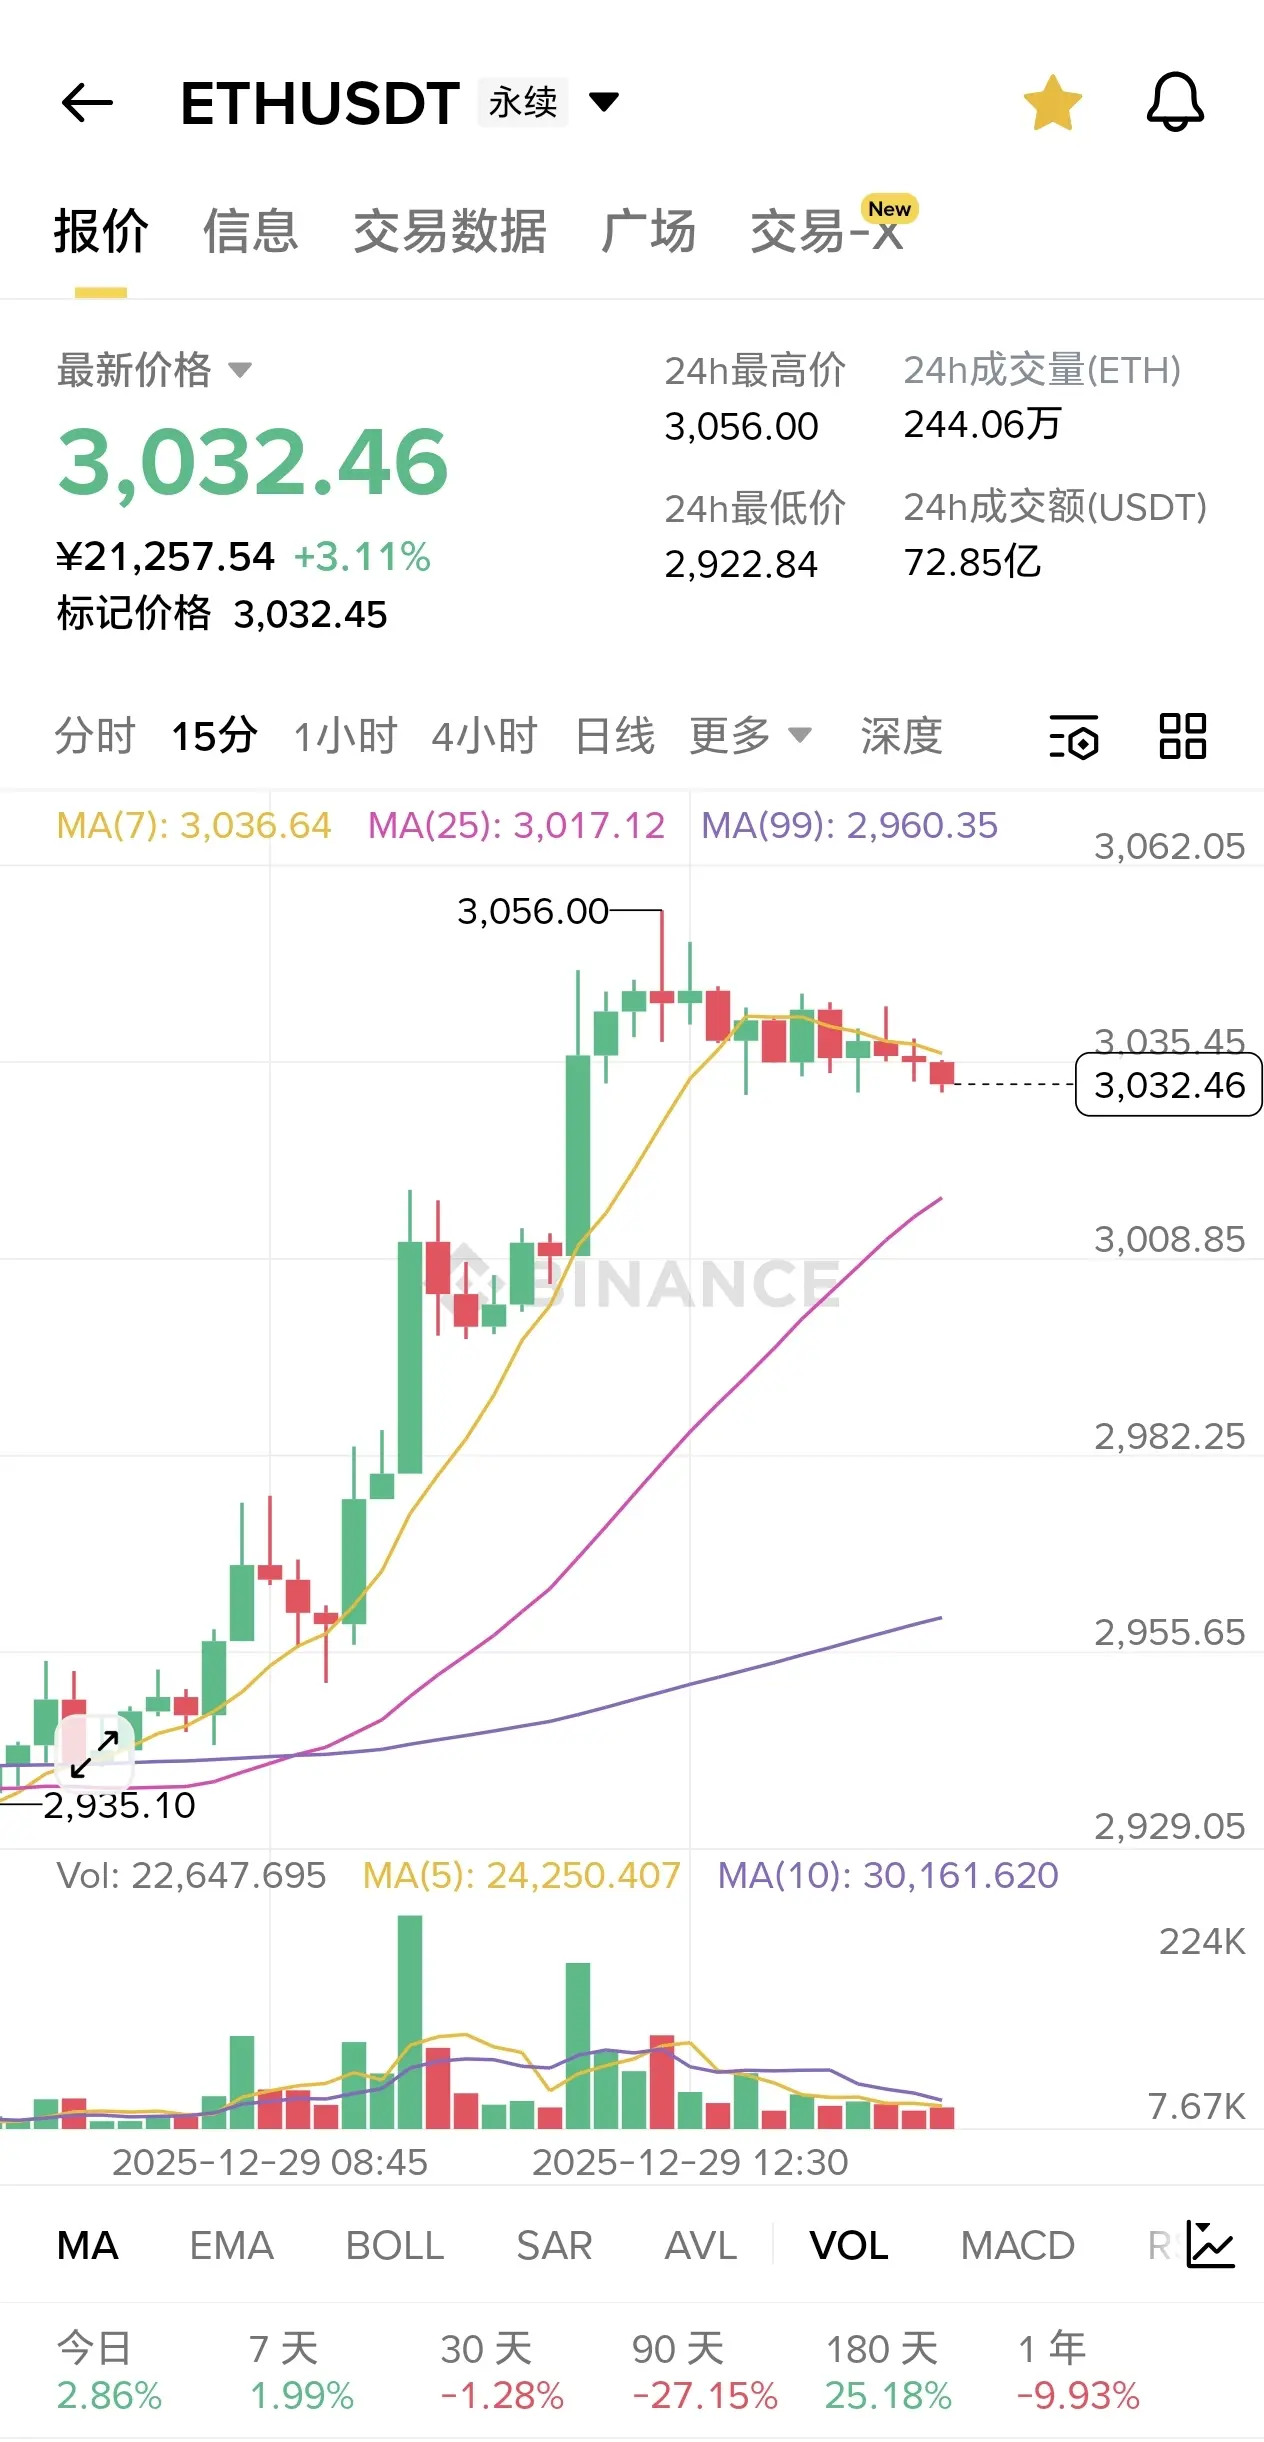
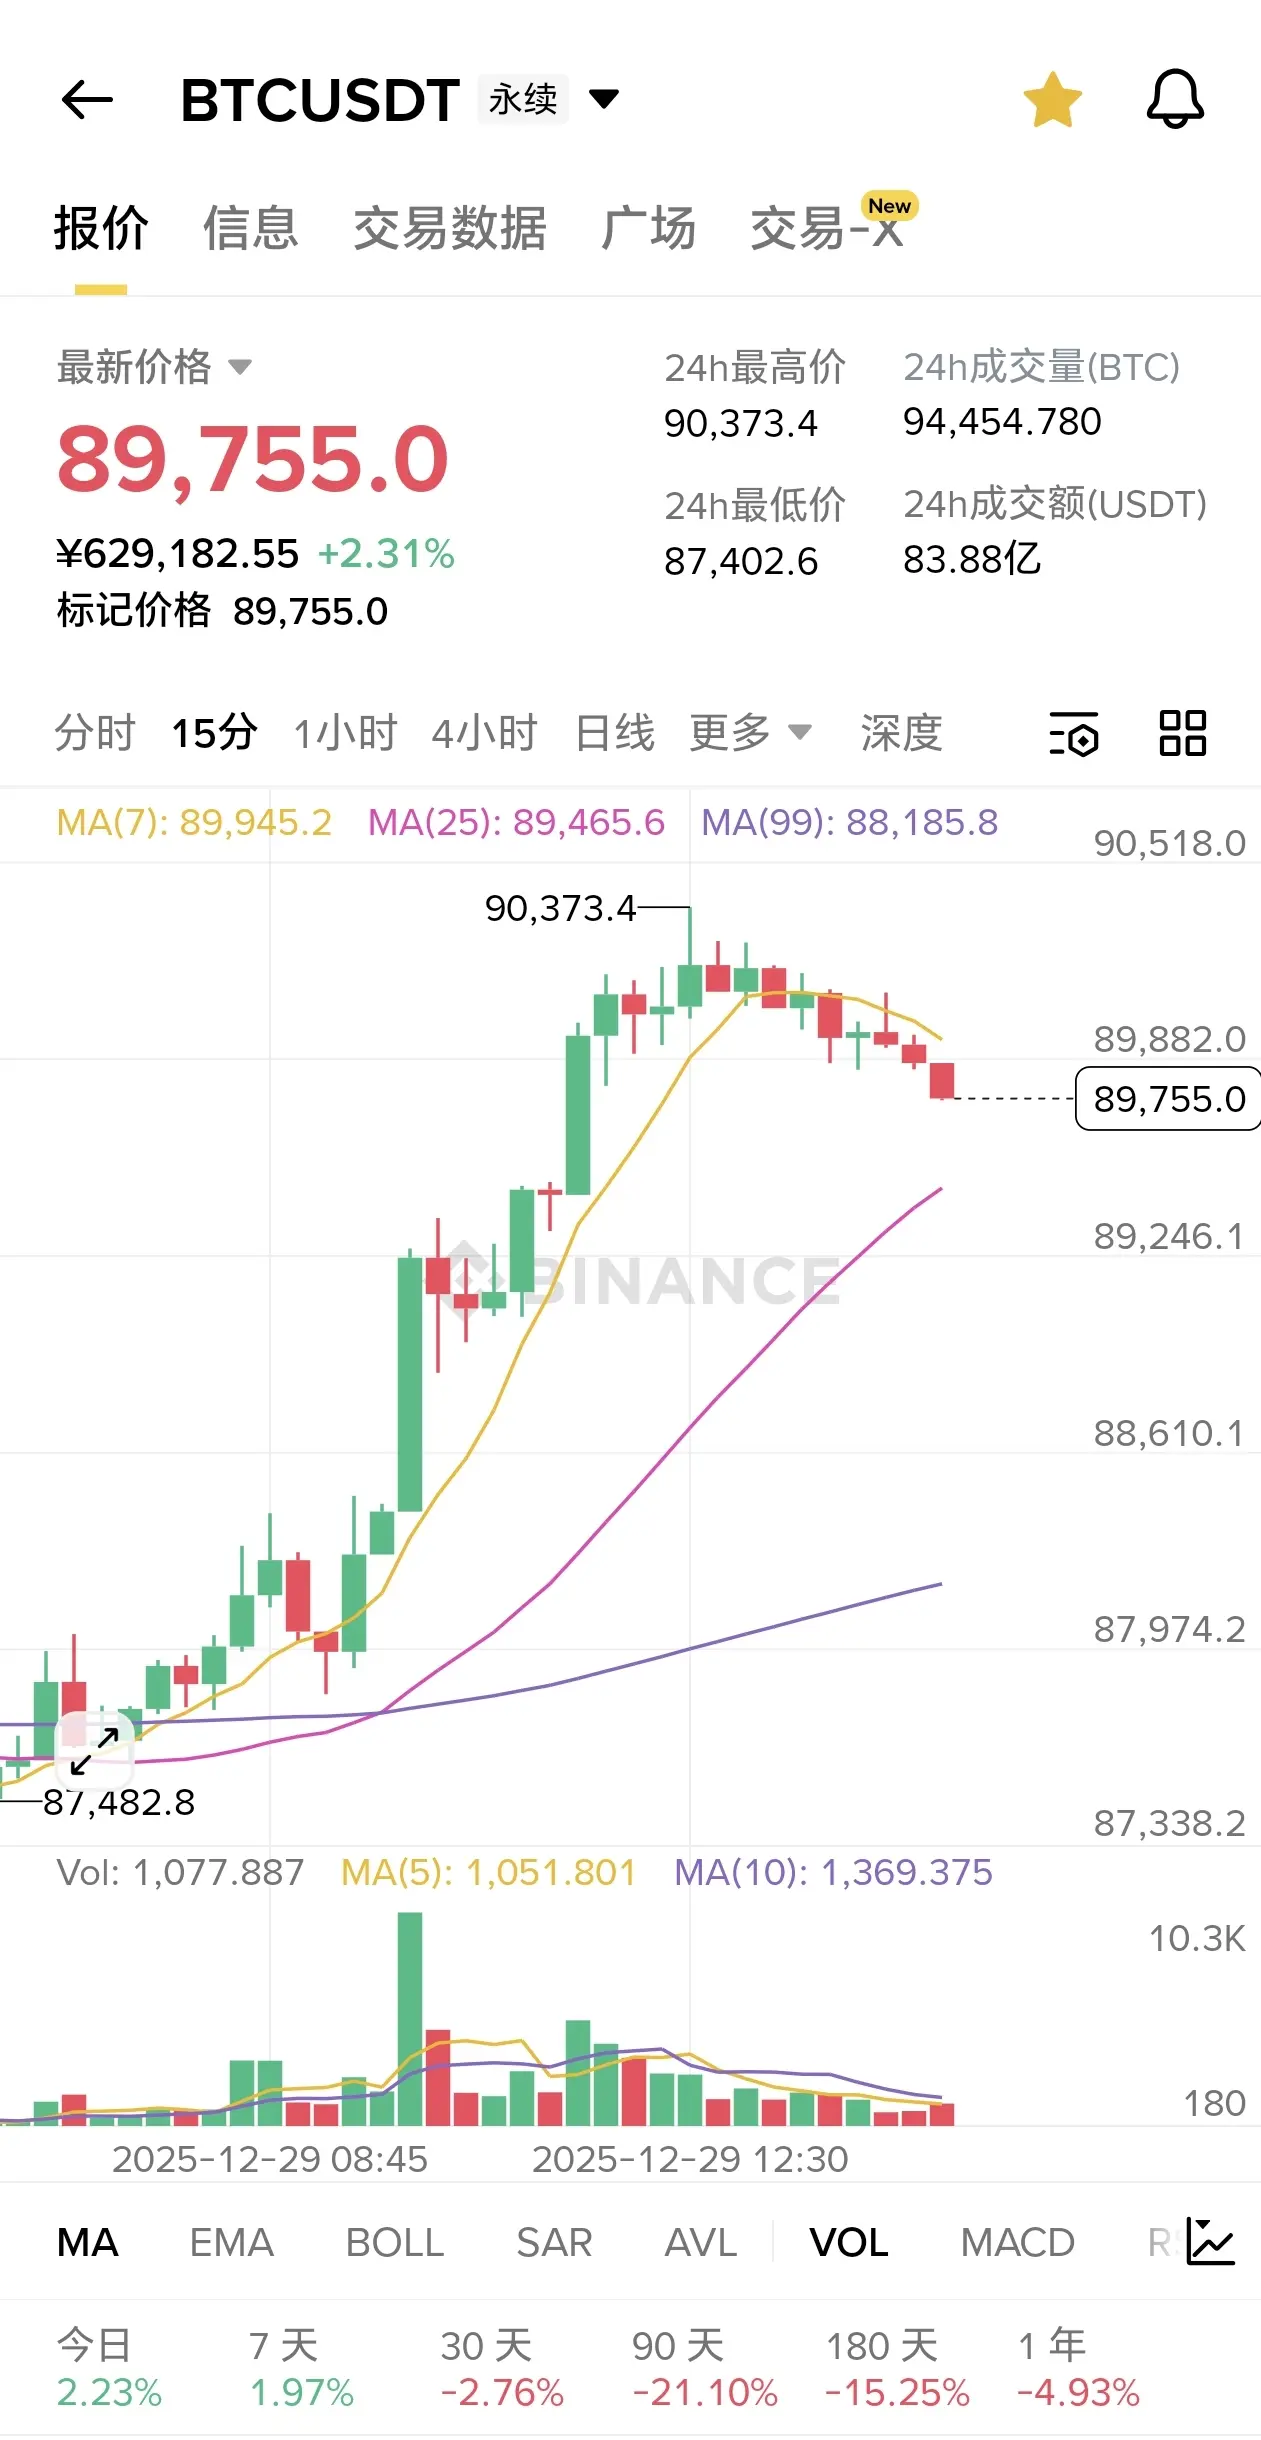
December 29th Cryptocurrency Market Holiday行情:Price-Volume Divergence Opportunities and Risks
Core Viewpoint: Mainstream coins are strengthening against the trend, ETF funds continue to flow out, and the market shows short-term differentiation under low liquidity conditions.
1. Mainstream Coins Break Through, Resilience Highlights
- Bitcoin: Intraday increase of 1.21%, successfully breaking above the $89,000 level, then oscillating in the $87,000-$88,000 range, with increased volatility.
- Ethereum: Intraday increase of 1.74%, breaking through the $3,000 mark, currently at $3,002, then pulling
View OriginalCore Viewpoint: Mainstream coins are strengthening against the trend, ETF funds continue to flow out, and the market shows short-term differentiation under low liquidity conditions.
1. Mainstream Coins Break Through, Resilience Highlights
- Bitcoin: Intraday increase of 1.21%, successfully breaking above the $89,000 level, then oscillating in the $87,000-$88,000 range, with increased volatility.
- Ethereum: Intraday increase of 1.74%, breaking through the $3,000 mark, currently at $3,002, then pulling
- Reward
- like
- 3
- Repost
- Share
K线猎手西哥:
2View More
Midday Double Candle Trend Analysis and Strategy
December 26th, ETH 4-hour K-line shows weak consolidation, current price around 2905, range 2890-2960, MACD below zero line with a golden cross, low trading volume, bears are dominant.
Key Levels
Support: 2890 (previous low + 4-hour lower band), 2870 (integer threshold)
Resistance: 2940 (4-hour EMA30), 2960 (previous high)
Trading Strategy
1. Long Positions: Light positions at 2890-2900, stop loss at 2860, target 2930-2940, if volume breaks 2940, look for 2950-2960, no volume then take profit and exit.
2. Short Positions: Light positions at 2940
View OriginalDecember 26th, ETH 4-hour K-line shows weak consolidation, current price around 2905, range 2890-2960, MACD below zero line with a golden cross, low trading volume, bears are dominant.
Key Levels
Support: 2890 (previous low + 4-hour lower band), 2870 (integer threshold)
Resistance: 2940 (4-hour EMA30), 2960 (previous high)
Trading Strategy
1. Long Positions: Light positions at 2890-2900, stop loss at 2860, target 2930-2940, if volume breaks 2940, look for 2950-2960, no volume then take profit and exit.
2. Short Positions: Light positions at 2940
- Reward
- like
- Comment
- Repost
- Share
Bitcoin Afternoon Trend Analysis and Strategy
December 26th, 14:00, BTC 4-hour K-line shows weak oscillation, current price around 87400, key range 86800-88500, 4-hour MACD below zero line with a golden cross, volume is relatively weak, bears are dominant.
Key Levels
Support: 86800 (previous low + long lower shadow), 87000 (psychological level)
- Resistance: 87800 (4-hour EMA30), 88500 (previous high)
Trading Strategy
1. Short-term Long: Light position long at 86800-87000, stop loss at 86300, target 87600-87800, break above 88200-88500 with volume increase to chase longs, otherwise take prof
View OriginalDecember 26th, 14:00, BTC 4-hour K-line shows weak oscillation, current price around 87400, key range 86800-88500, 4-hour MACD below zero line with a golden cross, volume is relatively weak, bears are dominant.
Key Levels
Support: 86800 (previous low + long lower shadow), 87000 (psychological level)
- Resistance: 87800 (4-hour EMA30), 88500 (previous high)
Trading Strategy
1. Short-term Long: Light position long at 86800-87000, stop loss at 86300, target 87600-87800, break above 88200-88500 with volume increase to chase longs, otherwise take prof
- Reward
- like
- Comment
- Repost
- Share
Midday Double Candle Trend Analysis and Strategy
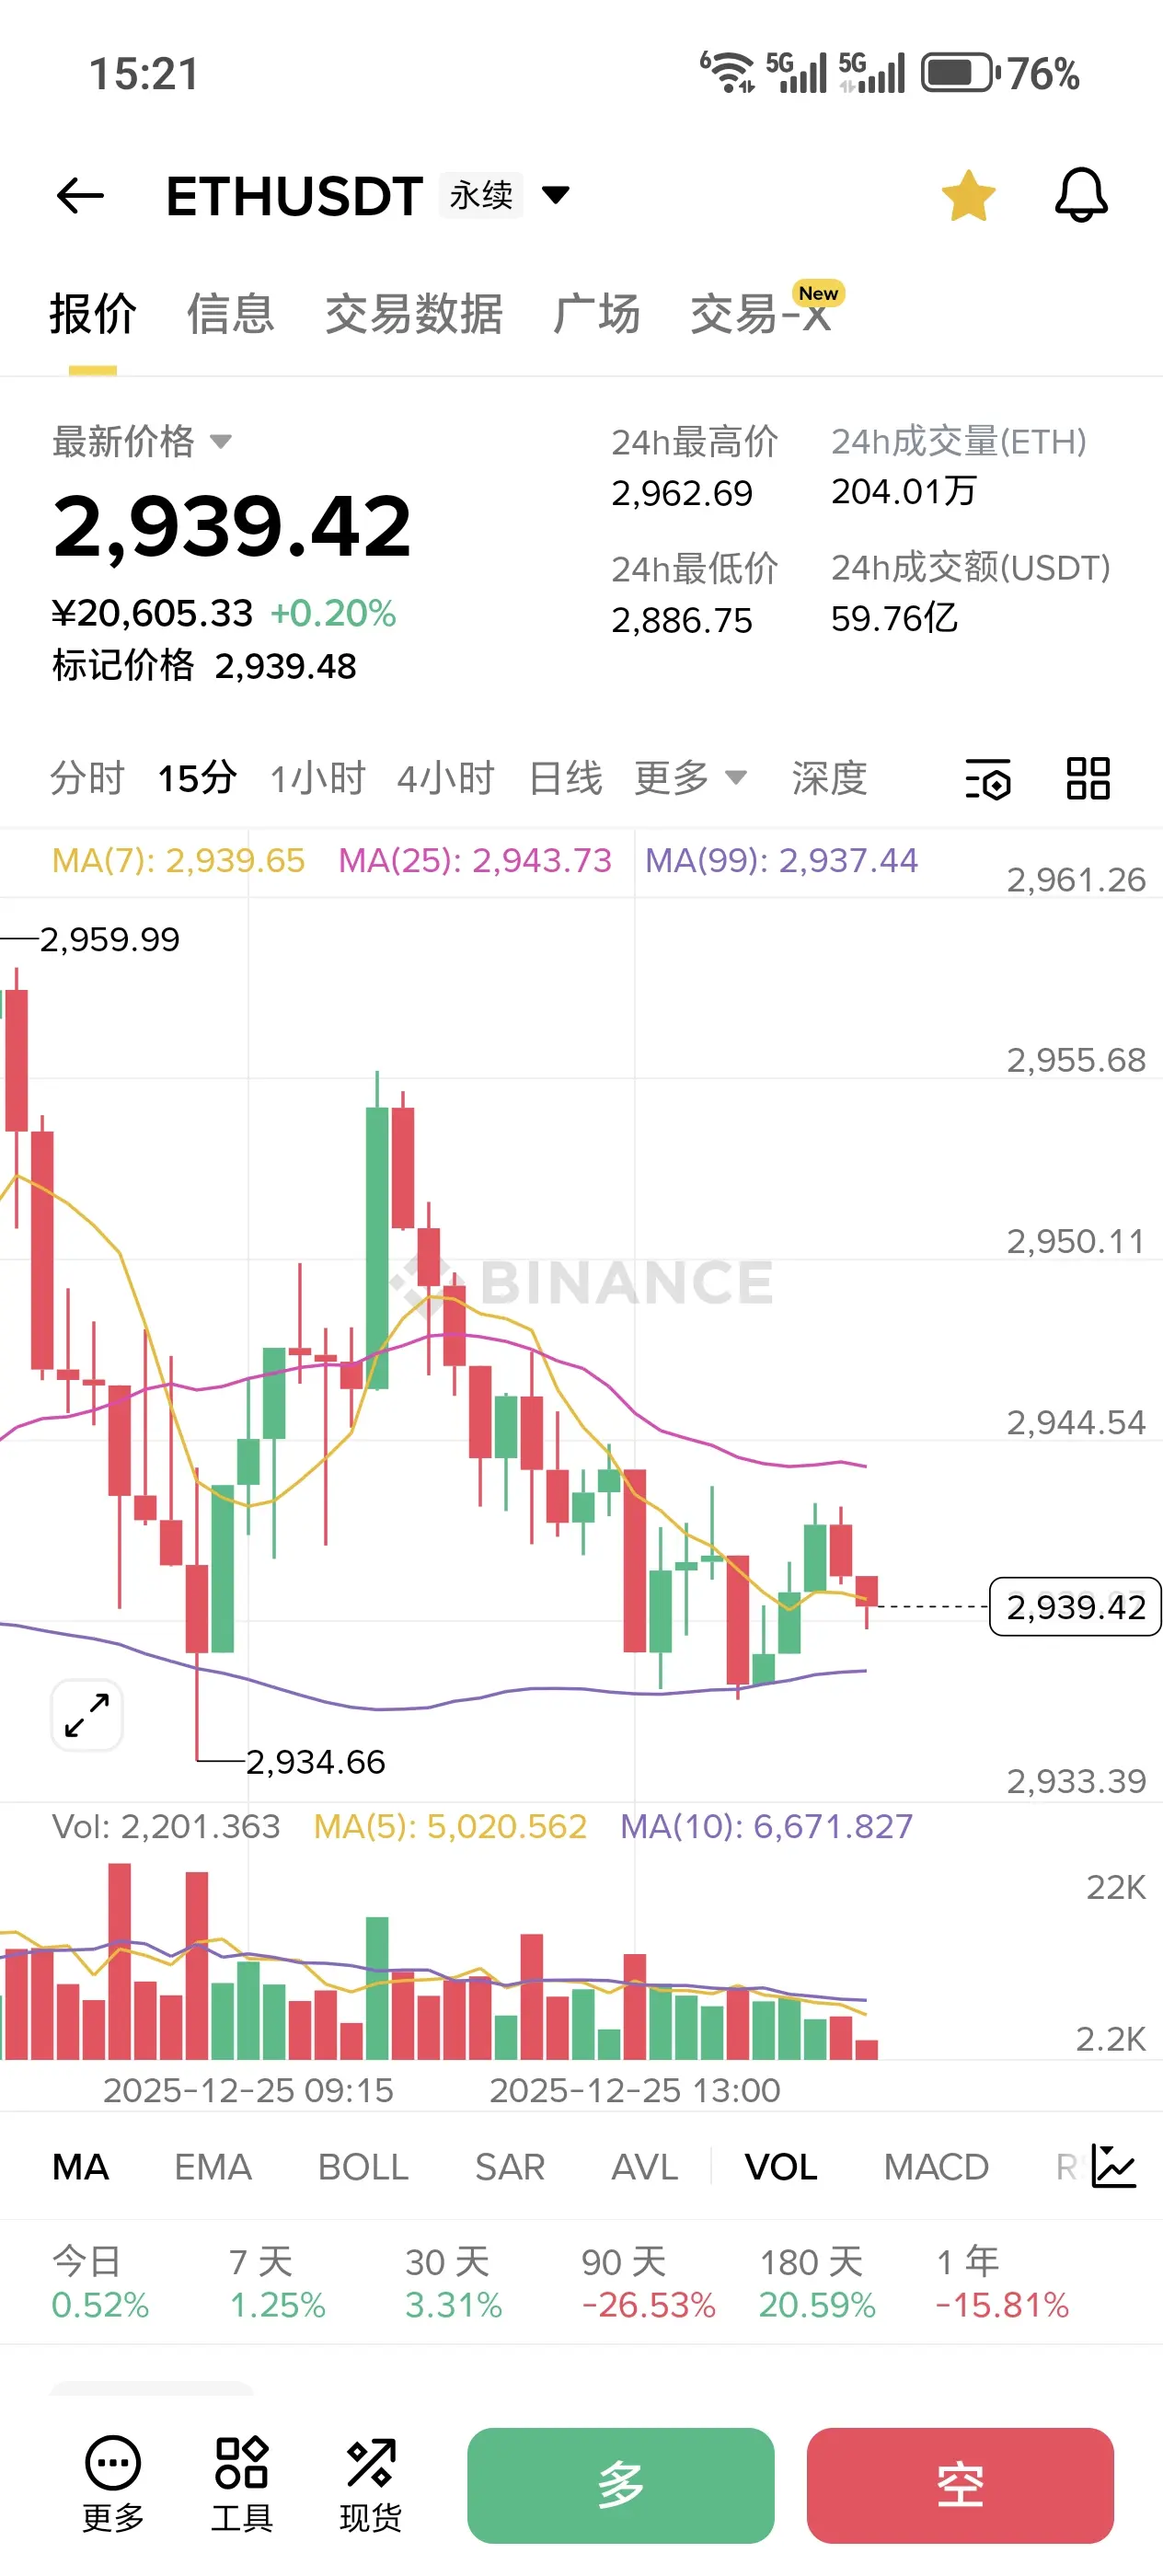
Today (December 25), Ethereum's 15-minute K-line shows a shrinking volume consolidation, rebounding after testing the $2880 low, currently hovering around $2940. The Bollinger Bands are narrowing, RSI is in the neutral zone, and MACD bullish momentum is weak, with insufficient rebound volume to break the high.
In the short term, focus on range-bound trading with high sell and low buy. Light positions can be opened long at the support zone of $2890-$2910, with a stop loss set at $2870 and take profit at $2955-$2970; for short positions, open ligh
View OriginalToday (December 25), Ethereum's 15-minute K-line shows a shrinking volume consolidation, rebounding after testing the $2880 low, currently hovering around $2940. The Bollinger Bands are narrowing, RSI is in the neutral zone, and MACD bullish momentum is weak, with insufficient rebound volume to break the high.
In the short term, focus on range-bound trading with high sell and low buy. Light positions can be opened long at the support zone of $2890-$2910, with a stop loss set at $2870 and take profit at $2955-$2970; for short positions, open ligh
- Reward
- like
- Comment
- Repost
- Share
Ethereum Midday Analysis Strategy
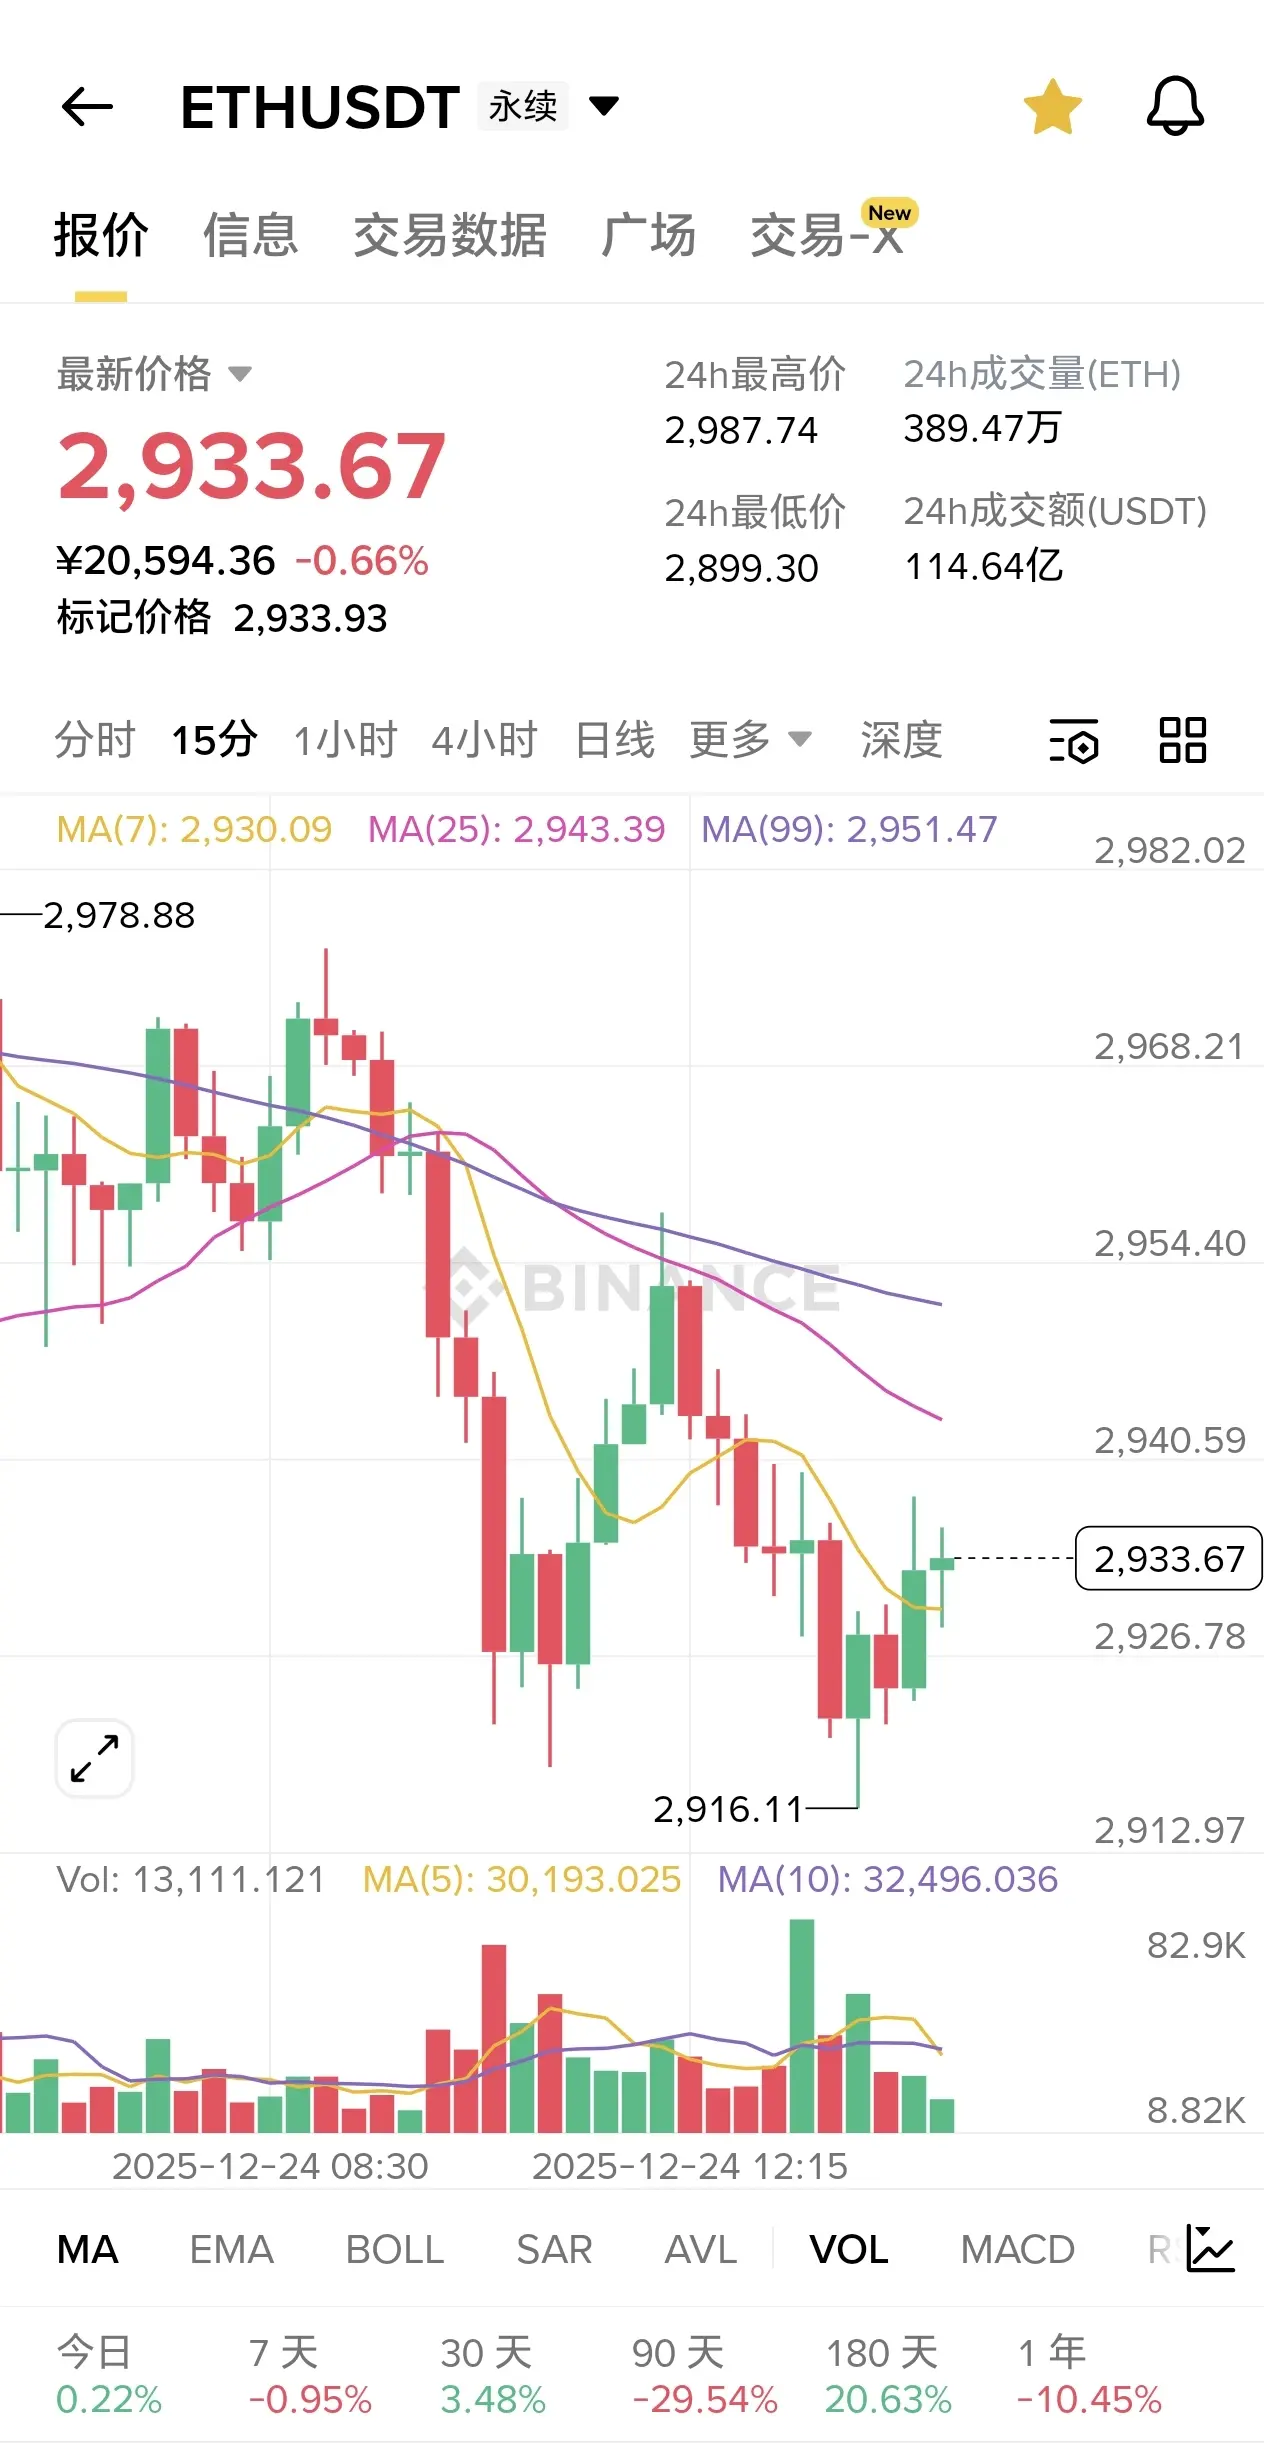
2025.12.24 Ethereum 15-minute K-line is in a short-term adjustment phase, overall following the bullish main trend with oscillations.
The current price fluctuates around $2950. In the short term, focus on a pullback to buy low, with a cautious approach, and trade with a small position.
If the pullback reaches the $2930-2940 range and the 15-minute K-line closes bullish and stabilizes, consider entering a long position with a small amount, set stop-loss at $2910, and target the resistance zone at $2980-3000.
If the price breaks above $3000 with volume and stabi
View Original2025.12.24 Ethereum 15-minute K-line is in a short-term adjustment phase, overall following the bullish main trend with oscillations.
The current price fluctuates around $2950. In the short term, focus on a pullback to buy low, with a cautious approach, and trade with a small position.
If the pullback reaches the $2930-2940 range and the 15-minute K-line closes bullish and stabilizes, consider entering a long position with a small amount, set stop-loss at $2910, and target the resistance zone at $2980-3000.
If the price breaks above $3000 with volume and stabi
- Reward
- like
- Comment
- Repost
- Share
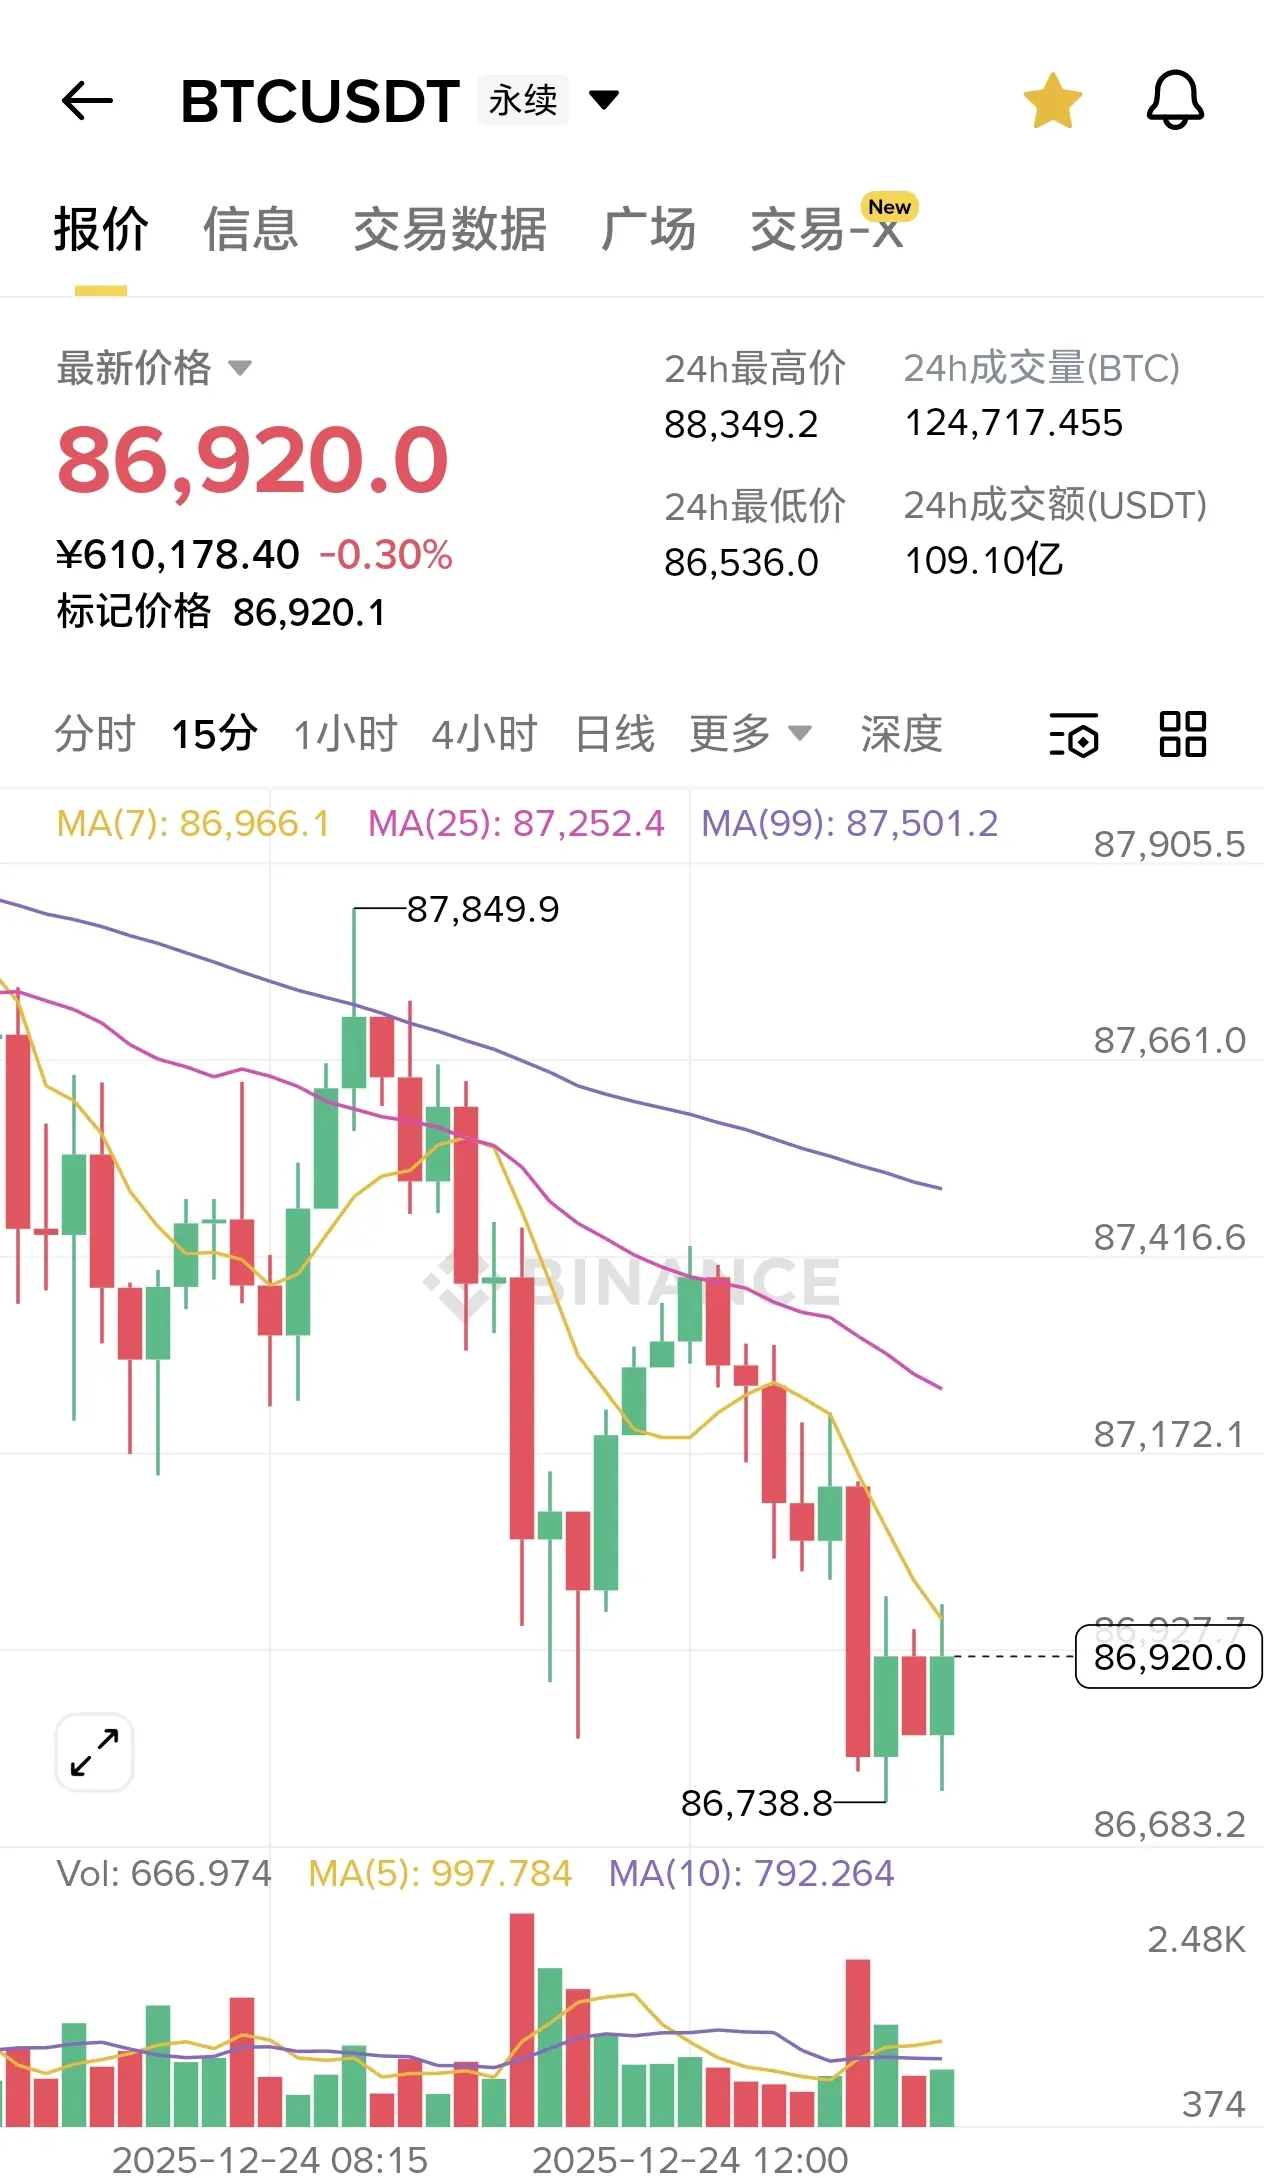
Midday Bitcoin Analysis Strategy
2025.12.24 Bitcoin 15-minute K-line aligns with short-term central oscillation, coupled with the intraday decline below $88,000,
Overall slightly oscillating and weak. Short-term trading mainly based on range trading, with light positions around key price levels.
For long positions, consider the support at $87,200. If the price stabilizes above this level and the 15-minute K-line closes bullish with increased volume, enter a light position. Set stop-loss at $86,800 and take profit at the resistance level of $88,500.
View Original2025.12.24 Bitcoin 15-minute K-line aligns with short-term central oscillation, coupled with the intraday decline below $88,000,
Overall slightly oscillating and weak. Short-term trading mainly based on range trading, with light positions around key price levels.
For long positions, consider the support at $87,200. If the price stabilizes above this level and the 15-minute K-line closes bullish with increased volume, enter a light position. Set stop-loss at $86,800 and take profit at the resistance level of $88,500.
- Reward
- like
- Comment
- Repost
- Share
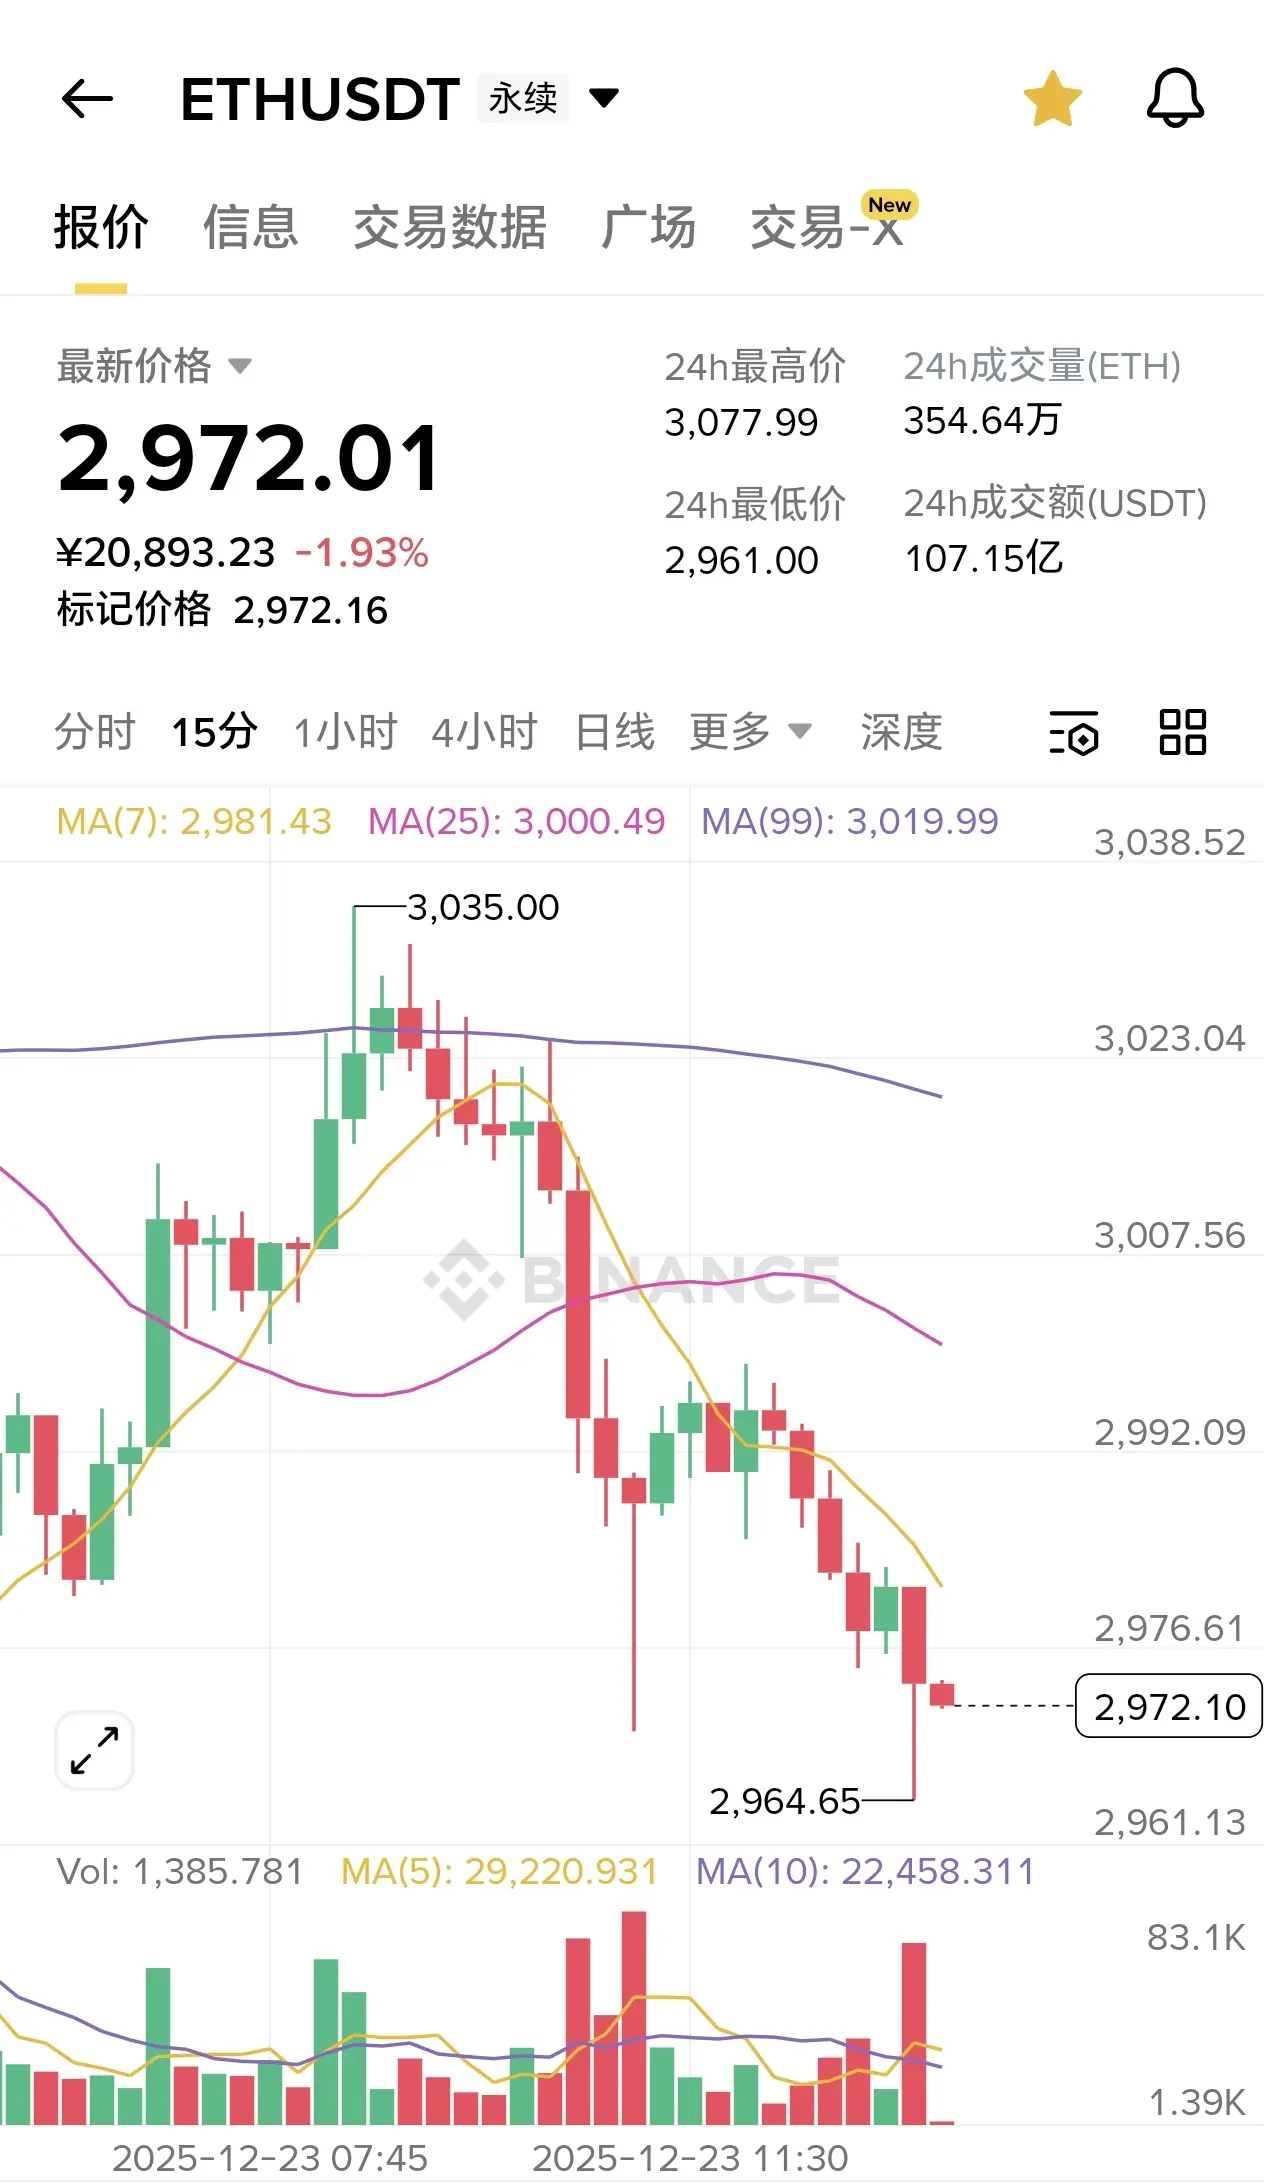
Ethereum midday analysis strategy
The current 15-minute K-line of Ethereum is in an adjustment phase, moving in a narrow range alongside Bitcoin, with the current price fluctuating around $2994, and bearish momentum is stronger.
The upper resistance at the 3030 level is strong, while the short-term support is seen at 2960, with strong support at 2950.
The short-term strategy is to focus on high leverage and light positions. If the price rebounds to the 3010-3020 range and is pressured without breaking 3030, then a short position can be taken, with a stop loss set at 3035. If the price breaks b
View OriginalThe current 15-minute K-line of Ethereum is in an adjustment phase, moving in a narrow range alongside Bitcoin, with the current price fluctuating around $2994, and bearish momentum is stronger.
The upper resistance at the 3030 level is strong, while the short-term support is seen at 2960, with strong support at 2950.
The short-term strategy is to focus on high leverage and light positions. If the price rebounds to the 3010-3020 range and is pressured without breaking 3030, then a short position can be taken, with a stop loss set at 3035. If the price breaks b
- Reward
- like
- Comment
- Repost
- Share
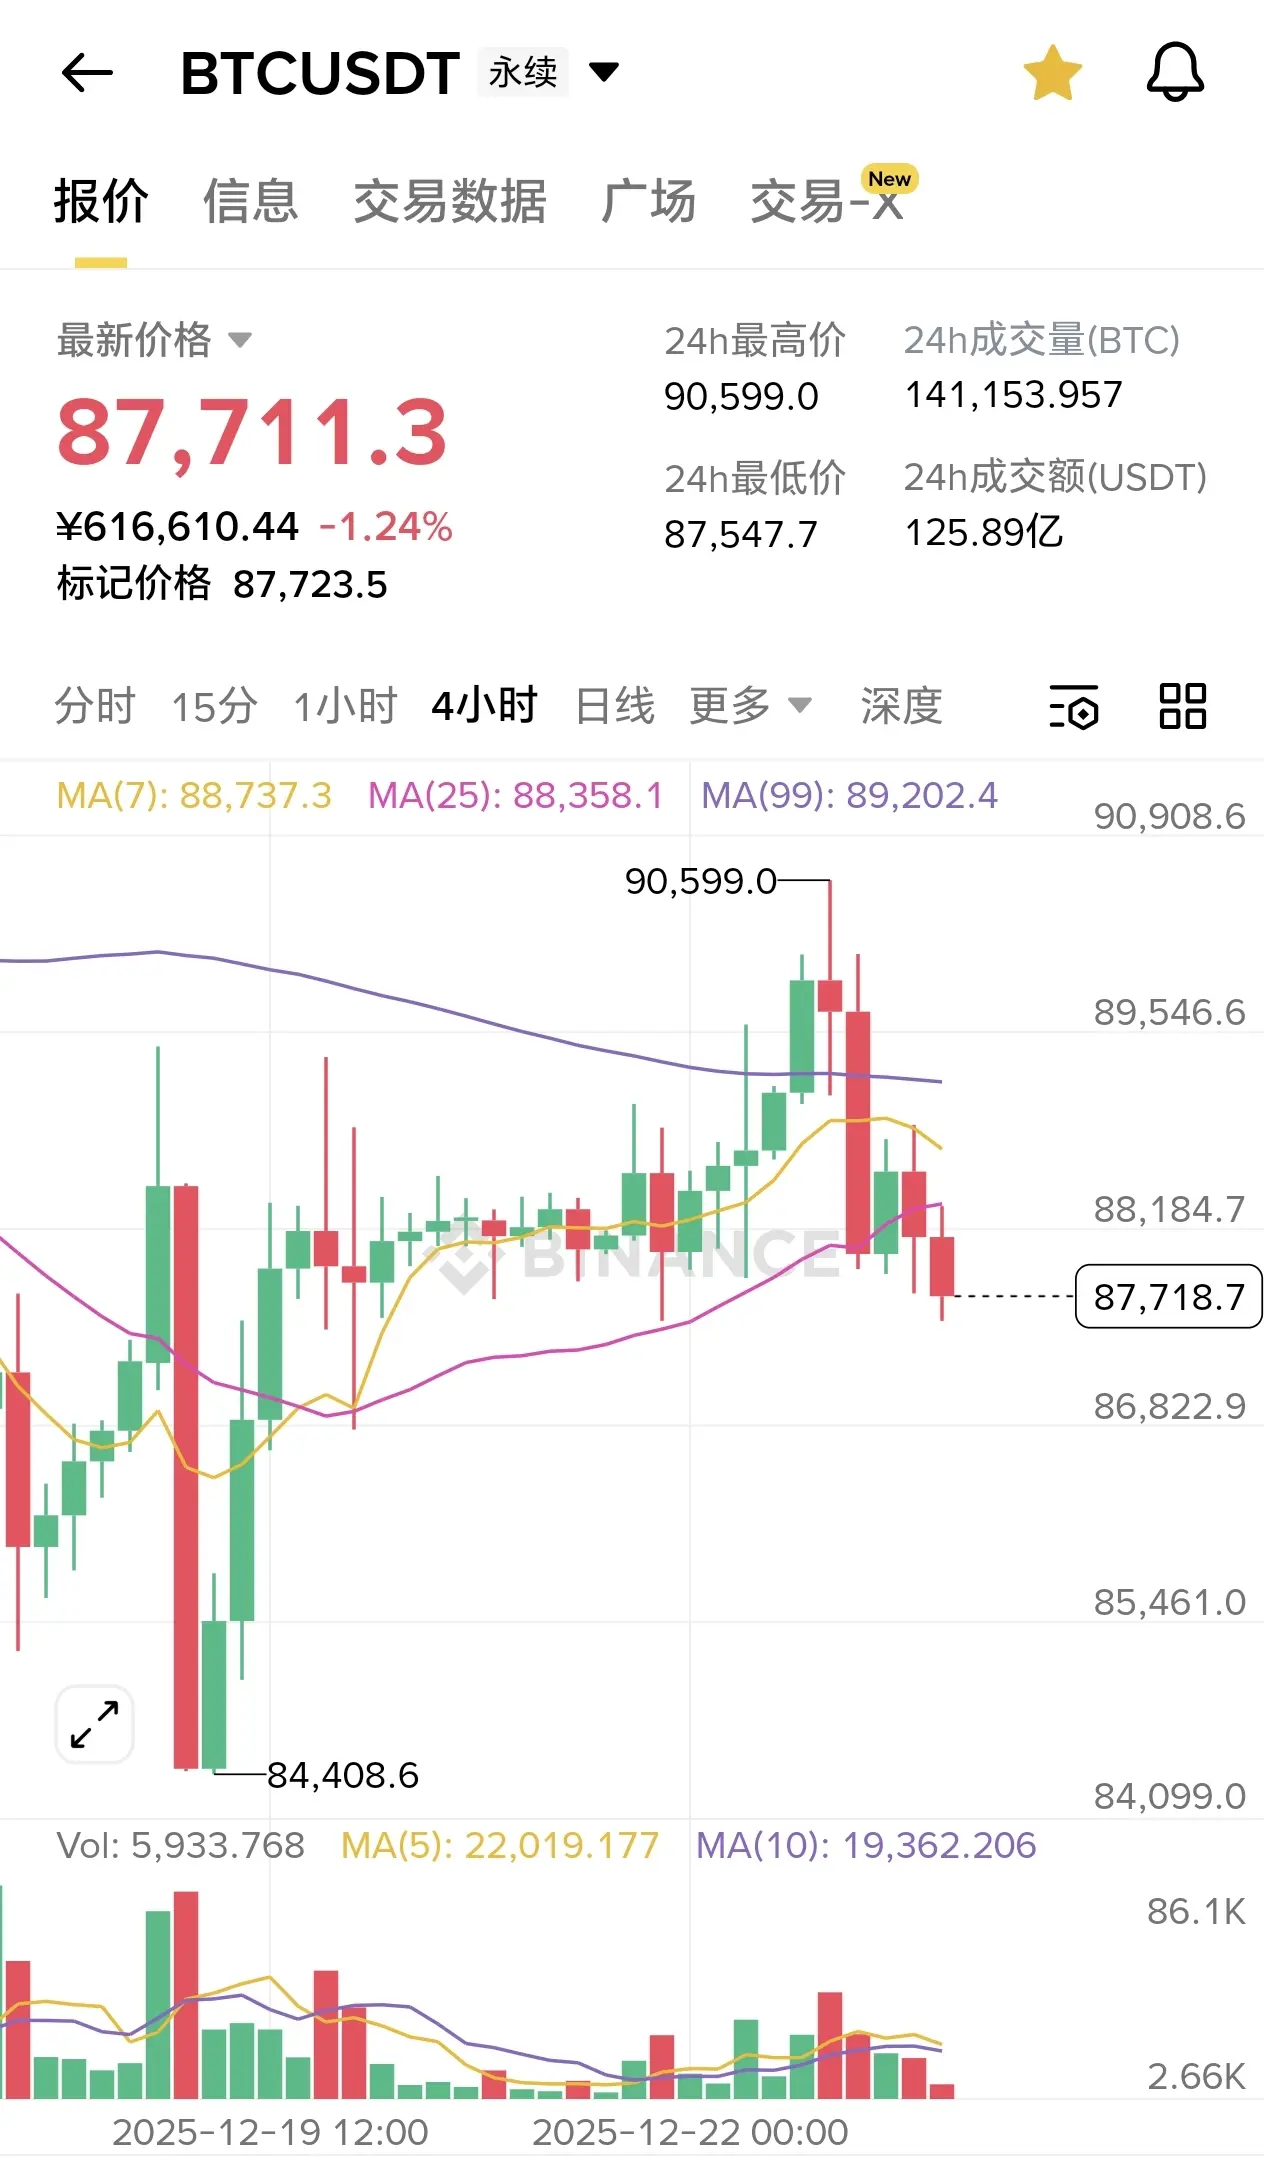
midday BTC analysis strategy
The 15-minute candlestick of Bitcoin is in a narrow fluctuation, with prices oscillating around 88500 USD, relying on the support of the 4-hour VMA.
Short-term bullish momentum is accumulating but upward momentum is insufficient. The 90,000 psychological barrier above is clearly suppressing, while support is seen in the 87,800-88,000 range below.
Short-term operations involve high selling and low buying within a range, with light positioning. Short-sell when the price touches above 89000 and does not break through 90000 with volume; set a stop loss at the previous
View OriginalThe 15-minute candlestick of Bitcoin is in a narrow fluctuation, with prices oscillating around 88500 USD, relying on the support of the 4-hour VMA.
Short-term bullish momentum is accumulating but upward momentum is insufficient. The 90,000 psychological barrier above is clearly suppressing, while support is seen in the 87,800-88,000 range below.
Short-term operations involve high selling and low buying within a range, with light positioning. Short-sell when the price touches above 89000 and does not break through 90000 with volume; set a stop loss at the previous
- Reward
- like
- Comment
- Repost
- Share
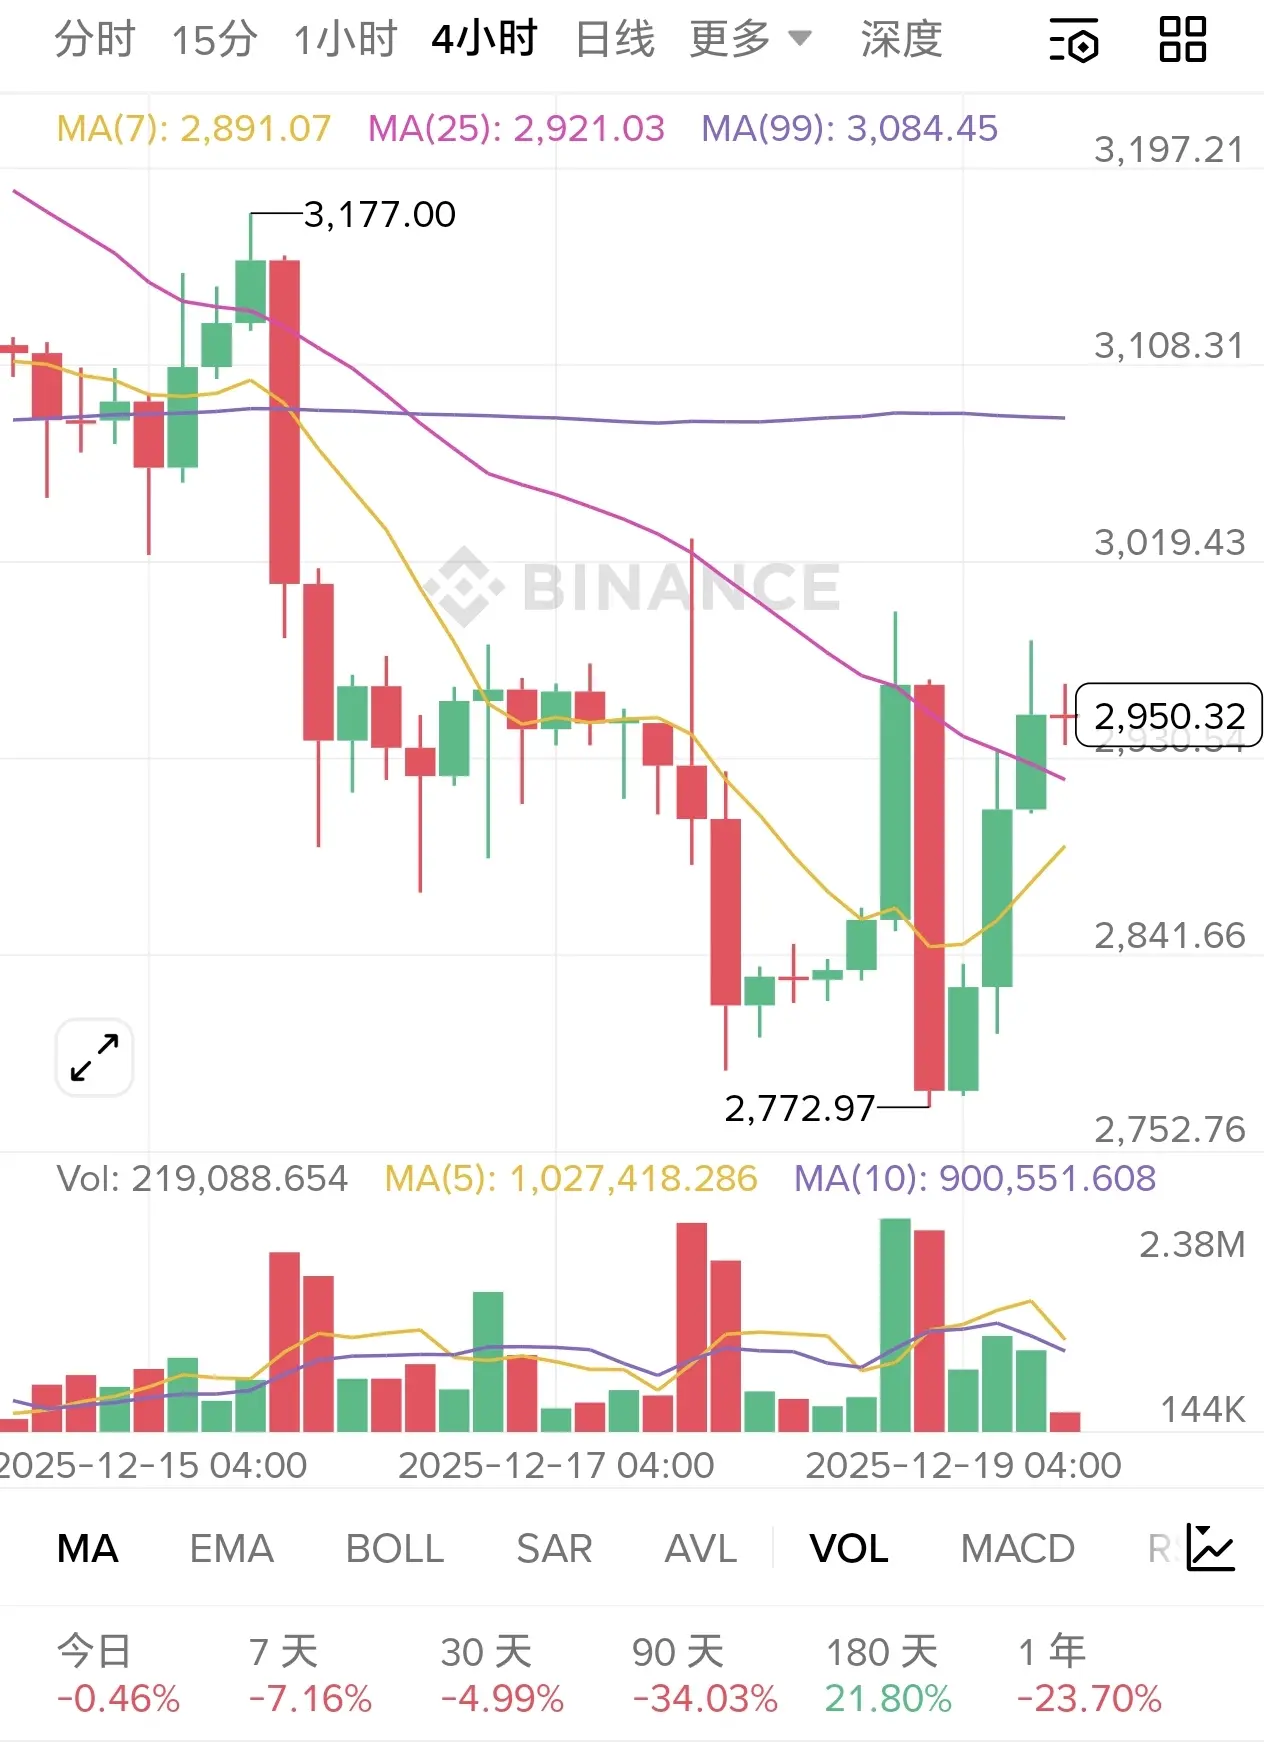
Second Bitcoin Coin Market Analysis and Trading Strategy
The second Bitcoin coin trend confirms a shift to bearish, with a primary focus on shorting. The daily chart shows an effective double top pattern, and after breaking the neckline, the price quickly declines. The measured decline corresponding to this pattern is gradually materializing.
In the four-hour cycle, the price is moving within a downward channel, with significant resistance at the upper boundary. Each rebound encounters strong selling pressure; once the lower boundary of the channel is broken, the downward space fully opens.
At
View OriginalThe second Bitcoin coin trend confirms a shift to bearish, with a primary focus on shorting. The daily chart shows an effective double top pattern, and after breaking the neckline, the price quickly declines. The measured decline corresponding to this pattern is gradually materializing.
In the four-hour cycle, the price is moving within a downward channel, with significant resistance at the upper boundary. Each rebound encounters strong selling pressure; once the lower boundary of the channel is broken, the downward space fully opens.
At
- Reward
- like
- Comment
- Repost
- Share

- Reward
- like
- Comment
- Repost
- Share
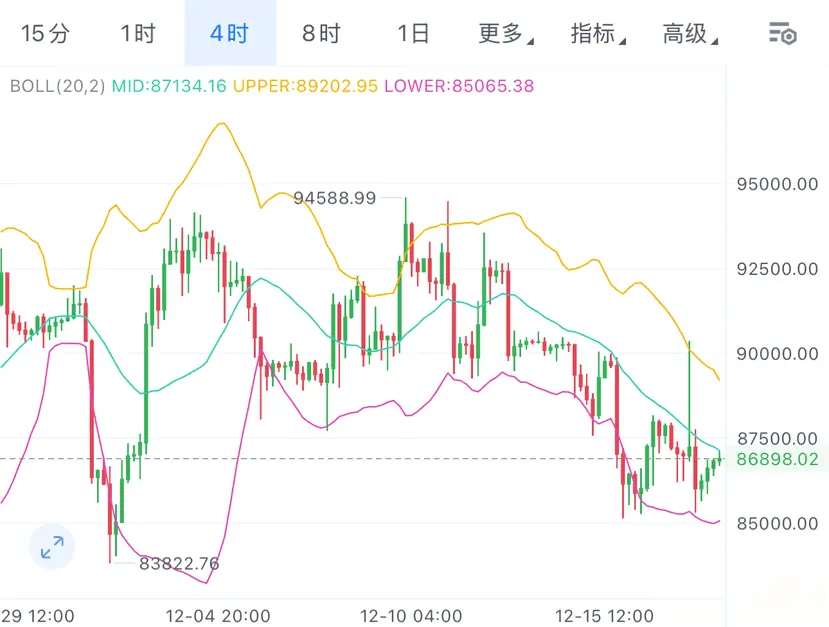
Bitcoin's current price is anchored around $86,900, and after a rapid rebound following a recent dip within 24 hours, it has reversed the previous continuous decline. The bearish momentum is nearly exhausted, with the $85,000 level forming a strong support.
From the four-hour chart perspective, the rebound after touching the lower Bollinger Band is impressive, with the support effect of the lower band being significant; the downward slope of the Bollinger Bands continues to slow, and the band width is narrowing, indicating a clearer trend of upward breakout after consolidation.
The candlestick
View OriginalFrom the four-hour chart perspective, the rebound after touching the lower Bollinger Band is impressive, with the support effect of the lower band being significant; the downward slope of the Bollinger Bands continues to slow, and the band width is narrowing, indicating a clearer trend of upward breakout after consolidation.
The candlestick
- Reward
- like
- Comment
- Repost
- Share
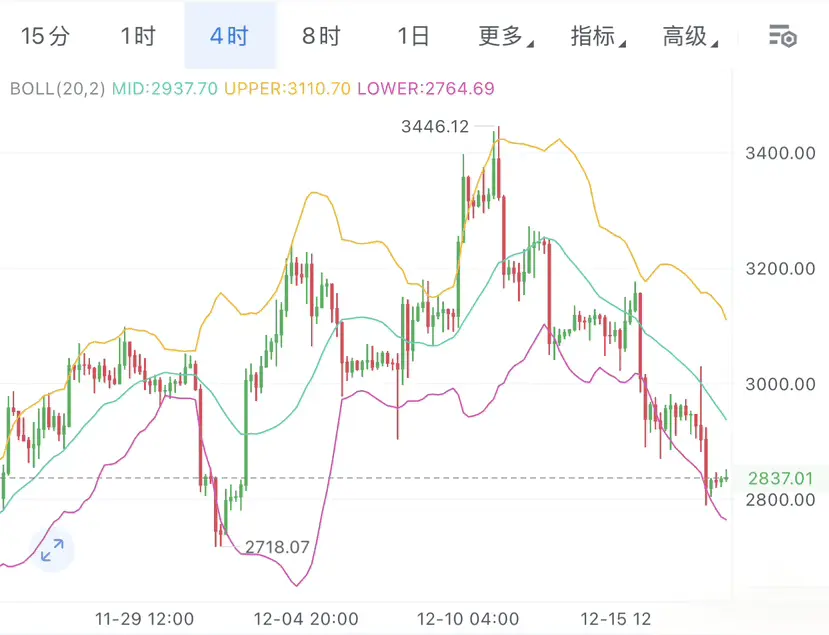
The recent trend of the two coins is very clear: a round of sufficient shakeout has almost exhausted the bearish momentum, the market has shifted from panic to warmth, and funds are starting to enter the market for布局.
On the four-hour chart, the price quickly rebounds after hitting the lower Bollinger Band, a classic bottoming and rising pattern, with the closing price firmly above the oscillation zone, now the bulls are in control.
The moving averages have already formed a bullish arrangement, with MA5 and MA10 turning upward to support the price. As long as volume follows, breaking the previ
View OriginalOn the four-hour chart, the price quickly rebounds after hitting the lower Bollinger Band, a classic bottoming and rising pattern, with the closing price firmly above the oscillation zone, now the bulls are in control.
The moving averages have already formed a bullish arrangement, with MA5 and MA10 turning upward to support the price. As long as volume follows, breaking the previ
- Reward
- 1
- Comment
- Repost
- Share