Bitcoin fell 1.7% today to $90,954, with trading volume contracting 5.2% to $46.9 billion over 24 hours. Ethereum crashed 3.3% to $3,137, and the total cryptocurrency market cap declined 1% to $3.12 trillion. Technical analysis shows $94,100 forming triple top resistance, holding the $90,900 support is critical, and a breakdown could test $86,970.
Triple Top Resistance Becomes the Last Straw Crushing Bulls
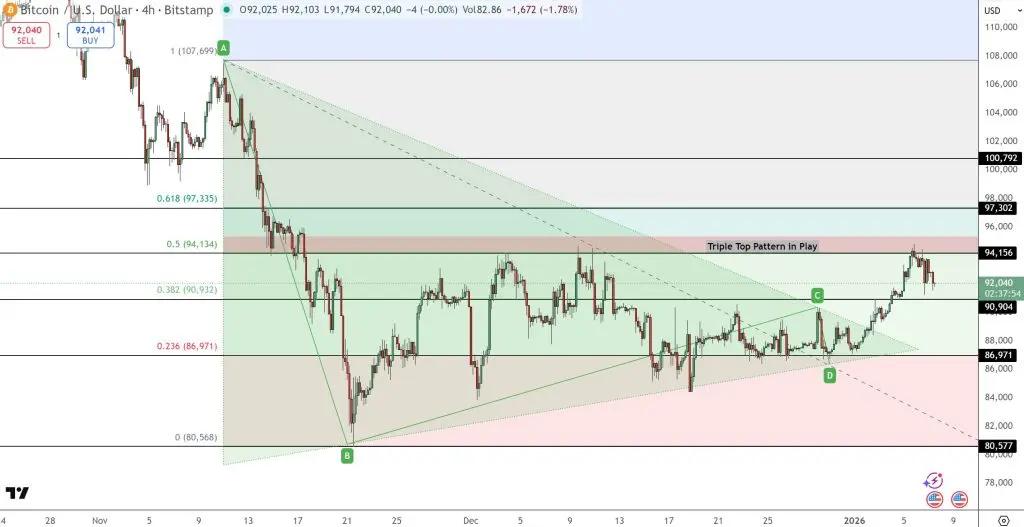
(Source: Trading View)
The primary reason Bitcoin fell today is the breakdown of triple top resistance on the technical chart. On the 4-hour chart, Bitcoin’s price consolidated around $92,000, within a descending channel starting from the $107,700 high. The price continues to hold the 38.2% Fibonacci retracement level at $90,900, while repeated rejections near $94,100 have formed a distinct triple top resistance zone.
A triple top is a classic bearish reversal pattern. When price fails to break through the same resistance level after three attempts, it signals extremely strong selling pressure at that price level and that bull strength has been exhausted. Bitcoin’s three attempts near $94,100 have all ended in failure, causing technical traders to question whether upside momentum has disappeared. Once this doubt spreads, profit-taking and stop-loss selling orders will surge.
The candlestick formations also support this view. Recent trading days have shown long upper wicks, spinning tops, and small body candles, indicating hesitation and weakening momentum near resistance levels. No convincing bullish engulfing or three white soldiers patterns have appeared to confirm a breakout. From a structural perspective, Bitcoin continues to make higher lows since November, allowing the intermediate recovery momentum to persist. However, if Bitcoin cannot effectively close above $94,200, this move remains in a correction phase within a broader downtrend.
The 38.2% Fibonacci retracement level at $90,900 is the most critical support currently. This price level is the golden ratio retracement from the $107,700 high to the $80,500 low and holds significant importance in technical analysis. Should it break below $90,900, it could test $86,970 (the 23.6% retracement level), and potentially explore further the demand zone between $80,500 and $82,000. This step-down path provides traders with a clear risk management framework.
Contracting Volume Shows Buying Power Exhaustion
The second reason Bitcoin fell today is the significant contraction in trading volume. According to CoinMarketCap data, Bitcoin’s 24-hour trading volume declined 5.2% to $46.9 billion. More broadly, the total trading volume across the cryptocurrency industry fell 14% to $117.4 billion. This combination of price decline and volume contraction typically signals that buying power is exhausting rather than active selling intensifying.
Trading volume is the key metric for validating the effectiveness of price movements. An ideal rally should be accompanied by expanding volume, showing genuine buying interest. Conversely, when price consolidates at high levels but trading volume continues to contract, it often signals that bulls are gradually retreating. This volume-price divergence is a classic signal of impending trend reversal. Bitcoin is currently in this dangerous state of volume-price divergence.
Three Major Technical Warnings for Bitcoin’s Decline
Triple top resistance confirmed: Three failed attempts at $94,100 show strong selling pressure and exhausted bull strength
Continuous volume contraction: 24-hour volume down 5.2%, typical of weakening buying power
Weakening candlestick patterns: Long upper wicks and small bodies show hesitation, lacking strong bullish engulfing or breakthrough patterns
From a volatility perspective, Bitcoin’s realized volatility has continuously declined over the past week. Low volatility environments typically appear before trend changes, and current low volatility may be the calm before the storm. Historical data shows Bitcoin often experiences 5%-10% violent single-day swings after prolonged low volatility, direction could be either up or down.
Why Morgan Stanley’s ETF Application Failed to Boost Prices

(Source: SEC)
The third question about why Bitcoin fell today is: Morgan Stanley submitted a spot Bitcoin ETF application to the SEC this week, which should have been significant positive news—why did prices fall instead of rally? The documents filed with the Securities and Exchange Commission outline the proposed Morgan Stanley Bitcoin Trust Fund, designed to track the spot price of Bitcoin after fees.
Currently, spot Bitcoin ETFs manage over $120 billion in assets, representing a substantial portion of Bitcoin’s total market cap. For Morgan Stanley, issuing its own ETF allows closer integration into client portfolios and captures management fees previously flowing to companies like BlackRock and Fidelity. This marks the birth of the first Bitcoin fund directly initiated by a major U.S. bank.
However, the market’s reaction to this news has been lukewarm, likely for three reasons. First, the “expectations already priced in” effect. Rumors of Morgan Stanley’s ETF application have circulated in the market for weeks, and price may have already reflected this expectation. When the official announcement comes, it becomes a “good news exhausted” selling opportunity. Second, ETF applications require months to be approved, producing no substantial capital flows in the short term. Third, institutional investors may be “selling the news,” reducing positions for profits when positive news breaks.
The U.S. 10-year Treasury yield reported 4.134% on Wednesday afternoon (Eastern time), down from 4.175% on Tuesday; the 5-year Treasury yield declined from 3.717% to 3.689%. Declining bond yields typically indicate rising risk-off sentiment, with funds flowing toward safe assets. In this macroeconomic environment, Bitcoin as a risk asset faces selling pressure.
إخلاء المسؤولية: قد تكون المعلومات الواردة في هذه الصفحة من مصادر خارجية ولا تمثل آراء أو مواقف Gate. المحتوى المعروض في هذه الصفحة هو لأغراض مرجعية فقط ولا يشكّل أي نصيحة مالية أو استثمارية أو قانونية. لا تضمن Gate دقة أو اكتمال المعلومات، ولا تتحمّل أي مسؤولية عن أي خسائر ناتجة عن استخدام هذه المعلومات. تنطوي الاستثمارات في الأصول الافتراضية على مخاطر عالية وتخضع لتقلبات سعرية كبيرة. قد تخسر كامل رأس المال المستثمر. يرجى فهم المخاطر ذات الصلة فهمًا كاملًا واتخاذ قرارات مدروسة بناءً على وضعك المالي وقدرتك على تحمّل المخاطر. للتفاصيل، يرجى الرجوع إلى
إخلاء المسؤولية.
