Bonk (BONK), FLOKI (FLOKI) and Pepe (PEPE) are holding strong on key support zones, revealing short term recovery signals.
As of the time of writing on Friday, the three meme coins Bonk (BONK), FLOKI (FLOKI), and Pepe (PEPE) are trading around key support zones. After the recent correction phase, the market is starting to show signs of stabilizing again, as technical indicators suggest that the downward momentum is gradually weakening — opening up prospects for a short term recovery.
Bonk bounces back after finding support at an important zone
The price of Bonk (BONK) has bounced back after successfully testing the 50% Fibonacci retracement level around the mark of 0.000013 USD at the beginning of the week. As of the time of writing on Friday, this meme coin continues to sustain its recovery, trading steadily above 0.000014 USD.
If the upward momentum is reinforced, BONK could extend its rise towards the 50-day exponential moving average (EMA) around 0.000018 USD, coinciding with the main downtrend line. Closing candles above this zone could pave the way for BONK to approach the next resistance level around 0.000022 USD.
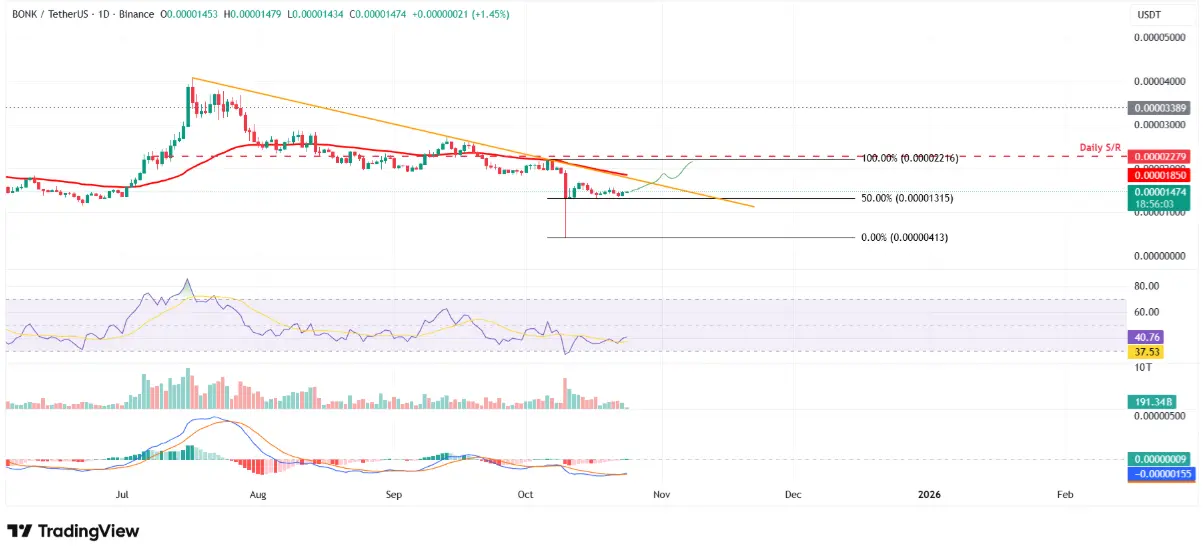 BONK/USDT Daily Chart | Source: TradingViewOn the daily timeframe, the RSI indicator is currently at 40 points and trending upwards, indicating that the selling momentum has weakened. To confirm a stronger recovery trend, the RSI needs to break above the neutral level of 50. At the same time, the MACD indicator has recorded a bullish cross on Thursday, sending a buy signal and reinforcing the short term recovery outlook.
However, in the adjustment scenario, BONK may retreat to the support zone around 0.000013 USD, corresponding to the 50% Fibonacci retracement level.
FLOKI could extend its recovery momentum if it closes the candle above the 50-day EMA.
The price of FLOKI found support around the zone of 0.000063 USD on Sunday before surging more than 19% the following day. However, the early recovery was halted at the 50-day EMA line around 0.000084 USD, causing this meme coin to adjust nearly 10% by midweek. By Friday, FLOKI stabilized around 0.000073 USD.
If FLOKI can break out and close above the 50-day EMA, the bullish outlook will be strengthened, opening up the opportunity to move towards the next resistance zone at 0.00011 USD.
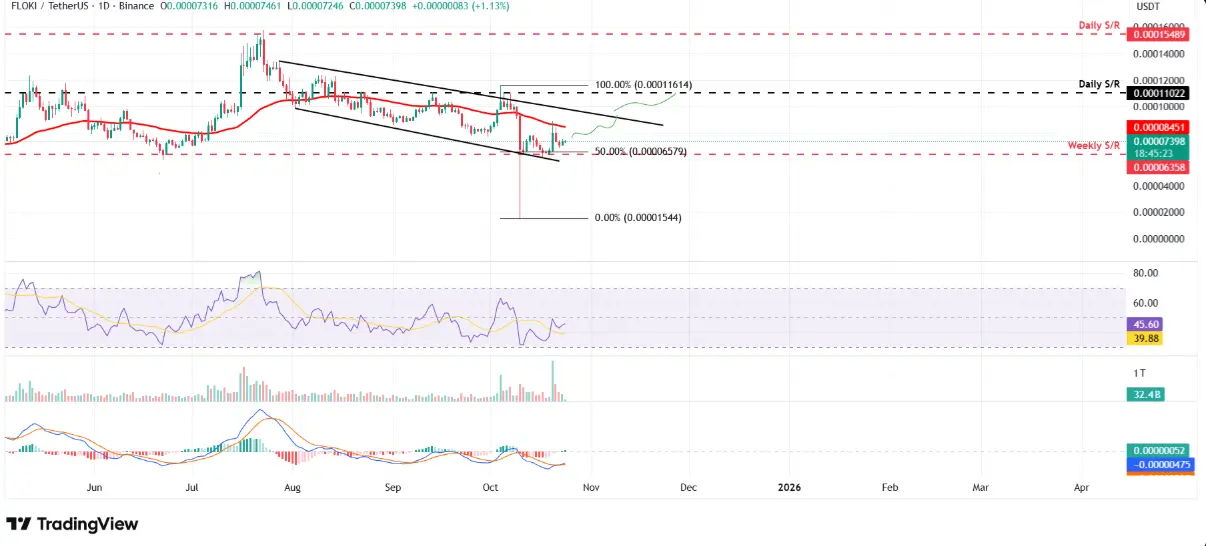 Daily chart of FLOKI/USDT | Source: TradingViewOn the daily chart, the RSI indicator is currently at 45 points and is gradually trending upwards, indicating that the downward momentum is weakening. An RSI crossing above 50 will be a confirming signal for a more sustainable upward trend. Additionally, the MACD has just recorded a bullish crossover on Thursday, reinforcing the buy signal and supporting recovery momentum.
On the contrary, in a negative scenario, if selling pressure increases, FLOKI may revisit the important support zone at 0.000063 USD.
PEPE shows early recovery signals as the downtrend weakens
The price of Pepe (PEPE) tested the 50% Fibonacci retracement zone at 0.0000065 USD on Wednesday and quickly recovered nearly 4% in the following session. As of the time of writing, PEPE is still maintaining a slight upward trend, trading above the 0.0000070 USD mark.
If buying power continues to be maintained, the recovery momentum of PEPE could extend towards the resistance zone around 0.0000079 USD. A stable close above this level could trigger a new upward trend, with the next target being the 50-day EMA at 0.0000087 USD.
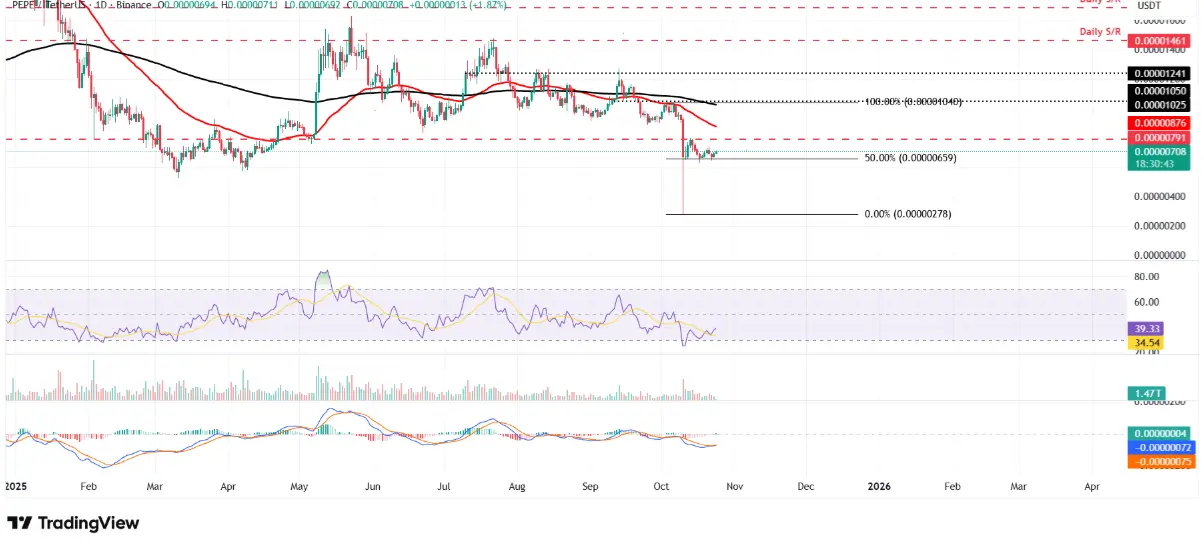 PEPE/USDT Daily Chart | Source: TradingViewSimilarly to BONK and FLOKI, technical indicators such as RSI and MACD are showing a clear weakening of the downtrend, while also signaling support for a short term recovery. However, in the event that selling pressure returns, the 0.0000065 USD zone will still be an important support level that needs to be protected.
SN_Nour
Disclaimer: The information on this page may come from third parties and does not represent the views or opinions of Gate. The content displayed on this page is for reference only and does not constitute any financial, investment, or legal advice. Gate does not guarantee the accuracy or completeness of the information and shall not be liable for any losses arising from the use of this information. Virtual asset investments carry high risks and are subject to significant price volatility. You may lose all of your invested principal. Please fully understand the relevant risks and make prudent decisions based on your own financial situation and risk tolerance. For details, please refer to
Disclaimer.