Futures
Access hundreds of perpetual contracts
TradFi
Gold
One platform for global traditional assets
Options
Hot
Trade European-style vanilla options
Unified Account
Maximize your capital efficiency
Demo Trading
Introduction to Futures Trading
Learn the basics of futures trading
Futures Events
Join events to earn rewards
Demo Trading
Use virtual funds to practice risk-free trading
Launch
CandyDrop
Collect candies to earn airdrops
Launchpool
Quick staking, earn potential new tokens
HODLer Airdrop
Hold GT and get massive airdrops for free
Launchpad
Be early to the next big token project
Alpha Points
Trade on-chain assets and earn airdrops
Futures Points
Earn futures points and claim airdrop rewards
More
Bitcoin Support and Resistance Analysis: Key Levels, Market Trends, and Strategic Trading Insights
#BitcoinSupportAndResistanceAnalysis
Bitcoin Support & Resistance Analysis BTC/USDT
As of March 24, 2026 | Price: $71,213| 24h Change: +3.92%
Multi-Timeframe Structure Overview
The two charts above capture the complete picture across both the macro daily structure and the intermediate4-hour structure. Reading them together reveals a market that has executed a textbook recovery from an extreme-fear capitulation low and is now approaching the first meaningful supply cluster that will determine whether the current recovery is a relief bounce or the beginning of a sustained directional move back toward the cycle highs.
Daily Chart — Structural Support & Resistance Levels
Current Context from Daily Data
The daily chart shows a clear sequence: BTC established a multi-week consolidation band roughly between $86,000 and $97,000 in the earlier portion of the data, then experienced an accelerated markdown phase that brought price from the $89,000 – $90,000 zone all the way down to the $67,923 session low printed on March 24 — the lowest print on the entire daily chart shown. The recovery from that low to the current $71,213 represents a 4.8% bounce from the absolute session nadir, and the question the structure is now asking is whether the $67,923 – $68,108 zone will hold as the macro floor.
Major Daily Resistance Levels (Ascending)
Major Daily Support Levels (Descending)
4-Hour Chart — Intermediate Support & Resistance Structure
Current Context from 4H Data
The 4-hour chart provides the granular picture of price action over the past several weeks with greater precision. The recovery sequence from the $67,923 low is clearly visible as a series of higher-volume bullish candles that broke through the $68,100 – $68,900 consolidation zone and drove price through $70,000 – $71,000 in rapid succession. The current price of $71,213 is trading in what the4-hour structure identifies as a short-term consolidation zone between the $70,900 – $71,094 base and the $71,401 – $71,800 overhead supply.
Key 4-Hour Resistance Levels (Ascending)
Key 4-Hour Support Levels (Descending)
Volume-Weighted Level Assessment
The most important principle in assessing which support and resistance levels will hold is volume validation. Looking at the 4-hour volume data, the standout observations are:
The breakout candle from $67,923 to $71,497 on March 24 (candle timestamp 1774252800) printed volume of 3,791BTC against a sum of $264million — the highest volume 4-hour candle in the recovery sequence and confirmation that this was a genuine institutional-driven move rather than a low-conviction short squeeze. The subsequent candle (1774267200) added another 3,537 BTC at the $71,800 high, confirming sustained buying rather than a single spike. This double-candle high-volume sequence is the kind of structural confirmation that separates genuine support levels from noise — the $67,923 – $68,341 zone that these two candles launched from now carries significant volume anchoring that makes it a structurally important support for any near-term pullback.
The distribution zone visible in mid-March around $73,500 – $74,900shows multiple high-volume candles confirming that this range absorbed significant supply. Volumes of 3,147 – 3,380 BTC per4-hour candle at these levels mean there are meaningful pools of trapped longs that will apply selling pressure as price approaches this zone on the recovery.
Current Positioning Framework
Based on the complete multi-timeframe support and resistance structure:
Scenario A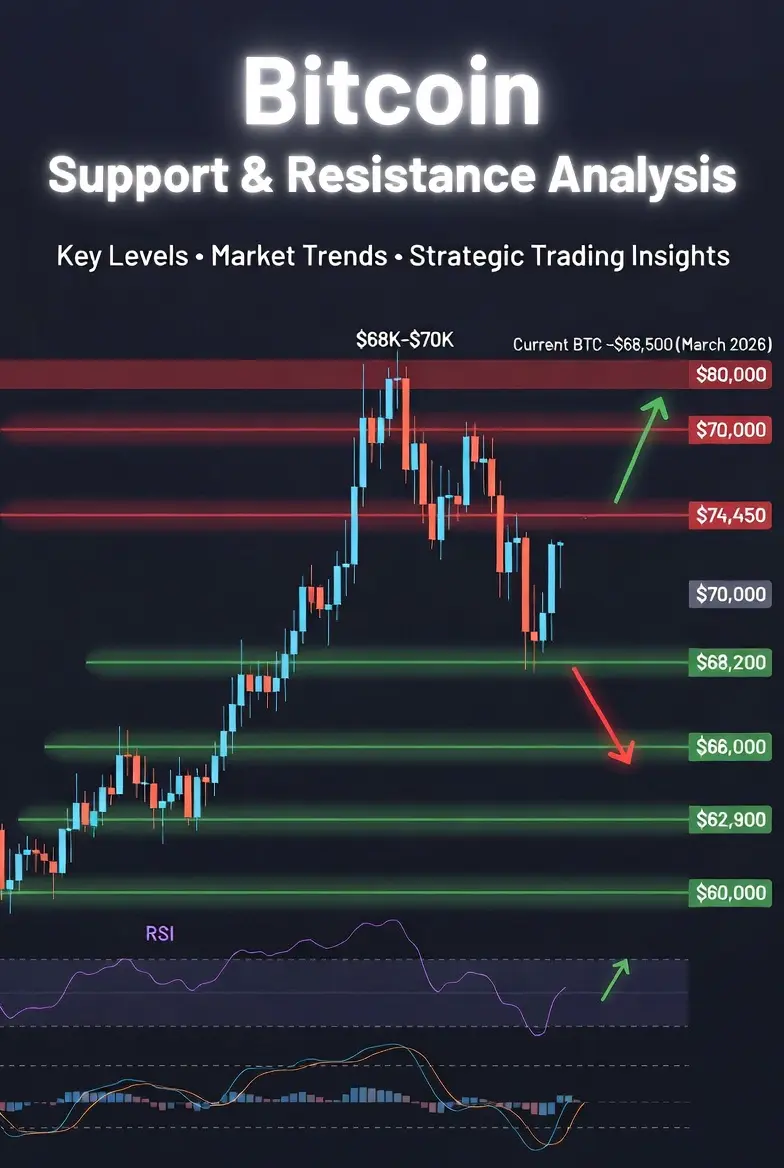 Bullish Continuation: Price holds the $70,122 – $70,275 immediate support on any pullback, consolidates in the $70,000 – $71,800 range over the next 24-48 hours, then attempts a breakout above $71,800 on volume. Successful close above $71,800 on the daily chart opens the $73,896 – $74,910 supply cluster as the next target over the following 1-2 weeks. This is the scenario supported by the institutional flow data and the extreme-fear-to-recovery pattern.
Scenario B Consolidation and Retest: Price pulls back from the $71,800 resistance into the $69,400 – $70,122 consolidation zone, absorbs supply, and builds a higher base before the next attempt at $71,800. This is the higher-probability near-term path given that funding rates have not yet returned to neutral and derivatives market conviction remains below historical baseline levels despite the spot price recovery. A healthy retest of the $69,400 – $70,000 zone that holds on volume would actually strengthen the bullish case by creating a more solid base.
Scenario C Bearish Failure: Price fails to hold $69,400 on a pullback, breaks back through $68,787 – $68,921, and retests the $67,923 capitulation low. The critical monitoring level for this scenario is the $68,787 daily closing support — a daily close below this level with elevated volume would be the signal that the current recovery has failed and the markdown structure is reasserting.
The most important single level to monitor in the current environment is $71,800 on the upside and $68,787 on the downside. The distance between these two levels ($71,800 – $67,923 = $3,877) defines the current range within which the market is determining its next directional commitment.