- OFFICIAL TRUMP is hovering near the $7 mark.
- TRUMP’s trading volume has dropped by 37%.
The crypto assets are stuck in extreme fear in the market, and the prices are riding the waves between upward and downward moves without a defined route. All major digital assets are trading on the downside, losing momentum, which includes BTC and ETH. Meanwhile, OFFICIAL TRUMP (TRUMP) has spiked by over 0.73% in the last 24 hours
The asset opened the day trading at a bottom range of $6.89. As the brief bullish shift in the TRUMP market made it climb high toward $7.14. Upon the bulls gaining traction, the price could test and break the resistance in between to hit the $10 threshold
As per the CoinMarketCap data, the OFFICIAL TRUMP is currently trading within the $7 mark, with the market cap staying at $1.4 billion. In addition, the daily trading volume of TRUMP has decreased by over 37.80%, likely reaching the $359.77 million zone
Where is the OFFICIAL TRUMP Price Headed?
OFFICIAL TRUMP’s bearish chart might trigger the price to slip toward the $6.93 support level. Assuming the downside correction gains more power, it could invite the death cross to happen, and gradually drive the asset’s price to its former lows at around $6.85
On the upside, if it reverses the ongoing momentum, the OFFICIAL TRUMP price could rise and find the crucial resistance at around the $7.07 range. Further upside pressure might trigger the emergence of the golden cross, sending the price toward $7.15 or higher
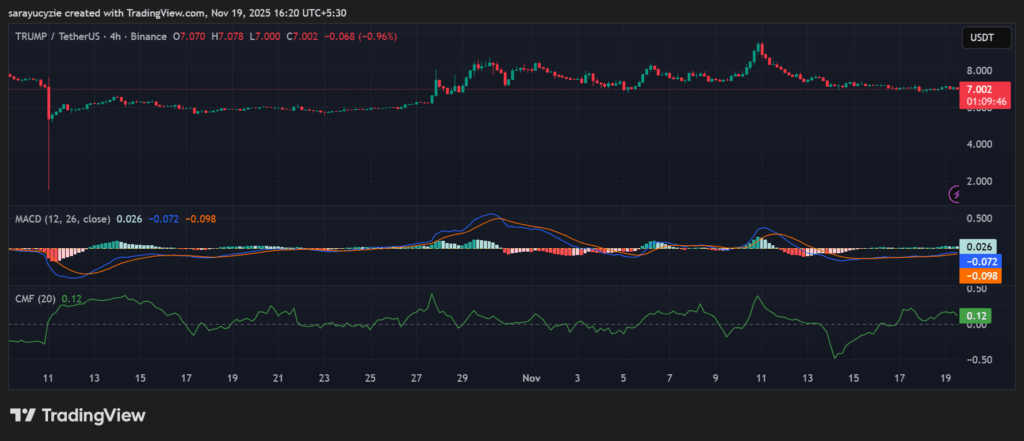 TRUMP chart (Source: TradingView)The technical analysis of TRUMP reports that the Moving Average Convergence Divergence line and signal line are below the zero line, indicating bearish momentum. The asset will remain bearish until MACD climbs back above zero. Besides, OFFICIAL TRUMP’s Chaikin Money Flow (CMF) indicator at 0.12 suggests mild buying pressure in the market. The money is flowing into the asset, but not aggressively, which is supporting the price action in the short term.
The daily Relative Strength Index (RSI) value found at 43.93 implies the asset’s neutral-to-slightly bearish sentiment. Notably, it is nowhere near oversold, and the market still has room to move either way. Furthermore, OFFICIAL TRUMP’s Bull Bear Power (BBP) reading settled at -0.010, signalling that bears have a slight upper hand. The margin is very small, and it would not lead to a strong trend.
Top Updated Crypto News
Breakout or Breakdown: Is SPX6900 (SPX) Approaching a Critical Threshold for a Bullish Escape or Another Wave of Losses?
Disclaimer: The information on this page may come from third parties and does not represent the views or opinions of Gate. The content displayed on this page is for reference only and does not constitute any financial, investment, or legal advice. Gate does not guarantee the accuracy or completeness of the information and shall not be liable for any losses arising from the use of this information. Virtual asset investments carry high risks and are subject to significant price volatility. You may lose all of your invested principal. Please fully understand the relevant risks and make prudent decisions based on your own financial situation and risk tolerance. For details, please refer to
Disclaimer.
Related Articles
Shiba Inu Price Steady Amid Shytoshi Kusama’s X Silence and Bio Changes
Shiba Inu price remains steady while the community watches Kusama’s activity on X.
Kusama’s bio update hints at ongoing development, sparking speculation among SHIB followers.
SHIB shows minor rebounds amid broader market volatility and improving overall crypto sentiment.
Shiba Inu has h
CryptoNewsLand1m ago
This Crypto Trader Predicts Where the Zcash (ZEC) Price Is Headed Next
The ZEC price just ripped 15% higher in the last 24 hours, landing back among the top crypto gainers. The privacy coin is now trading just slightly below $270 after breaking out of a descending trendline that had held for months.
Analyst “Ardi” shared the chart on X, breaking down where the
CaptainAltcoin7m ago
Bitcoin ETF Six Consecutive Gains: Nearly 1 Billion USD Fund Inflow Drives BTC Rally Over 12%
On March 17, U.S. spot Bitcoin ETFs experienced net inflows for the sixth consecutive trading day, driving Bitcoin prices up more than 12%. Total net inflows reached $962.8 million, primarily supported by BlackRock and Fidelity. Despite smaller inflow scales, the sustained momentum has improved investor sentiment. Analysts believe short-term price movements are influenced by capital inflows and macroeconomic changes.
GateNews43m ago
TRUMP Token Whales Hit Five-Month High, Trump Dinner Effect Drives 36% Surge
Trump meme coin TRUMP surged approximately 36% following the announcement of an exclusive dinner event, with whale holdings reaching a five-month high. Large holders are actively increasing positions, but losses are also present in the market, indicating divergent investment behavior. Controversy sparked by political criticism may have limited impact on market performance, but regulatory investigation risks remain a concern to monitor.
MarketWhisper1h ago
Bitcoin Spot ETF Saw $760 Million in Inflows Last Week! But Whether the Rally Continues Requires Monitoring 3 Key Factors
US cryptocurrency spot ETFs showed a significant rebound last week, with Bitcoin and Ethereum recording net inflows of approximately $763.4 million and $160.9 million respectively, with prices bouncing back accordingly. Although the market is showing incremental buying signals, it still faces variables from central bank policies and geopolitical risks in the future. The market will continue to monitor ETF capital inflows and macroeconomic impacts.
CryptoCity1h ago
Market rally continues! Bitcoin returns to $75,000 level, ETF inflows persist
Bitcoin broke through $74,000 on March 16 as institutional capital flowed back into the market, with ETF net inflows reaching $1 billion, shifting market sentiment to bullish. Analysts predict Bitcoin could reach $80,000, but it is currently in a consolidation phase. $75,000 is a key resistance level; a breakout could lead to a test of $90,000, otherwise it risks a pullback.
区块客1h ago
