The price of Solana (SOL) is currently approaching the resistance line of the wedge pattern around the 142 USD mark, after being “trapped” in a narrow accumulation zone for a week.
This technical setup is attracting special attention from both traders and investors, as the wedge pattern has triggered several strong fluctuations for Solana over the past month, putting the market on the brink of a notable breakout.
Solana ETF capital flows return as institutions re-enter the market
Since the price of Solana bounced back from the support zone of the wedge pattern on November 22, the demand from institutions for this altcoin has also increased along an impressive trajectory.
The latest data shows that the inflow of capital into Solana ETF funds is recovering, reflecting a pattern that previously appeared during past tests of the price zone. Each surge in ETF capital is accompanied by a notable price increase, demonstrating the strong confidence of institutional investors in the medium-term prospects of SOL.
Although trading volume has not returned to its previous peak, the stable flow of capital is signaling that the market may be preparing for a new expansion phase.
 Source: CoinGlassData from CoinGlass shows that the open contract (OI) of Solana has increased by 10%, reaching 3.0 billion USD – a clear sign of active market activity and the potential for a breakout.
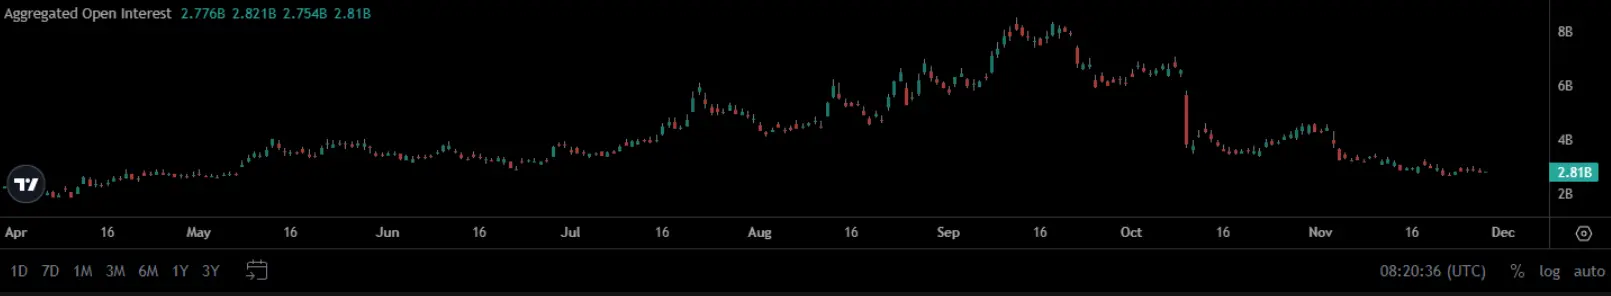 Source: CoinalyzeNot only that, the trading volume of SOL in the past 24 hours has also recorded an impressive increase, adding 7 billion USD, bringing the total trading volume to 48 billion USD. This strong upward momentum is opening up hopes for a corresponding price reaction in the near future.
 Source: Token Terminal## Can Solana break through to the zone of 170 USD?
The price of SOL is currently hitting the peak of the wedge pattern after bouncing from the important support zone around 130 USD, creating a decisive moment for short-term price momentum.
If the bulls succeed in making a clear breakout, SOL could target the 170 USD mark – a price zone that has been rejected multiple times before. A successful breakout is likely to attract strong capital inflows from institutions and “whales”, promising a new wave of increase.
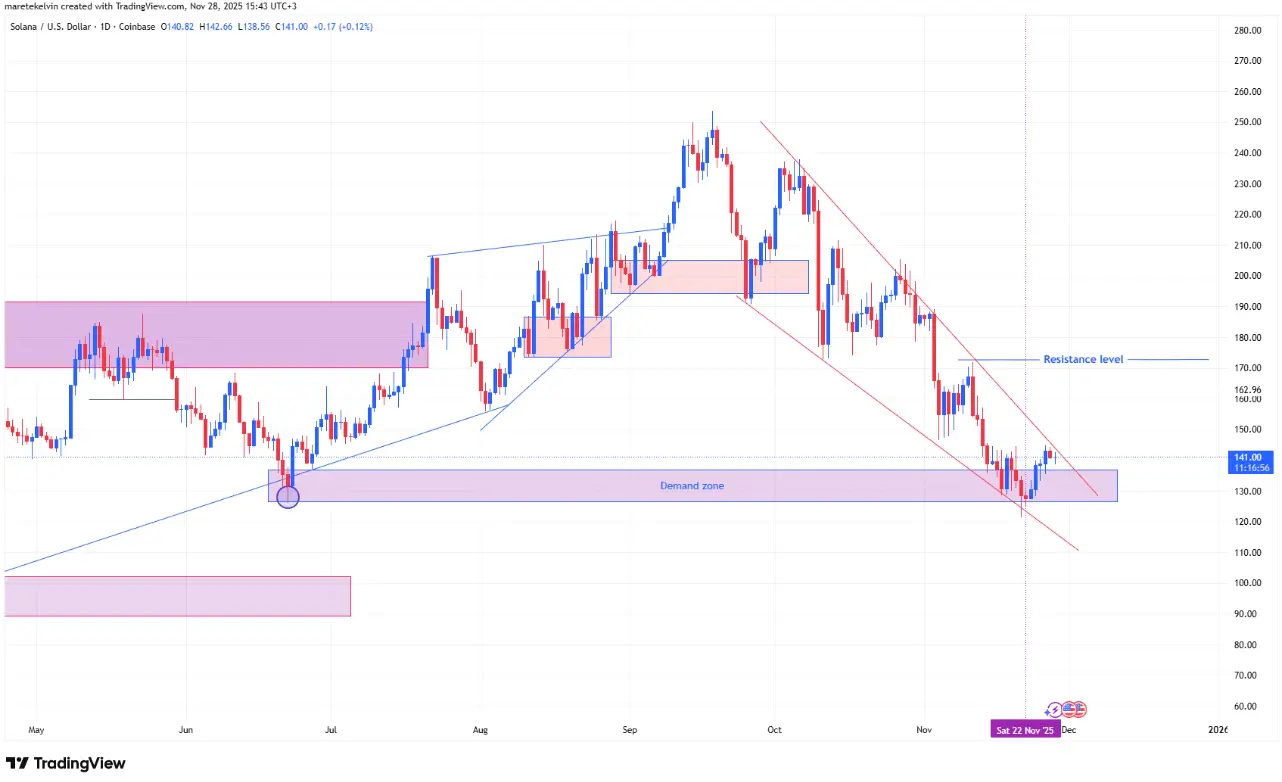 Source: TradingViewConversely, if SOL does not break through the resistance level of 142 USD, this token may continue to move sideways, fluctuating within the range of the wedge pattern.
Combining with the increasing ETF cash flow and the converging support zones, the long-term structure of SOL still leans towards an uptrend, opening up the prospect of breaking through to 170 USD in the near future.
SN_Nour
Disclaimer: The information on this page may come from third parties and does not represent the views or opinions of Gate. The content displayed on this page is for reference only and does not constitute any financial, investment, or legal advice. Gate does not guarantee the accuracy or completeness of the information and shall not be liable for any losses arising from the use of this information. Virtual asset investments carry high risks and are subject to significant price volatility. You may lose all of your invested principal. Please fully understand the relevant risks and make prudent decisions based on your own financial situation and risk tolerance. For details, please refer to
Disclaimer.
