In the context of a plummeting crypto market, Bitcoin Cash (BCH) stands out as one of the few large-cap coins that has maintained stability. Although the overall market has fallen by about 5% on the day, the price of BCH has still recorded an increase of over 1% at the time of the update. This makes BCH the focal point of attention for traders, as it demonstrates relatively superior strength compared to the rest.
However, when delving into the 12-hour price chart analysis, the actual picture is not as positive as the surface numbers suggest. Signs of weakness are gradually emerging, signaling the risk of a short-term downward adjustment. Therefore, BCH still needs to prove its real strength before it can establish a sustainable upward trend. Currently, potential bearish signals still dominate.
Warning signals on the price chart
In the past day, BCH has attempted to break through the resistance level of $539, but was unsuccessful as increased selling pressure pulled the price back below this threshold. This price range has repeatedly halted BCH's upward momentum, acting as a strong “wall” on the technical chart. To establish a new upward trend, traders often wait for a clear closing session above this level.
If BCH can close steadily above $539, the next target will be $568, $600 and further is $616 – corresponding to an increase of nearly 15% from the current price. Although this scenario is technically feasible, it may not happen immediately, especially when the RSI indicator is sending conflicting signals.
The Relative Strength Index (RSI) indicates that the price increase of BCH is lacking momentum. On the 12-hour timeframe, the price continuously creates new highs or equal levels, while the RSI is declining, forming a bearish divergence pattern. This means that the price is rising but the buying pressure behind it is weakening, posing a risk of reversal or a downward adjustment in the near future.
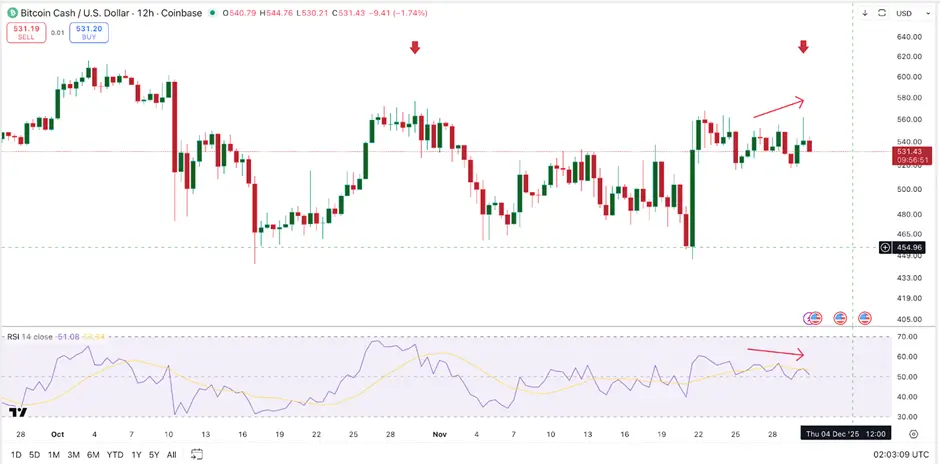 Bitcoin Cash price analysis (BCH) | Source: TradingViewAdditionally, if BCH loses important support zones at $521 and $507, the next price area could fall to $493 – where it had previously held its value. In the event that the market continues to weaken, BCH could potentially plummet further to $446. As fear spreads, support levels will become increasingly important, as investors tend to sell quickly when signs of instability appear.
Overly optimistic price forecasts and market reality
On online forums, some traders have drawn up strong bullish scenarios for BCH, exemplified by the “bull flag” pattern. However, technical analyses show that this shape is not truly reliable, as the “flag” part of the pattern is too long and wider than the “pole”, making it merely a normal sideways movement, which does not accurately reflect the essence of a bullish pattern.
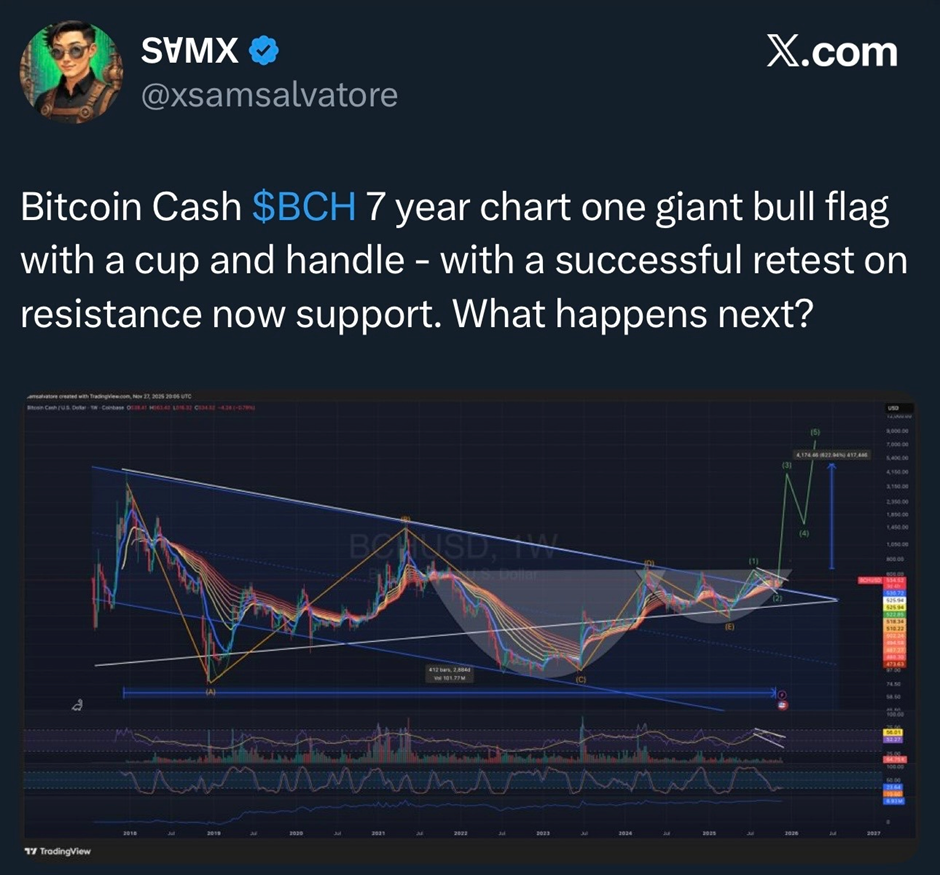 Forecast for Bitcoin Cash price (BCH) | Source: XSome other experts are optimistic about the “cup and handle” pattern in the long-term timeframe. Although this is a positive signal for the long-term outlook of BCH, it does not change the current weak situation on the chart in the short term. For traders interested in developments in the coming days, signals on the 12-hour chart will be more valuable for reference than long-term patterns.
Strategy for BCH in the upcoming period
At the present time, BCH is showing outstanding stability compared to many other large-cap coins as it maintains its green color. However, the price has not yet surpassed the key resistance area at $539 – a decisive factor for a strong price increase next.
If BCH can close firmly above $539, the opportunity to advance to the levels of $568, $600 and $616 will become clearer, while creating momentum for buying power to return to the market. Conversely, if it cannot hold above $539, the risk will continue to shift towards lower price areas, with support levels at $521, $507 and $493 being crucial points to monitor closely. In the event that the overall market continues to weaken, BCH could even fall to $446.
In summary, although Bitcoin Cash is performing better than the overall crypto market, the prospects for a strong price increase are still not truly certain until buyers gain control of the important resistance area. The reversal scenario remains until BCH overcomes this challenge.
Mr. Teacher
Disclaimer: The information on this page may come from third parties and does not represent the views or opinions of Gate. The content displayed on this page is for reference only and does not constitute any financial, investment, or legal advice. Gate does not guarantee the accuracy or completeness of the information and shall not be liable for any losses arising from the use of this information. Virtual asset investments carry high risks and are subject to significant price volatility. You may lose all of your invested principal. Please fully understand the relevant risks and make prudent decisions based on your own financial situation and risk tolerance. For details, please refer to
Disclaimer.
