BNB (Previously known as Binance Coin) is fluctuating around the 855 USD mark at the time of writing on Tuesday, after a slight correction in the previous session. Selling pressure is becoming increasingly evident as on-chain data and derivatives market indicators show a strong increase in retail investors on the sell side, while funding rates have turned negative. From a technical perspective, risk signals continue to accumulate, forcing traders to remain cautious in the short term.
Increasing retail activity and negative funding rate exert pressure on BNB
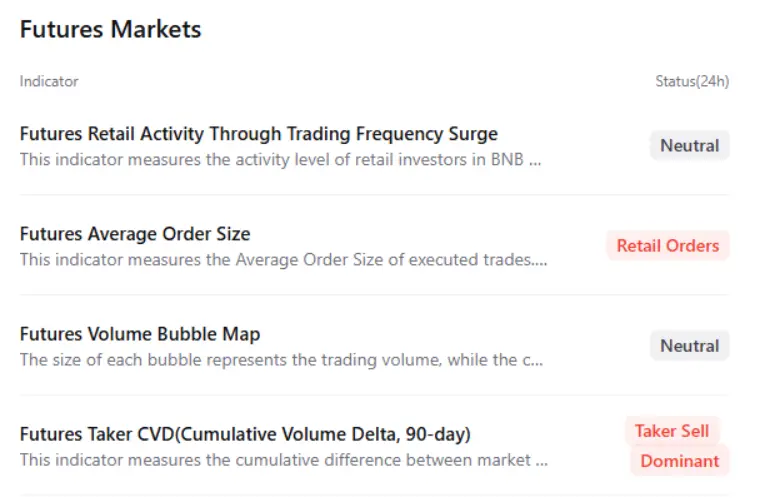
Aggregated data from the CryptoQuant futures market shows that the BNB Futures Average Order Size index — a measure of the average volume of matched BNB futures orders — is rising sharply. This development reflects a stronger participation of retail investors, a signal that is often unfavorable for BNB’s price trend.
Additionally, the Futures Taker CVD (Cumulative Volume Delta) index continues to indicate dominance of the sell side, further reinforcing a negative short-term outlook for BNB price.
Moreover, the OI-Weighted Funding Rate data from Coinglass shows that the number of traders betting on a decline in BNB outnumbers those expecting an increase. This index turned negative on Monday and recorded -0.006% on Tuesday, indicating that short positions are paying fees to long positions. Historically, whenever the funding rate drops into negative territory, BNB’s price tends to experience sharp corrections, increasing the risk of a significant decline in the current phase.
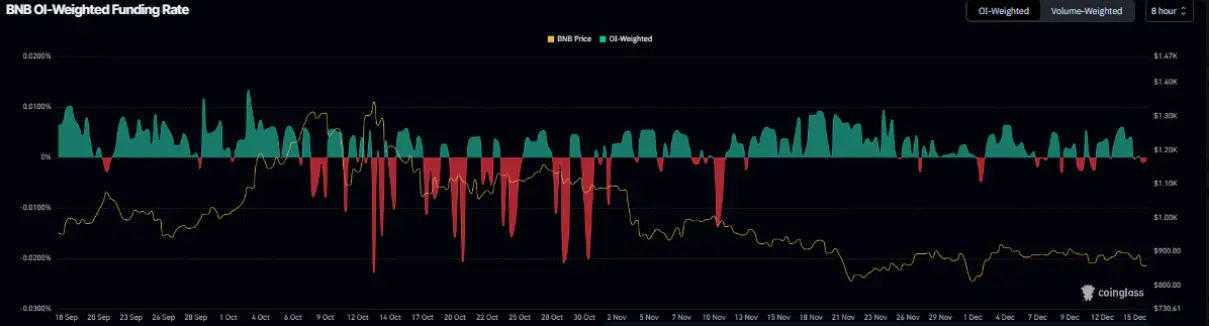 BNB Funding Rate | Source: Coinglass## BNB Price Forecast: Momentum indicators show early signs of weakening
BNB’s price was rejected at the descending trendline — formed by connecting the peaks since mid-October — on December 9, then plunged nearly 5% and retested the key support zone at 844 USD during the early trading session. On Tuesday, BNB continued to trade in the red, fluctuating around 853 USD, reflecting ongoing selling pressure.
In a negative scenario, if BNB continues to weaken and closes below 844 USD on the daily timeframe, the downtrend could extend, pushing the price further down to a stronger support zone on the weekly chart at 709.29 USD.
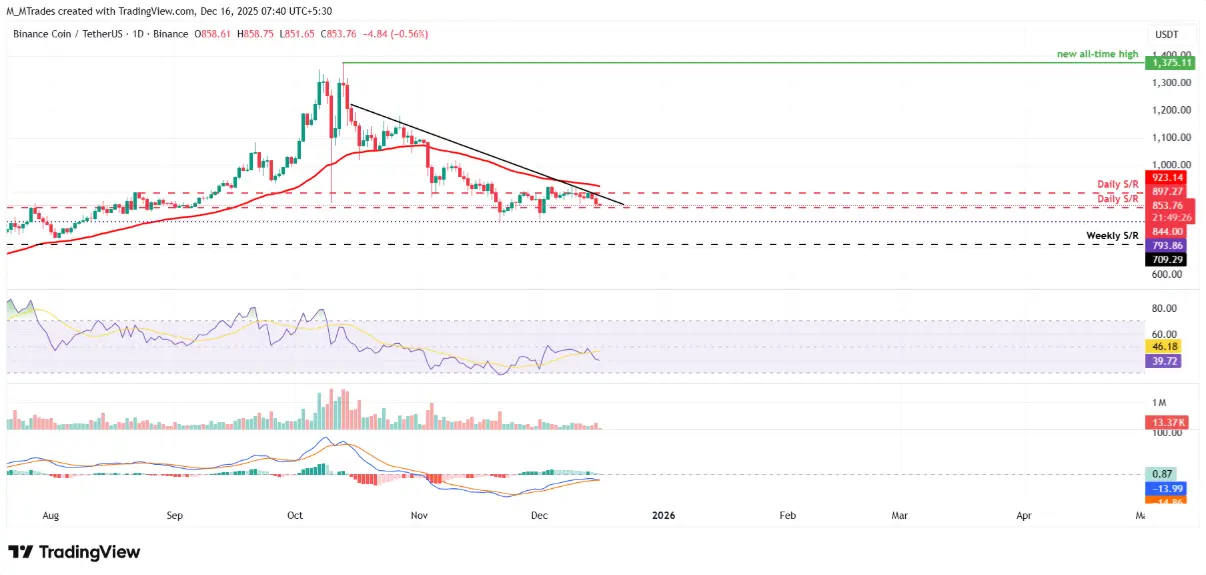 Daily BNB/USDT Chart | Source: TradingView Technical indicators are clearly leaning bearish. The daily RSI currently stands at 39, below the neutral 50 threshold and continues to decline, indicating increasing bearish momentum. Meanwhile, the MACD lines are converging, raising the risk of a bearish crossover — a factor that could further support the short-term correction outlook.
Conversely, if BNB successfully recovers, the upward momentum could extend toward the 50-day EMA, currently around 923.14 USD.
SN_Nour
Disclaimer: The information on this page may come from third parties and does not represent the views or opinions of Gate. The content displayed on this page is for reference only and does not constitute any financial, investment, or legal advice. Gate does not guarantee the accuracy or completeness of the information and shall not be liable for any losses arising from the use of this information. Virtual asset investments carry high risks and are subject to significant price volatility. You may lose all of your invested principal. Please fully understand the relevant risks and make prudent decisions based on your own financial situation and risk tolerance. For details, please refer to
Disclaimer.
Related Articles
Price Predictions 3/13: BTC ETH BNB XRP SOL DOGE HYPE ADA BCH XMR
The article discusses price predictions for various cryptocurrencies including BTC, ETH, BNB, XRP, SOL, DOGE, HYPE, ADA, BCH, and XMR, providing insights into market trends and forecasts.
CryptoBreaking6h ago
BNB Retests Support Zone While $629 Resistance Caps Short-Term Movement
BNB is trading at around $620.42 following a fall of 1.5 percent in a single day, whereas the pair versus Bitcoin is up 1.1 percent to 0.009158 BTC.
The immediate support of the price is at $615.14, and the immediate resistance is at $629.89 with a tight trading range of 24 hours.
The
CryptoNewsLand9h ago
Unibase Launches AI Agent Autonomous Wallet and Payment Protocol Unibase Pay on BNB Chain
Gate News, on March 13th, AI agent infrastructure Unibase launched AI agent autonomous wallet and payment protocol Unibase Pay on BNB Chain. The protocol uses x402 payment verification mechanism, enabling AI agents to automatically verify amounts, sign payloads, and complete on-chain settlements when receiving 402 responses. Additionally, Unibase provides each agent with a custodial wallet powered by Privy, allowing agents to directly access through MCP or
GateNews16h ago
BNB Chain AI agents exceed 34,000, surpassing Ethereum to become the largest AI agent network
According to Gate News, the ERC-8004 standard AI agents on BNB Smart Chain have exceeded 34,000, becoming the network with the most on-chain AI agents. Meanwhile, since the beginning of the year, ERC-8004 agents across all chains have increased to nearly 130,000, with on-chain transaction activity showing a significant rise.
GateNews22h ago