Token Curve DAO records a 6.6% increase in open contracts over the past 24 hours, according to data from Coinalyze — a signal often reflecting a significant rise in speculative activity and indicating that market momentum is gradually strengthening.
However, the price movement has gone in the opposite direction. During the same period, the price of Curve DAO (CRV) has decreased by 2.63%, extending the weakening trend with a decline of up to 9.9% in the last seven days.
The overall picture of the cryptocurrency market is also not very positive, as Bitcoin (BTC) was strongly rejected at the resistance zone of $90,000 on Wednesday, thereby exerting downward pressure that spread to altcoins.
In this context, the question arises: is this the right time to open short positions (Short) for CRV?
To answer, Coin Photon has conducted analysis on larger timeframes to assess the possibility of a bullish reversal or the continuation of the downward trend of CRV in the near future.
Multi-timeframe analysis reveals the next move for CRV
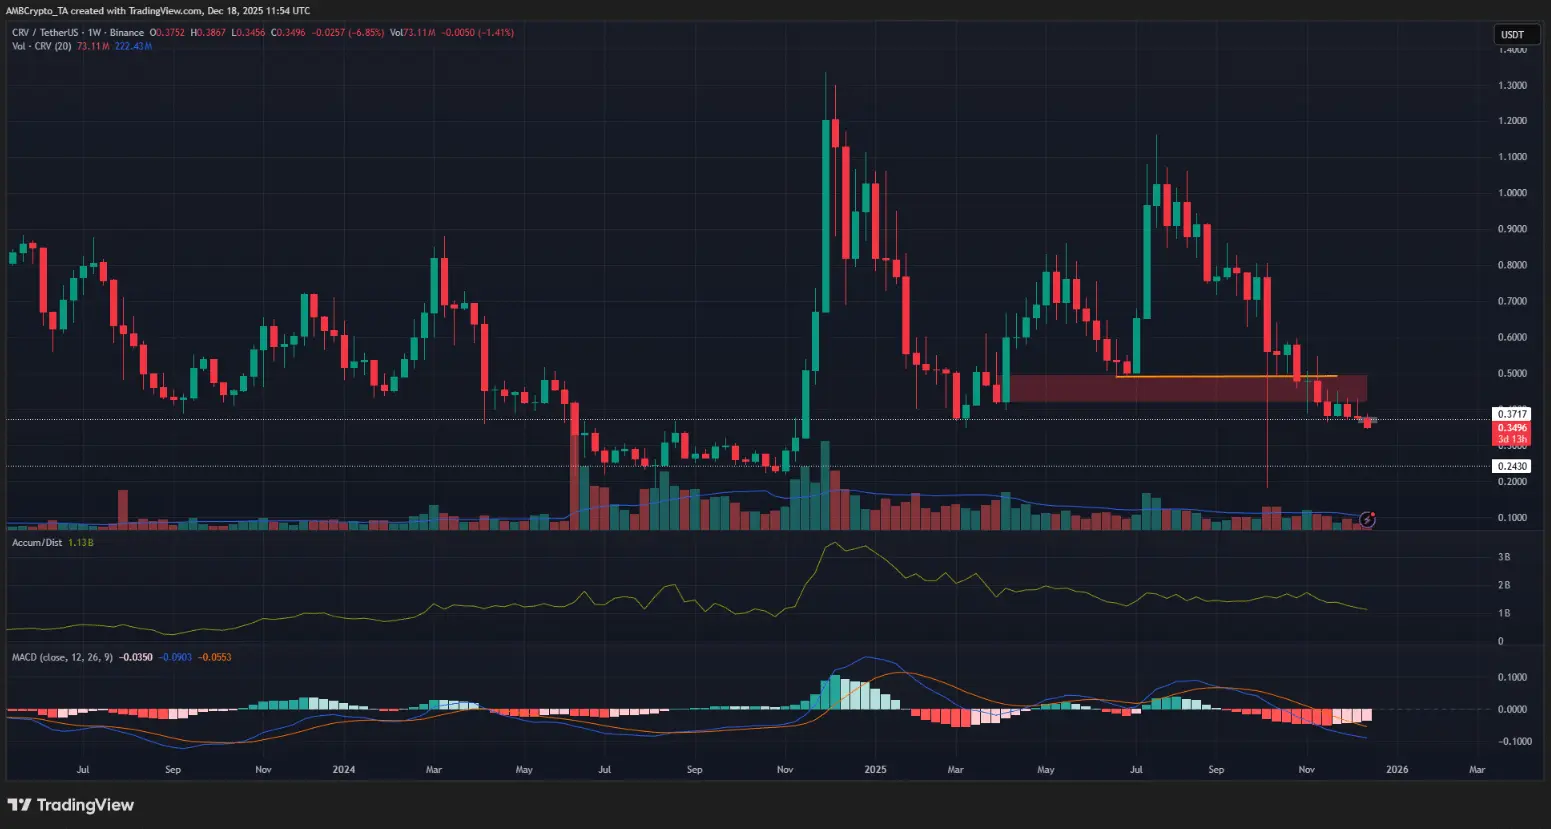 Weekly CRV/USDT chart | Source: TradingViewOn the weekly timeframe, the price structure clearly reflects a dominant downtrend, starting from the point when the price broke through the key support level of $0.49. Notably, the support zone formed in March around $0.37 was quickly overtaken by the bears, indicating a significant weakening of demand.
The A/D (Accumulation/Distribution) indicator has been continuously plunging throughout the month, reinforcing the signal that capital is flowing out of the market. Simultaneously, the weekly MACD continues to expand negatively, emphasizing that the bearish momentum remains very strong.
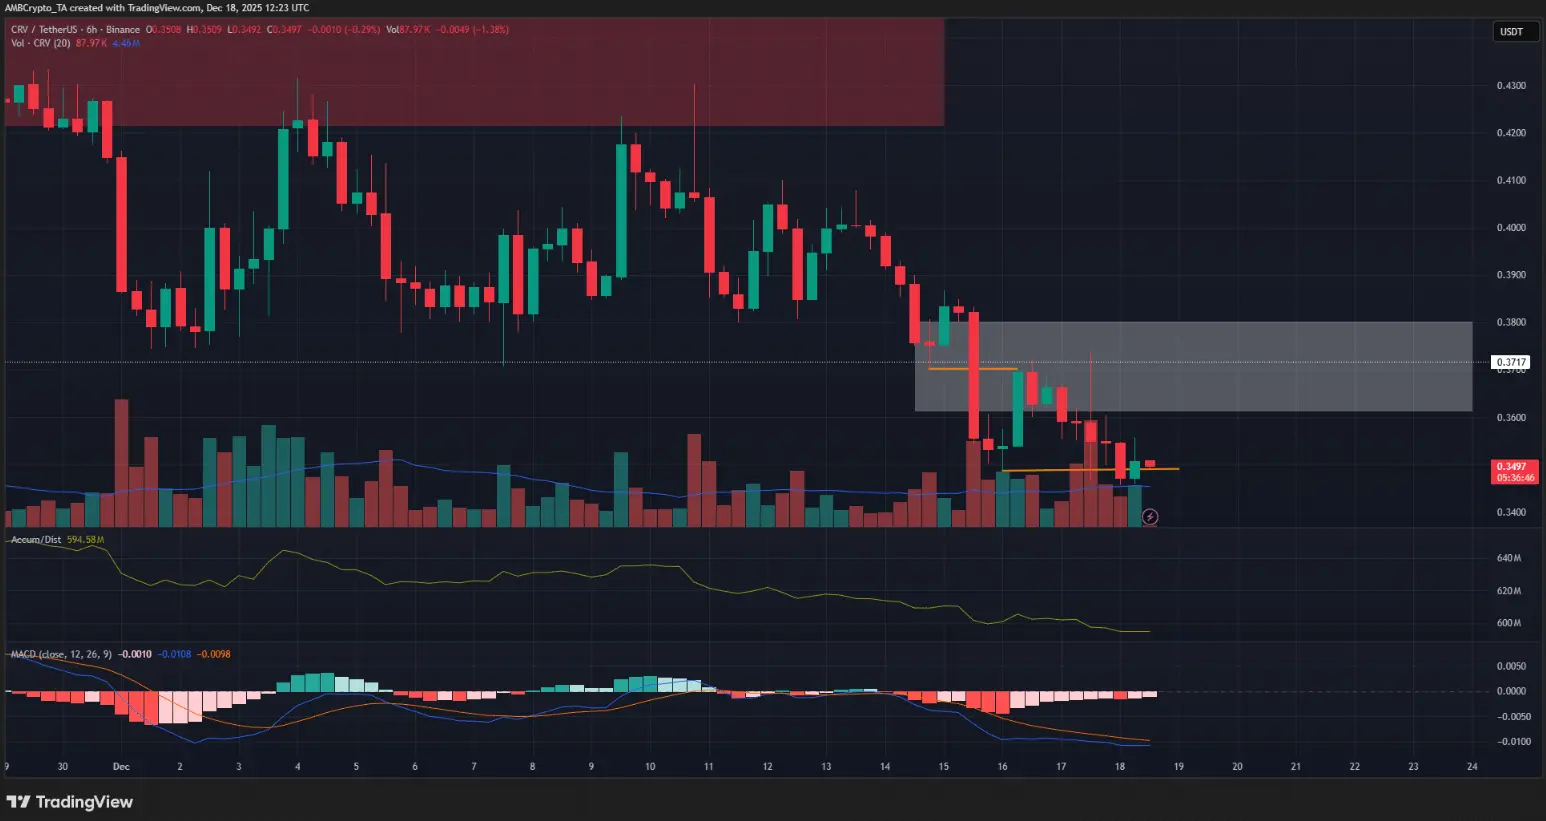 6-hour CRV/USDT chart | Source: TradingViewOn the lower timeframe, specifically the 6-hour chart, Curve DAO (CRV) continues to send favorable signals for a Short position strategy. The downtrend persists, with two consecutive breakdowns of the bearish structure, reflecting stable control by the bears.
Additionally, the price imbalance zone (fair value gap) above, extending up to the $0.38 (marked with a white box), was tested by the price before continuing to plunge, further supporting the short-term bearish scenario.
Invalidating the bearish scenario
From a technical analysis perspective, the market structure, price momentum, and volume indicators across both timeframes all agree that the bears are in control.
The preferred scenario for short positions (Short) will only be invalidated if CRV’s price suddenly reverses sharply, surges, and decisively breaks above the imbalance zone around $0.38, thereby weakening the current downward pressure.
Trader action – what’s the next target?
Based on the weekly timeframe chart analysis, the next likely support zone for CRV can be identified with high confidence.
Specifically, the $0.243 level is considered an important support zone, where Curve DAO tokens accumulated and traded from July to November 2024.
Before reaching this price zone, CRV is likely to react at short-term support levels at $0.329 and $0.298 — areas that could temporarily curb selling pressure and slow down the price correction.
Disclaimer: The information on this page may come from third parties and does not represent the views or opinions of Gate. The content displayed on this page is for reference only and does not constitute any financial, investment, or legal advice. Gate does not guarantee the accuracy or completeness of the information and shall not be liable for any losses arising from the use of this information. Virtual asset investments carry high risks and are subject to significant price volatility. You may lose all of your invested principal. Please fully understand the relevant risks and make prudent decisions based on your own financial situation and risk tolerance. For details, please refer to
Disclaimer.
Related Articles
This Crypto Trader Predicts Where the Zcash (ZEC) Price Is Headed Next
The ZEC price just ripped 15% higher in the last 24 hours, landing back among the top crypto gainers. The privacy coin is now trading just slightly below $270 after breaking out of a descending trendline that had held for months.
Analyst “Ardi” shared the chart on X, breaking down where the
CaptainAltcoin6m ago
Bitcoin ETF Six Consecutive Gains: Nearly 1 Billion USD Fund Inflow Drives BTC Rally Over 12%
On March 17, U.S. spot Bitcoin ETFs experienced net inflows for the sixth consecutive trading day, driving Bitcoin prices up more than 12%. Total net inflows reached $962.8 million, primarily supported by BlackRock and Fidelity. Despite smaller inflow scales, the sustained momentum has improved investor sentiment. Analysts believe short-term price movements are influenced by capital inflows and macroeconomic changes.
GateNews42m ago
TRUMP Token Whales Hit Five-Month High, Trump Dinner Effect Drives 36% Surge
Trump meme coin TRUMP surged approximately 36% following the announcement of an exclusive dinner event, with whale holdings reaching a five-month high. Large holders are actively increasing positions, but losses are also present in the market, indicating divergent investment behavior. Controversy sparked by political criticism may have limited impact on market performance, but regulatory investigation risks remain a concern to monitor.
MarketWhisper1h ago
Bitcoin Spot ETF Saw $760 Million in Inflows Last Week! But Whether the Rally Continues Requires Monitoring 3 Key Factors
US cryptocurrency spot ETFs showed a significant rebound last week, with Bitcoin and Ethereum recording net inflows of approximately $763.4 million and $160.9 million respectively, with prices bouncing back accordingly. Although the market is showing incremental buying signals, it still faces variables from central bank policies and geopolitical risks in the future. The market will continue to monitor ETF capital inflows and macroeconomic impacts.
CryptoCity1h ago
Market rally continues! Bitcoin returns to $75,000 level, ETF inflows persist
Bitcoin broke through $74,000 on March 16 as institutional capital flowed back into the market, with ETF net inflows reaching $1 billion, shifting market sentiment to bullish. Analysts predict Bitcoin could reach $80,000, but it is currently in a consolidation phase. $75,000 is a key resistance level; a breakout could lead to a test of $90,000, otherwise it risks a pullback.
区块客1h ago
