Date: Thu, Dec 18, 2025 | 11:00 AM GMT
The broader cryptocurrency market has been experiencing choppy price action over the past several weeks, a phase that began after the sharp sell-off on October 10. That correction dragged Ethereum (ETH) down by nearly 27% over the last 60 days, keeping sustained pressure on major altcoins, including DEX token** Aster ($ASTER).**
ASTER has fallen more than 25% over a week alone, extending its 60-day decline to roughly 42%. While the short-term trend remains firmly bearish, a closer look at the chart suggests something more constructive may be developing beneath the surface.
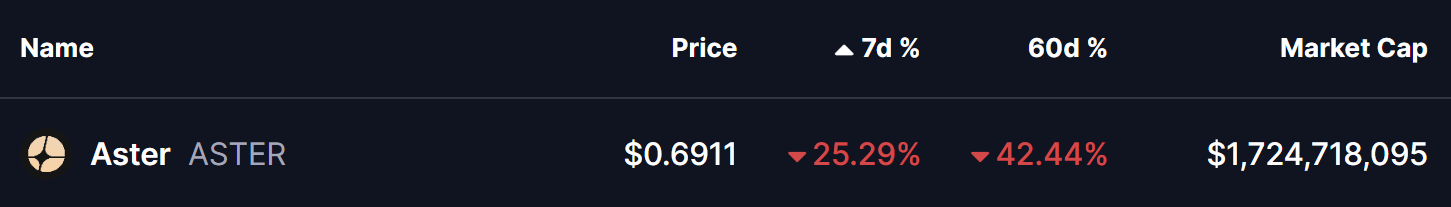
Source: Coinmarketcap
Interestingly, ASTER’s current structure is beginning to resemble the bottoming pattern previously seen in Hyperliquid (HYPE), a setup that ultimately led to a powerful trend reversal earlier this year.
ASTER Mirrors HYPE’s Bottoming Path
Aster appears to be tracing a price structure that closely aligns with HYPE’s April 2025 fractal — a period that preceded a multi-hundred-percent rally.
HYPE’s move began with a sharp correction following its all-time high. That decline eventually forced price below the 50-day moving average, confirming a shift in momentum. Rather than collapsing further in a straight line, HYPE transitioned into a rounding bottom structure, reflecting a gradual slowdown in selling pressure and the early stages of accumulation.
The token ultimately found its floor after a steep 73% drawdown from its peak, a point that marked clear seller exhaustion. From there, momentum shifted decisively. A clean reclaim of the 50-day moving average acted as the key confirmation signal, setting the stage for a breakout from the rounding bottom. What followed was a powerful 434% rally, making it one of HYPE’s most notable reversals of the year.
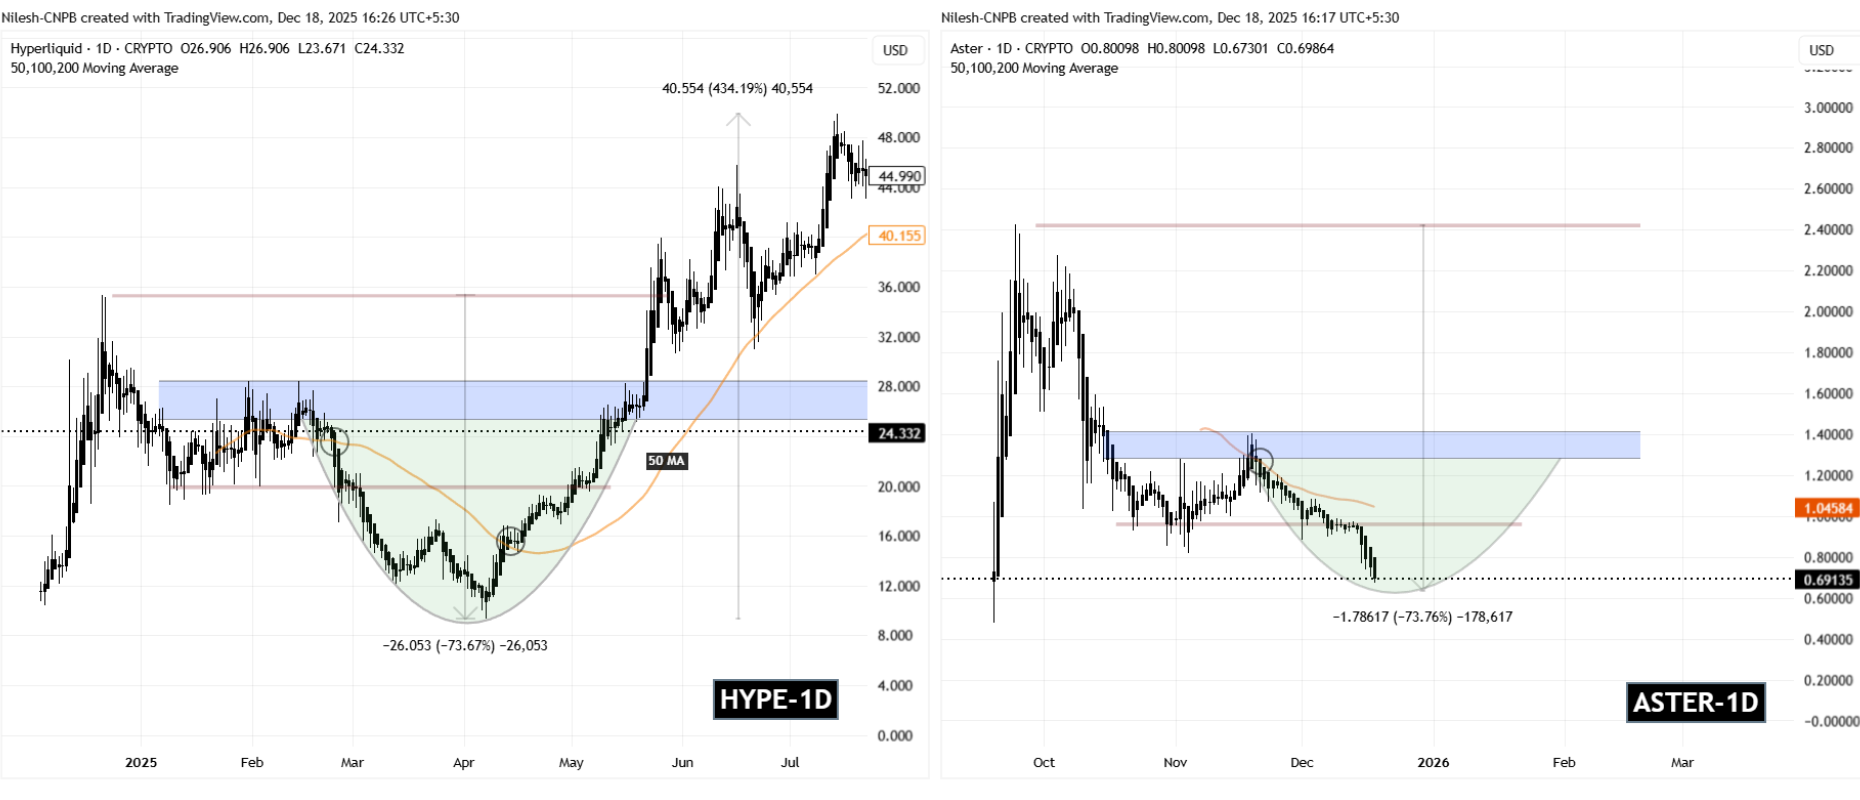
HYPE and ASTER Fractal Chart/Coinsprobe (Source: Tradingview)
Now, ASTER appears to be walking a similar road.
After topping out near its all-time high around $2.42, ASTER entered a prolonged corrective phase and slipped below its 50-day moving average. The chart now shows price carving out a potential rounding bottom, with the $1.30–$1.40 region acting as a key neckline zone. This structure closely mirrors HYPE’s pre-bottom behavior, as highlighted in the comparative chart.
What’s Next for ASTER?
If this fractal continues to unfold, ASTER may still face some near-term downside pressure. A deeper move toward the $0.60 area would complete a decline of roughly 73% from its all-time high — the same magnitude of correction where HYPE previously established its bottom.
From a bullish standpoint, the first meaningful signal to watch is a reclaim of the 50-day moving average, currently hovering near the $1.04 level. A sustained move above this zone would suggest that bearish momentum is weakening. If followed by a decisive breakout above the neckline resistance, ASTER could transition into a broader recovery phase, potentially echoing the type of upside expansion HYPE experienced after confirming its reversal.
Key Risk Note
While fractal similarities can offer valuable context, they do not guarantee identical outcomes. Market conditions, liquidity dynamics, and broader sentiment can differ significantly from one asset to another. Confirmation remains critical, and downside invalidation levels should be respected if the structure fails to hold.
For now, ASTER appears to be approaching a critical inflection point. Whether this evolving structure turns into a confirmed bottom or merely a pause before further weakness will depend on how price behaves around its moving averages and key support zones in the days ahead.
Disclaimer: The views and analysis presented in this article are for informational purposes only and reflect the author’s perspective, not financial advice. Technical patterns and indicators discussed are subject to market volatility and may or may not yield the anticipated results. Investors are advised to exercise caution, conduct independent research, and make decisions aligned with their individual risk tolerance.
Disclaimer: The information on this page may come from third parties and does not represent the views or opinions of Gate. The content displayed on this page is for reference only and does not constitute any financial, investment, or legal advice. Gate does not guarantee the accuracy or completeness of the information and shall not be liable for any losses arising from the use of this information. Virtual asset investments carry high risks and are subject to significant price volatility. You may lose all of your invested principal. Please fully understand the relevant risks and make prudent decisions based on your own financial situation and risk tolerance. For details, please refer to
Disclaimer.
Related Articles
Solana Approaches Major Triangle Breakout With $373 Target in Focus
Price action shows a tightening structure between descending resistance and a rising long-term support trendline.
The chart highlights $373.42 as a potential liquidity level if price breaks above the descending resistance.
The rising base trendline continues stabilizing price after the l
CryptoNewsLand34m ago
Cardano (ADA) Holds Top 10 Market Cap Rank as OI Surge Offsets Bears - U.Today
Cardano has regained its position in the Top 10 cryptocurrencies, currently ranking 10th with a market cap of $10.34 billion. The crypto market is experiencing a rally, with Cardano seeing significant volume increases and positive sentiment ahead of its upcoming Van Rossem hard fork.
UToday57m ago
Avalanche (AVAX) stands before a breakthrough opportunity thanks to strong buying power from the bulls
Avalanche (AVAX) has shown a 13% increase over the past week, maintaining trading above $10. Growing interest from individual investors and positive derivatives data indicate a potential bullish trend, despite ongoing geopolitical tensions.
TapChiBitcoin2h ago
APEPE Reclaims $0.051207 As Whale Buying Activity Sets a 500% Major Market Rally: Analyst
The Ape and Pepe (APEPE) coin shows signs that its market is approaching a potential big bounce. By reclaiming the $0.009000 level for the first time in almost a month and pushing past a multi-week consolidation range, the digital asset is displaying indicators of renewed bullish momentum,
BlockChainReporter3h ago
Bitcoin Veteran Buys $49 Million Worth of ETH as Experts Believe ETH Nears Breakout Price Levels
Bitcoin veteran buys $49 million worth of ETH.
Experts believe ETH is nearing major breakout prices.
ETH price could surge to $2,800 if it can hit $2,400.
The crypto community basks in high spirits as the price of Bitcoin (BTC) recovers targets over the $73,000 price range. At the
CryptoNewsLand3h ago
