

The TRON (TRX) price has reached a price zone that has stopped every rally for months. After a long stretch of lower highs, TRX is once again testing a downward trendline that sellers have defended repeatedly.
This test comes after a gradual climb from recent lows, bringing the market to a point where a decision is hard to avoid.
The price is no longer slipping lower. It is holding just beneath resistance and moving sideways with tighter swings. This kind of behavior often shows up before a clear move.
What matters now is whether buyers can push through this level, or if sellers step in and force another rejection.
- What the TRX Chart Is Showing
- TRON Price Momentum and Market Behavior
- TRX Short-Term Outlook
What the TRX Chart Is Showing
The chart shows a clear descending trendline stretching from prior highs, acting as a ceiling throughout the broader downtrend. Each rally into this zone has failed, keeping the structure bearish. This time, however, the approach looks different.
The TRX price is forming higher lows beneath the trendline, reducing downside momentum while gradually building pressure against resistance.
There has been support beneath the price as well, indicating that sellers do not fully have control. The longer the price is trapped in the rising support and falling resistance, the more likely it is to break out.
A clean break above the line, especially followed by acceptance above the line, would indicate the first structural change in several months. Failure here would likely send the TRON price back toward the lower range, keeping the broader trend intact.

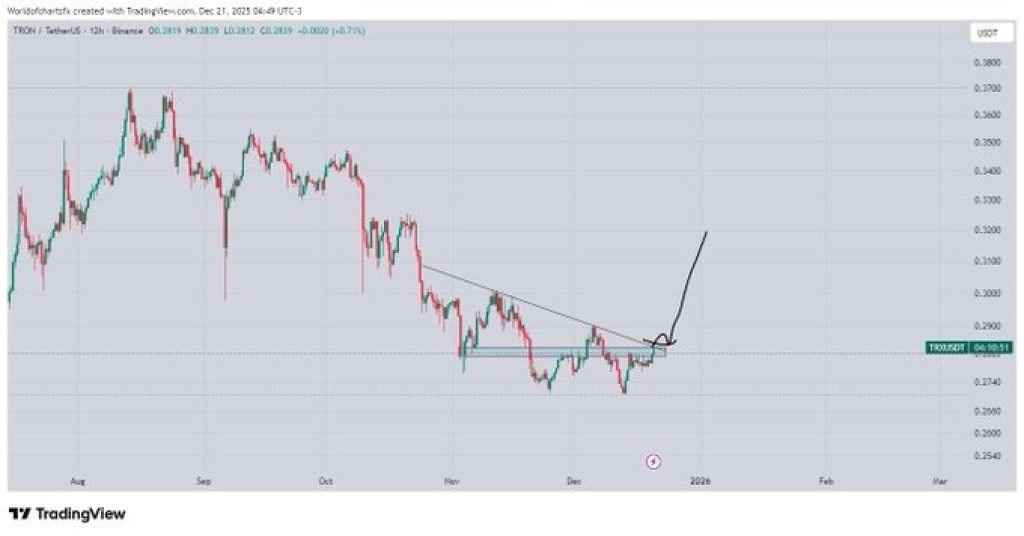
Source: X/WorldofCharts
TRON Price Momentum and Market Behavior
Momentum indicators reflect this balance. Selling pressure has cooled compared to earlier phases of the downtrend, while buying strength has not yet reached breakout conditions. This often signals indecision rather than exhaustion.
Volume has remained controlled, which fits with a market waiting for confirmation. A breakout attempt without volume would raise the risk of a fake move. In contrast, expanding volume on a trendline break would suggest real participation and improve the odds of continuation.
From a trend perspective, the TRX price remains technically bearish until proven otherwise. The descending structure is still valid, and buyers need to force a decisive shift to change that narrative.
_Read Also: _****Shiba Inu Shibarium Dispute: K9 Finance Finally Breaks Silence
TRX Short-Term Outlook
If the TRON price is able to move above the downward trend line and hold, the speed at which the momentum increases could accelerate as reluctant buyers make their moves.
Such a scenario would make possible a more general recovery pattern and would lead to the bias of the short-term indicator turning more to the upside.
If rejection occurs instead, the market likely revisits nearby support zones. Another failure at resistance would reinforce the existing downtrend and signal that sellers remain in control.
The TRX price is at a decision point. The next move away from this compression zone is likely to define direction in the near term, making this trendline test one of the most important technical moments for TRON in recent weeks.
Disclaimer: The information on this page may come from third parties and does not represent the views or opinions of Gate. The content displayed on this page is for reference only and does not constitute any financial, investment, or legal advice. Gate does not guarantee the accuracy or completeness of the information and shall not be liable for any losses arising from the use of this information. Virtual asset investments carry high risks and are subject to significant price volatility. You may lose all of your invested principal. Please fully understand the relevant risks and make prudent decisions based on your own financial situation and risk tolerance. For details, please refer to
Disclaimer.
Related Articles
NAV Price Surges 44.25%: Is a New Trend Emerging?
NAV coin recently surged by 44.25%, reaching $0.032715, amid increased trading activity and fluctuating market conditions. Analysts attribute this rally to rising on-chain activity and shifting sentiment toward altcoins, while traders monitor key price levels for future movements.
Coinfomania38m ago
Why TARA Just Skyrocketed 24.47% in 60 Minutes
TARA's price surged 24.47% to $0.000047 amid mixed signals in the crypto market and increased trading activity. Market conditions and macroeconomic factors are influencing investor sentiment, with traders closely monitoring key resistance and support levels.
Coinfomania38m ago
XRP Reclaims $1.40 Mark as Price Jumps 6%, Where Is Price Heading? - U.Today
XRP recently surpassed the $1.40 resistance level, driven by a 12.92% spike in trading volume to $2.63 billion. Renewed interest, notably due to a partnership with Mastercard, may help sustain upward momentum, with potential targets of $1.50 and $2. However, a drop below $1.39 could negate this breakout.
UToday1h ago
PI Jumps 16% After V20.2 Upgrade and AI Node Plans
Pi Network completed the V20.2 upgrade, ensuring node alignment and network stability for all operators.
AI node experiments tested decentralized computing, using spare node capacity to handle real AI tasks.
PI price jumped 16%, breaking resistance at $0.23, eyeing $0.28 as key target.
P
CryptoNewsLand2h ago
"Seeking a Sword by Marking a Boat" style coin price predictions go viral: the practical logic and flaws of mystical prophecies
Author: Frank, PANews
Whenever the market enters a confusing phase of stagnation, someone attempts to predict the next trend using a "cutting the cord at the boat" style of historical retrospection method. In such circumstances, people often see from these theories and charts that history is repeating itself, and seem to automatically overlap and verify future market movements with a certain period in the past.
This coincidence appears to have a magical effect and is often verified. Some bloggers claim that the accuracy rate of this type of prediction can reach 75%~80%.
Does this "cutting the cord at the boat" style price prediction that repeatedly goes viral on social media actually help the market identify phases, or is it packaging noise as prophecy?
From "Tick Fractals" to "History Rhymes"
The peak operation regarding the prediction of a market top in October 2025 comes from an analyst named CryptoBullet, who created a method called "tick
PANews2h ago