Bitcoin (BTC) fluctuated around the zone of 89,000 USD on Monday morning, as market sentiment became more optimistic with the start of the new week.
Analyst: Bitcoin will break out in an upward trend in the “next few days”
Data from TradingView shows that BTC/USD has been almost flat since the beginning of last week, with limited fluctuations within a clearly established price range.
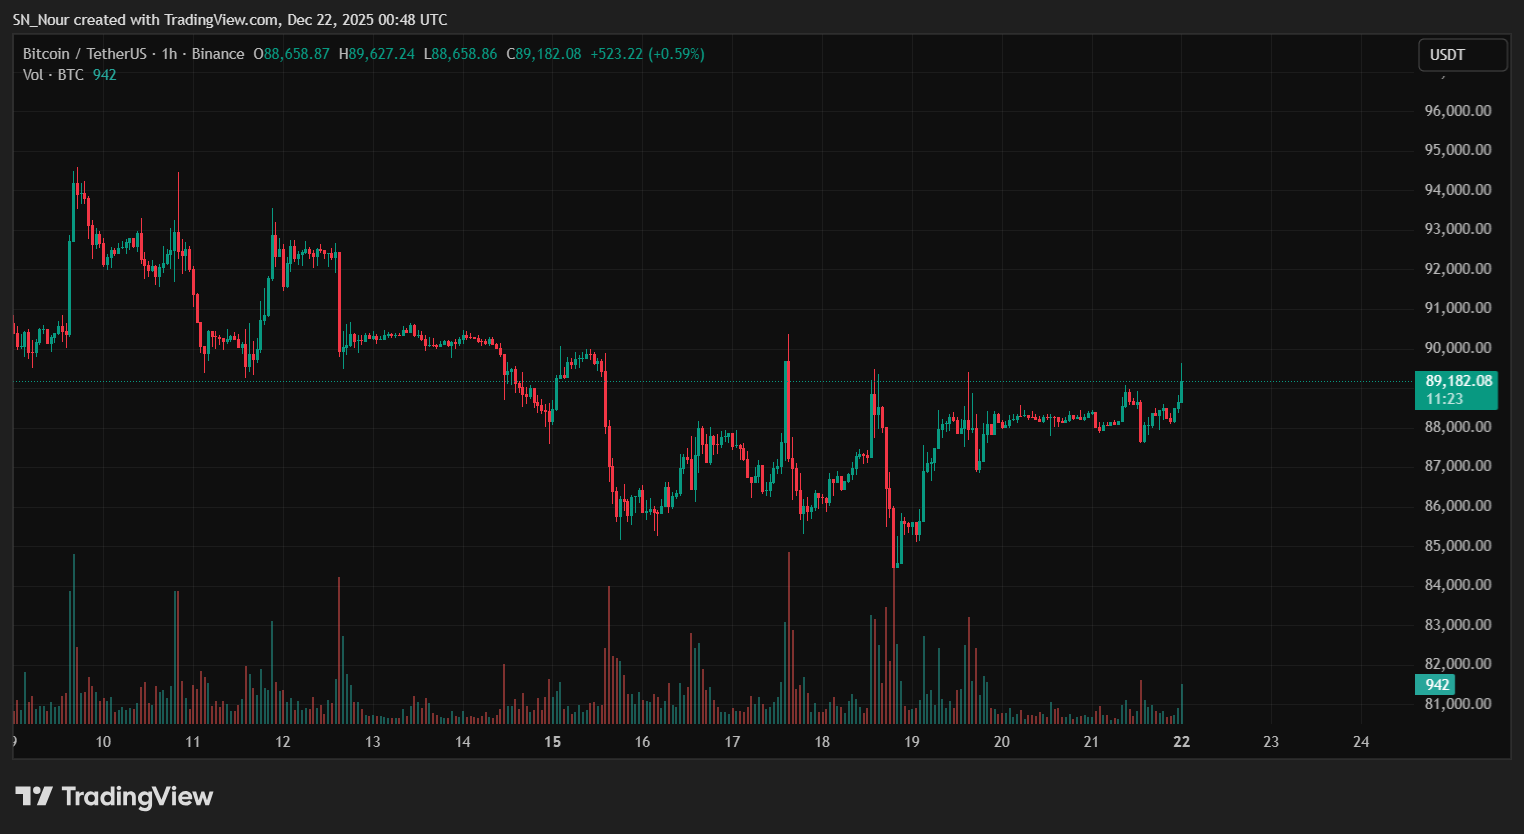 BTC/USD hourly chart. Source: TradingViewFor eight consecutive days, this currency pair has maintained trading within a range of approximately 5,000 USD, raising expectations within the community that a breakout is imminent. “
“The recovery of BTC may occur soon,” cryptocurrency analyst and entrepreneur Ted Pillows stated in his latest analysis published on X.
He believes that the price may experience a “pump” upwards to the zone of 98,000–100,000 USD before entering the next correction phase.
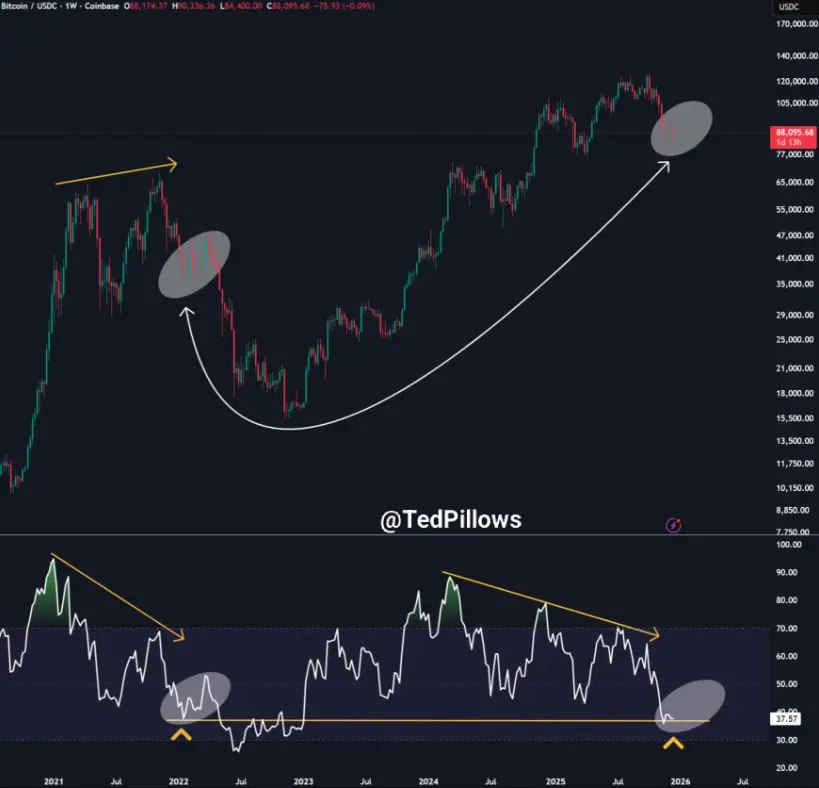 Weekly BTC/USDC chart with RSI data | Source: Ted Pillows/XThe weekly chart includes a comparison of the bearish divergences of the current relative strength index (RSI) with the period of 2021 — the last year of the previous bull market cycle of Bitcoin.
According to Pillows, the key is that the buying pressure must be strong enough to prevent the 100-week EMA from crossing below the corresponding SMA.
“The last two times this scenario occurred, it resulted in a drop of 40%-50% of BTC within just 4-6 weeks,” he warned.
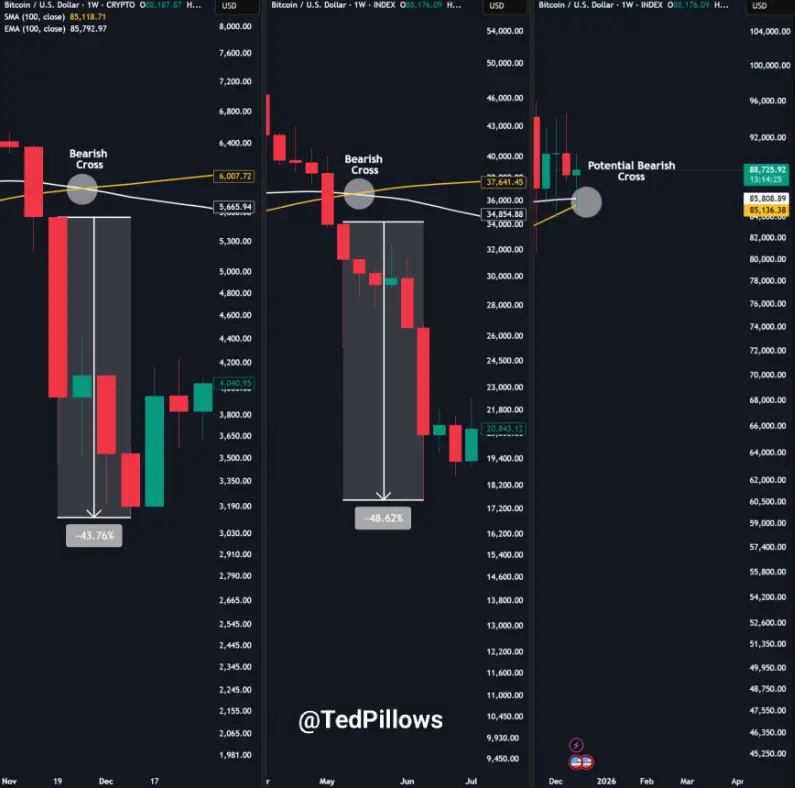 Comparing the weekly BTC/USD chart with the 100-day simple moving average (100 SMA) and the 100-day exponential moving average (100 EMA) | Source: Ted PIllows/XAnalyst Captain Faibik is one of the few voices daring to bet on a short-term reversal scenario toward an uptrend.
In the latest assessment, he stated that in the coming days, Bitcoin could witness a significant breakout, followed by a massive wave of FOMO from the market — a factor that he believes “will not bring sustainable benefits.” Captain Faibik also asserted that the current correction of BTC “is essentially complete.”
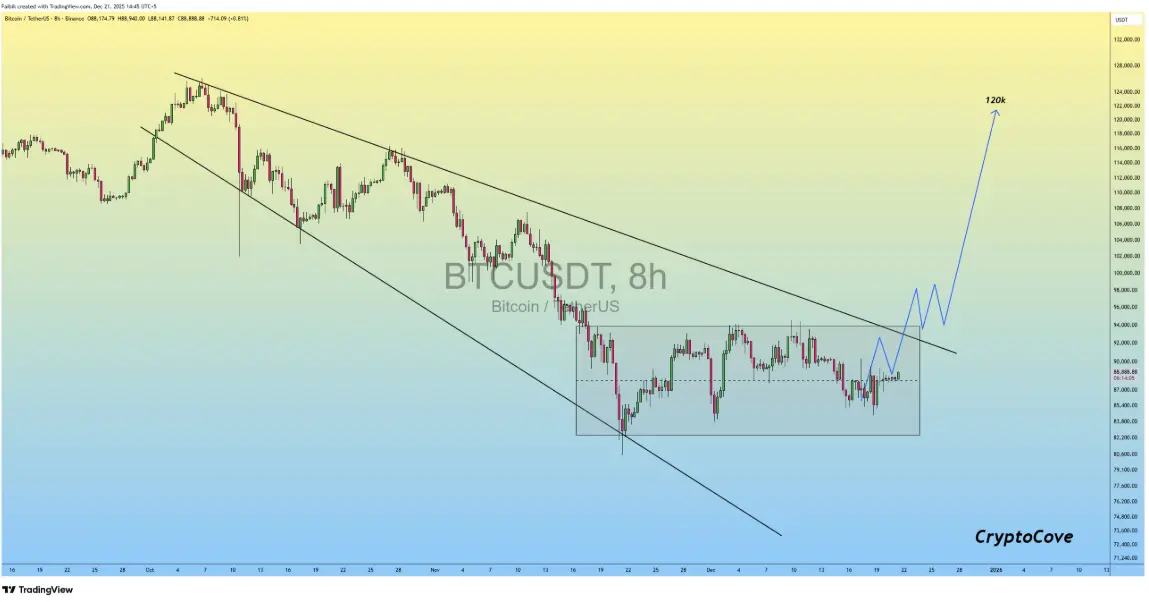 BTC/USDT chart on the 8-hour frame | Source: Captain Faibik/In another perspective, the trading account Korinek_Trades remains optimistic about the long-term outlook, believing that new historical highs for Bitcoin are still ahead, even though the market may have to go through another macro bottom before accelerating.
“The price structure still supports the possibility of forming a new high in wave W5 (green), heading towards ATH to complete the 5-wave pattern,” Korinek_Trades wrote on platform X, based on Elliott wave theory to outline the next scenario for Bitcoin.
According to this analysis, the long-term price target for BTC is expected to reach 150,000 USD.
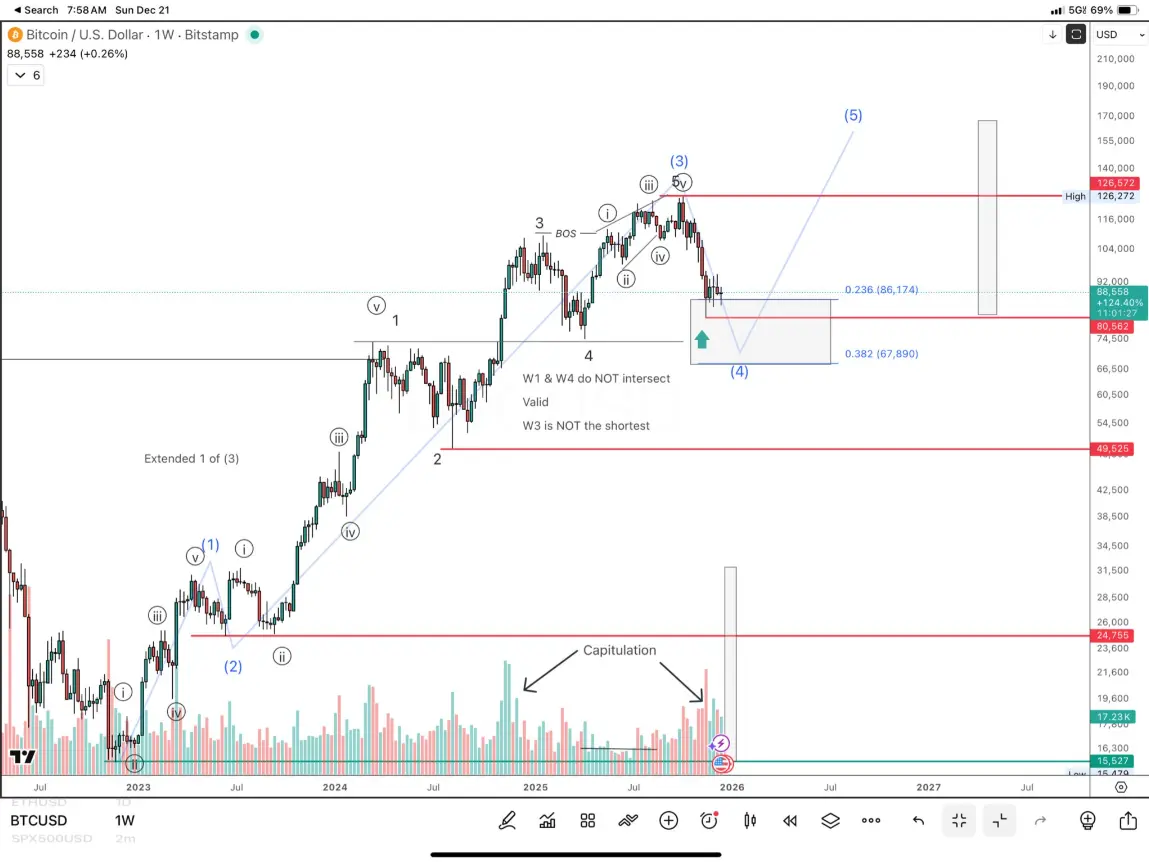 BTC/USD chart over a week with trading volume data | Source: Korinek_Trades/X## Will Bitcoin return to the 70,000 USD mark?
On the contrary, the on-chain analysis platform CryptoQuant warns that Bitcoin may return to test the old peaks around the 70,000 USD zone in the near future.
According to CryptoQuant's assessment, Bitcoin is currently in a “fragile” state, vulnerable to deeper correction waves in areas with strong demand.
“The next important price reduction target lies in the high demand zone of 70,000–72,000 USD, where the market is likely to see a significant increase in buying power,” noted a CryptoOnchain contributor in a Quicktake analysis.
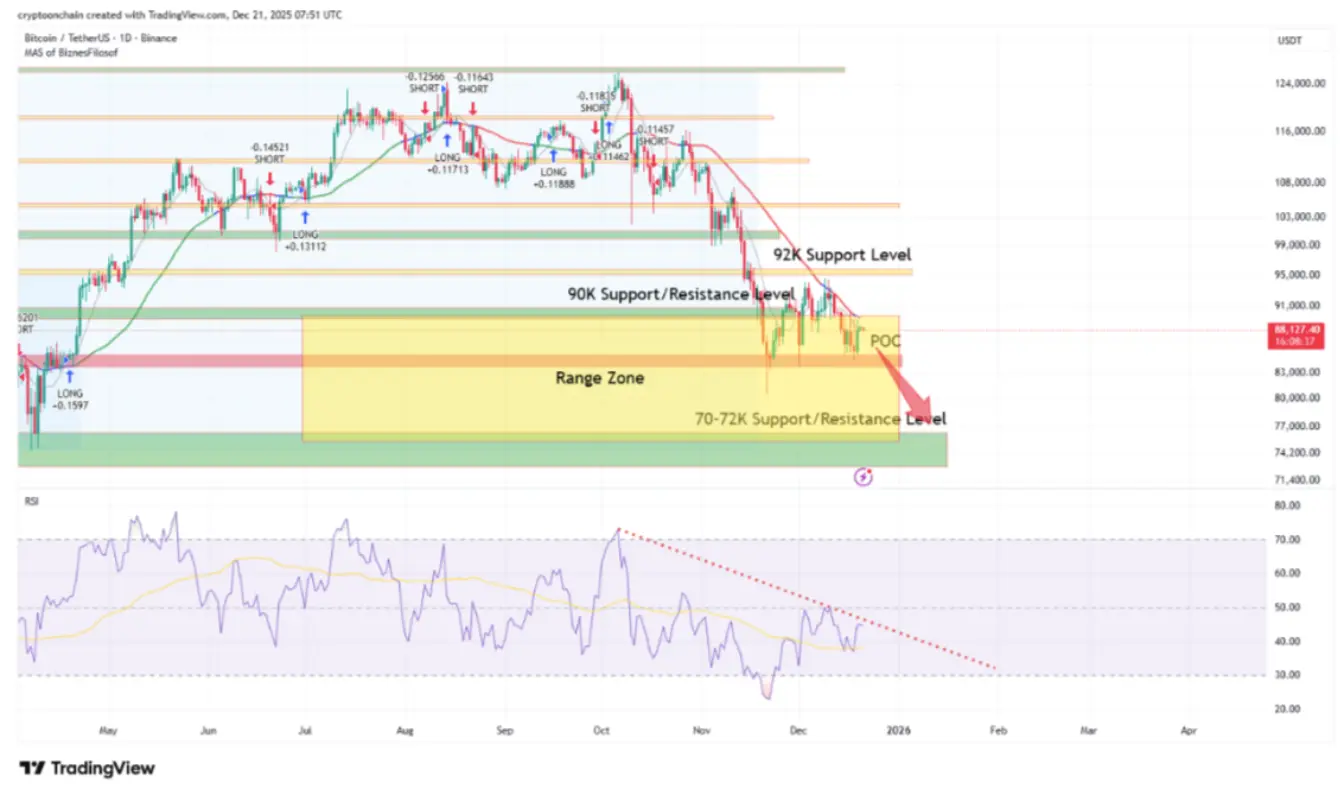 The daily BTC/USD chart with RSI data | Source: CryptoQuantAdditionally, CryptoOnchain also notes that the amount of BTC flowing into the Binance exchange is trending upwards, thereby increasing selling pressure in the market.
“The combination of breaking the technical threshold of 90,000 USD and approximately 1.4 billion USD worth of BTC being deposited into Binance has significantly increased the probability of a correction occurring in the zone of 70,000–72,000 USD,” the article concludes.
SN_Nour
Disclaimer: The information on this page may come from third parties and does not represent the views or opinions of Gate. The content displayed on this page is for reference only and does not constitute any financial, investment, or legal advice. Gate does not guarantee the accuracy or completeness of the information and shall not be liable for any losses arising from the use of this information. Virtual asset investments carry high risks and are subject to significant price volatility. You may lose all of your invested principal. Please fully understand the relevant risks and make prudent decisions based on your own financial situation and risk tolerance. For details, please refer to
Disclaimer.