Date: Tue, Dec 23, 2025 | 10:20 AM GMT
The broader cryptocurrency market continues to struggle with uneven and choppy price action, a phase that began following the sharp sell-off on October 10. That correction dragged Ethereum (ETH) lower by nearly 20% over the past 60 days, keeping risk appetite subdued across the altcoin space. Pump.fun (PUMP) has not been spared from this weakness, remaining firmly under selling pressure as market sentiment stays cautious.
PUMP is now down more than 57% over the past two months, and while volatility has eased slightly in recent sessions, the daily chart reveals a technical structure that strongly favors further downside rather than an immediate recovery.
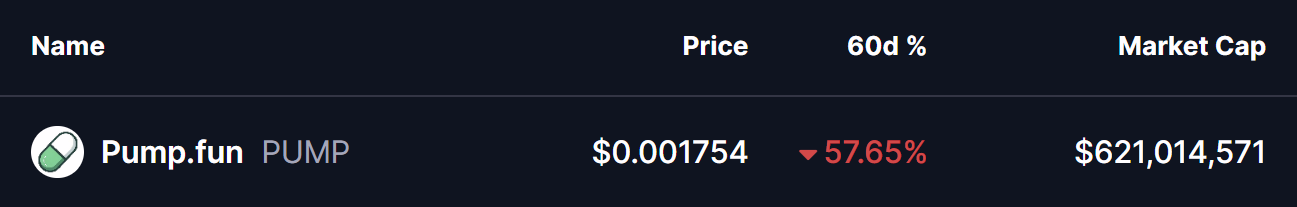
Source: Coinmarketcap
Head and Shoulders Breakdown Confirms Bearish Shift
On the daily timeframe, PUMP formed a textbook head and shoulders pattern — one of the most widely followed bearish reversal formations in technical analysis. The structure began to take shape in late August, with the left shoulder forming near the $0.004 area, followed by a sharp rally that pushed price to a higher peak, creating the head near $0.0095.
The right shoulder developed in early November, topping out around $0.00548 before momentum clearly faded. This failure to reclaim previous highs signaled growing weakness among buyers and set the stage for a breakdown.
As selling pressure increased, PUMP slid toward the neckline support near the $0.0035 zone — a level that had previously acted as a strong demand area. The chart shows that this support ultimately gave way, confirming the head and shoulders breakdown. Once price lost the neckline, downside momentum accelerated, driving PUMP toward the $0.00175 region.
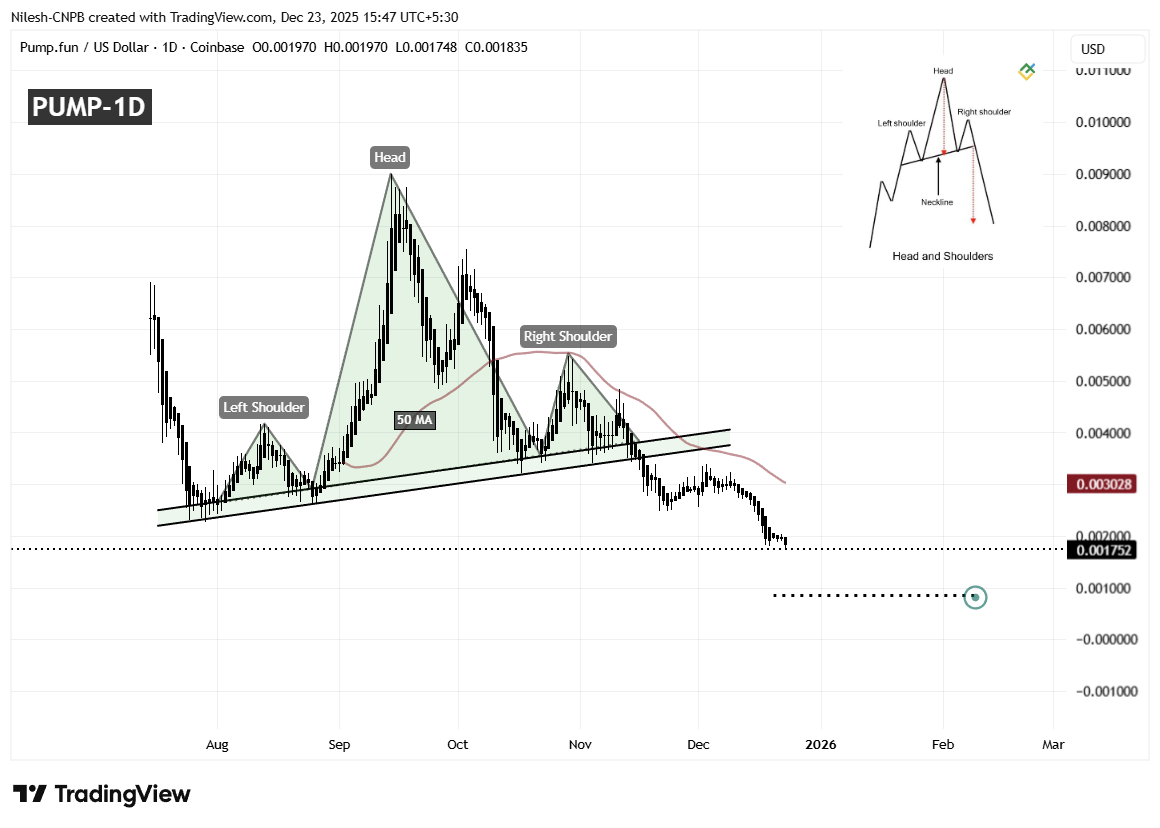
PUMP Daily Chart/Coinsprobe (Source: Tradingview)
This move represents a clear shift in market structure, with sellers firmly in control and bullish momentum largely exhausted.
What’s Next for PUMP?
With the breakdown now confirmed, attention turns to how PUMP behaves around former support levels. The $0.0035 neckline zone has flipped into resistance, and any relief bounce into this area that fails to reclaim it would likely reinforce the bearish outlook.
If downside pressure persists, the measured move from the head and shoulders pattern points toward a potential target near $0.00085. This level aligns with the projected breakdown objective and could act as a temporary pause point if selling accelerates further.
On the upside, a short-term relief rally cannot be ruled out, particularly if broader market conditions stabilize. A reclaim of the 50-day moving average near $0.003028 could trigger a bounce. However, even in that scenario, the overall structure would remain bearish unless PUMP can establish sustained acceptance above this level.
Until then, the trend favors caution, with sellers maintaining the upper hand and downside risks remaining elevated.
**Disclaimer: **The views and analysis presented in this article are for informational purposes only and reflect the author’s perspective, not financial advice. Technical patterns and indicators discussed are subject to market volatility and may or may not yield the anticipated results. Investors are advised to exercise caution, conduct independent research, and make decisions aligned with their individual risk tolerance.
Disclaimer: The information on this page may come from third parties and does not represent the views or opinions of Gate. The content displayed on this page is for reference only and does not constitute any financial, investment, or legal advice. Gate does not guarantee the accuracy or completeness of the information and shall not be liable for any losses arising from the use of this information. Virtual asset investments carry high risks and are subject to significant price volatility. You may lose all of your invested principal. Please fully understand the relevant risks and make prudent decisions based on your own financial situation and risk tolerance. For details, please refer to
Disclaimer.
Related Articles
CFX 4-hour chart reaches a new high for the phase, with approximately 14% increase over 24 hours
Gate News: On March 15, market data shows that CFX reached a new phase high on the 4-hour K-line chart, with prices touching approximately 0.06282 USDT at their peak, representing a 24-hour gain of around 14%. Some community members believe this rally may be related to recent macroeconomic catalysts. Earlier, media outlets citing sources reported that Iran is considering allowing certain tankers to pass through the Strait of Hormuz on the condition that petroleum transport be settled in Chinese yuan. Related discussions have once again sparked market attention toward yuan stablecoins and cross-border payment narratives.
GateNews56m ago
After the network upgrade: What prospects await SOL?
The official approval of protocol SIMD-0266 aims to optimize computing efficiency on the Solana network by introducing p-tokens, simplifying transaction processing. This upgrade, set for April, has prompted increased buying activity and could lead to significant cost reductions and performance improvements.
TapChiBitcoin1h ago
Track FET's journey to the $0.24 milestone as the AI cryptocurrency sector records its most positive trading week in months
The cryptocurrency industry related to AI has recently recorded an impressive performance. According to data from CoinMarketCap, the total market capitalization of this sector has grown 16% in just the past week. Many leading tokens in this category have also achieved significant growth, attracting
TapChiBitcoin2h ago
DeFi enters a "winter of yields": liquidity stagnation, leverage contraction, and the disappearance of arbitrage opportunities
Since September 2025, the DeFi market has entered a "interest rate winter," with the annualized deposit yields of mainstream stablecoins dropping to lows, and supply and demand imbalances causing excess liquidity. As borrowing demand declines, stablecoin lending rates have also decreased, and the reduced risk appetite in the crypto market has led investors to shift toward more stable assets. Some protocols, such as Sky, offer stable returns through real-world assets, but the overall trend still indicates a period of adjustment and structural reform in DeFi.
区块客2h ago
Crypto Analyst and Expert Says Bull Market Is Confirmed as Bitcoin Survives Shakeout
Crypto analyst and expert says bull market is confirmed.
Bitcoin survives a shakeout nd mirrors 2022 price chart.
This shows a positive sign for BTC to set a new ATH price soon.
The crypto market seems to be heading into a strong recovery phase as the price of Bitcoin (BTC) recovers pr
CryptoNewsLand3h ago
Crypto Market Shows Gradual Growth As Top Assets Turn Green
The global crypto market saw a slight increase in total capitalization, while trading volume dropped significantly. Bitcoin and Ethereum prices rose modestly, with notable gains from altcoins like $DOGS, $PI, and $PEPE. DeFi TVL rose slightly, but NFT sales volume fell sharply. Key developments included new investments in gold-related tokens and Aave's launch of Aave Shield to reduce transfer slippage.
BlockChainReporter3h ago