 Bitcoin price often tells its story quietly before it becomes obvious. While headlines focus on short-term moves, some analysts spend more time studying the structure and behavior that repeats over time. One of those analysts is Xanrox, a well-known crypto analyst on TradingView who focuses heavily on market structure, liquidity zones, and long-term patterns rather than daily noise.
In a recent TradingView chart analysis, Xanrox highlighted a technical structure that has been shaping BTC price for weeks. The pattern has not disappeared, even as Bitcoin attempts short recoveries. According to the analysis, the market is still moving within a defined framework that could matter more as the calendar turns.
Bitcoin price often tells its story quietly before it becomes obvious. While headlines focus on short-term moves, some analysts spend more time studying the structure and behavior that repeats over time. One of those analysts is Xanrox, a well-known crypto analyst on TradingView who focuses heavily on market structure, liquidity zones, and long-term patterns rather than daily noise.
In a recent TradingView chart analysis, Xanrox highlighted a technical structure that has been shaping BTC price for weeks. The pattern has not disappeared, even as Bitcoin attempts short recoveries. According to the analysis, the market is still moving within a defined framework that could matter more as the calendar turns.
- Bitcoin Descending Parallel Channel Continues To Guide BTC Price Action
- BTC Price Structure Still Favors Resistance Over Breakout
- Bitcoin Support Levels Show Where BTC Price Could Move Next
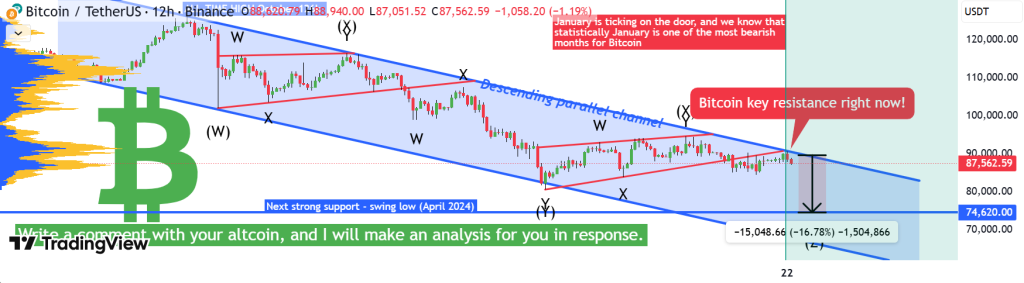
Bitcoin Descending Parallel Channel Continues To Guide BTC Price Action
Xanrox explains in his TradingView analysis that Bitcoin is currently trading inside a blue descending parallel channel. This channel has been respected multiple times on both the upside and downside, creating a consistent rhythm of lower highs and lower lows. Bitcoin price has not broken out of this structure, which keeps the broader trend intact.
BTC price movements inside a channel often look confusing on lower timeframes. Zooming out makes the structure clearer. Xanrox points out that as long as Bitcoin remains inside this descending channel, expectations of sustained upside remain limited.
Xanrox / TradingView
BTC price is now sitting close to the upper boundary of the descending channel. Xanrox highlights this zone as a critical area where Bitcoin has repeatedly struggled. The region around $90,000 to $91,000 aligns with prior rejections on the chart, making it an area where price behavior deserves attention.
Another technical element reinforces this level. The analysis notes an unfilled fair value gap between $91,000 and $92,000. Gaps like this often act as resistance when price approaches them. Bitcoin price pushing into this zone without a confirmed breakout keeps the structure bearish rather than bullish.
BTC Price Structure Still Favors Resistance Over Breakout
One key theme in Xanrox’s TradingView work is understanding where price sits within a structure. BTC price near resistance inside a descending channel does not signal strength by default. The analysis emphasizes that resistance zones are typically where downside moves begin, while support zones are where price stabilizes.
Bitcoin price moving lower from resistance would not break the pattern. It would simply follow the logic of the channel. Xanrox stresses that structure matters more than sentiment when evaluating BTC price direction.
The analysis also considers timing. January has historically been one of the more challenging months for Bitcoin price. Xanrox does not frame this as a guarantee but rather as context that becomes relevant when BTC price is already near resistance.
When seasonality aligns with structure, the chart deserves extra attention. Bitcoin entering January without breaking above the descending channel keeps the current setup intact and limits bullish assumptions.
Bitcoin Support Levels Show Where BTC Price Could Move Next
On the lower side of the channel, Xanrox identifies key support zones that have previously attracted demand. One major level sits around $74,620, which marks a prior swing low earlier in the year. This level stands out as a potential area where Bitcoin price could stabilize if the channel continues to play out.
BTC price moving toward support would not represent panic or failure. According to the TradingView analysis, it would reflect normal behavior inside a well defined structure.
Read Also: Everyone Is Bearish on XRP Again—Here’s Why That’s Not a Bad Thing
Xanrox’s approach throughout the analysis remains consistent. Bitcoin price is viewed through structure, not emotion. BTC price reacts to zones, trends, and timing rather than narratives or short-term excitement.
As the new year approaches, Bitcoin continues to move inside a channel that has quietly dictated its behavior. Whether BTC price respects support again or tests resistance once more, the structure outlined by Xanrox remains the key reference point. Watching how Bitcoin behaves inside this framework may offer clarity before the next major shift becomes clear.
Disclaimer: The information on this page may come from third parties and does not represent the views or opinions of Gate. The content displayed on this page is for reference only and does not constitute any financial, investment, or legal advice. Gate does not guarantee the accuracy or completeness of the information and shall not be liable for any losses arising from the use of this information. Virtual asset investments carry high risks and are subject to significant price volatility. You may lose all of your invested principal. Please fully understand the relevant risks and make prudent decisions based on your own financial situation and risk tolerance. For details, please refer to
Disclaimer.
Related Articles
BTC broke through $73,000 this morning, ETH broke through $2,200
Gate News: On March 16, market data shows BTC broke through $73,000 this morning, currently trading at $72,941; ETH broke through $2,200, currently trading at $2,182.
GateNews21m ago
Next Crypto to Explode: Pepeto Staking Pays $20,900 Yearly While BTC Miners Dump and DOGE Flatlines
Publicly listed Bitcoin miners have sold more than 15,000 BTC since October as margins tighten according to CoinDesk. The miners who once held conviction are now selling to survive, and traders searching for the next crypto to explode are watching capital rotate from miners into
CaptainAltcoin52m ago
Basel rule changes could unlock huge Bitcoin liquidity: Analyst
The Basel III framework governing bank capital requirements is set for an update in 2026, with potential implications for the crypto ecosystem. The outcome could hinge on how the largest digital asset is treated in risk-weight calculations, and analysts warn
CryptoBreaking1h ago
BTC 15-minute decline of 0.70%: Whale selling drives short-term pullback
2026-03-15 23:15 to 2026-03-15 23:30 (UTC), BTC price declined 0.70% in just 15 minutes, with a price range of 72464.7 to 73115.9 USDT and an intraday volatility of 0.89%. The anomaly occurred during the night when liquidity was lower, with concentrated short-term selling pressure triggering market attention, and price fluctuations notably intensified compared to daytime levels.
The primary driver of this anomaly was on-chain monitoring detecting multiple large BTC transfers flowing into exchanges, indicating that whales or institutions were conducting active selling operations, with selling pressure in liquidity
GateNews1h ago