
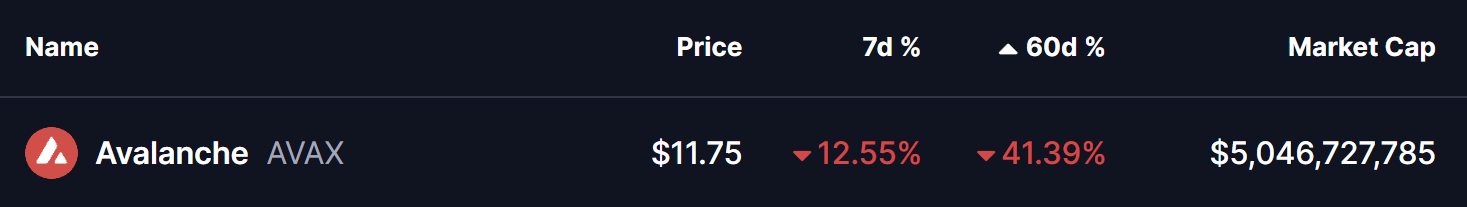
The broader cryptocurrency market has been experiencing choppy price action over the past several weeks, a phase that began after the sharp sell-off on October 10. That correction dragged Ethereum (ETH) down by nearly 22% over the last 60 days, keeping pressure firmly on major altcoins — including **Avalanche (AVAX).**
AVAX has slipped more than 12% over the past week alone, extending its 60-day decline to over 41%. While the short-term trend remains weak, a closer look at the higher-timeframe chart suggests that the sell-off may be approaching an area where downside momentum starts to fade.
Source: Coinmarketcap
Falling Wedge Pattern in Play
On the weekly chart, AVAX continues to trade inside a well-defined falling wedge pattern. This structure has been guiding price action since early 2024 and is characterized by lower highs and lower lows that gradually compress into a narrowing range. Historically, falling wedges often reflect slowing selling pressure rather than aggressive distribution.
As shown on the chart, the latest decline has pushed AVAX directly into the lower boundary of this wedge, near the $11.64 region. This zone has acted as a critical demand area in the past, repeatedly attracting buyers and triggering short-term rebounds. Once again, price is reacting near this level, suggesting that sellers may be losing strength as AVAX presses into long-term support.
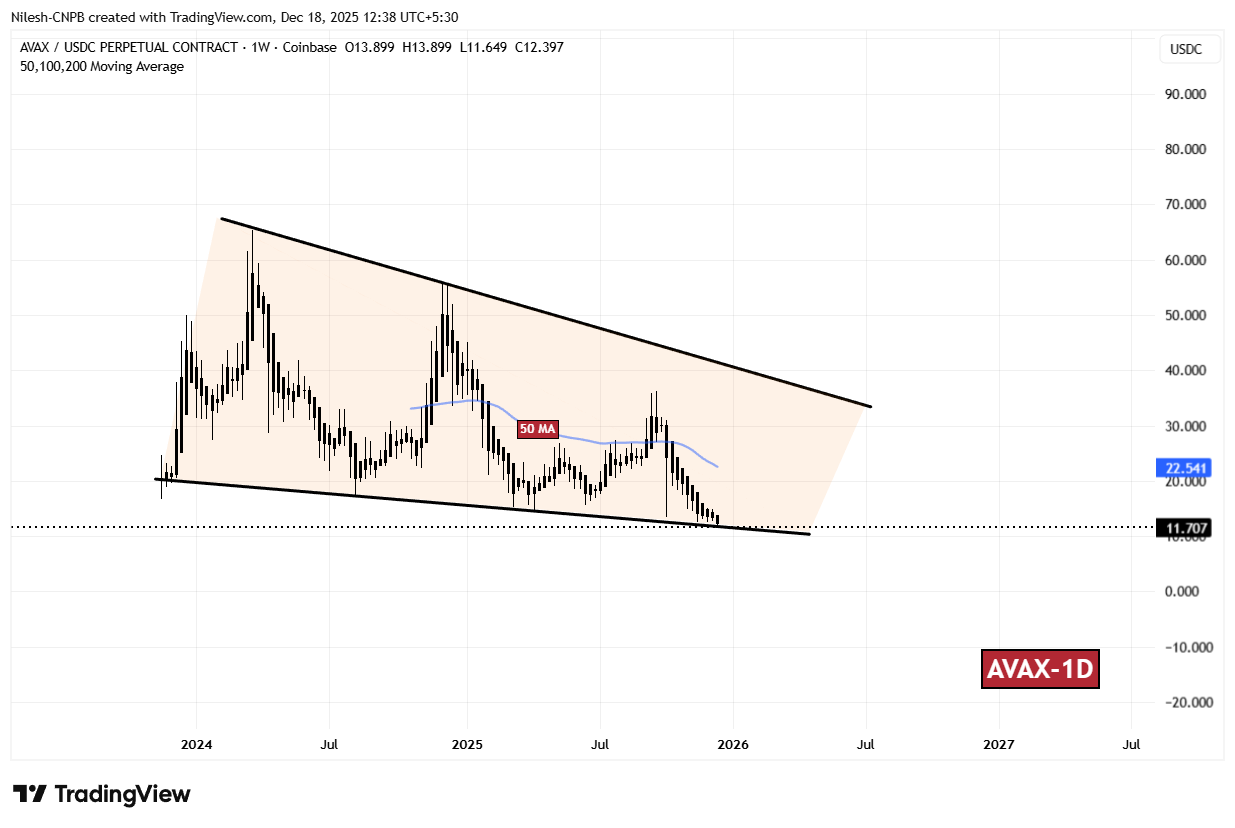
AVAX Weekly Chart/Coinsprobe (Source: Tradingview)
The repeated defenses of the wedge’s lower trendline, combined with shrinking downside follow-through, point to growing indecision rather than panic selling. This behavior often precedes a stabilization phase or a relief bounce.
What’s Next for AVAX?
If AVAX continues to hold above the wedge floor, the focus will shift to whether buyers can reclaim key overhead levels. The first major hurdle sits at the 50-week moving average, currently near $22.54. This level has consistently acted as dynamic resistance during prior recovery attempts and remains a key marker for any trend change.
A sustained move above this moving average would strengthen the bullish case and potentially open the door for a push toward the upper boundary of the falling wedge. Reaching that zone would signal a meaningful shift in market structure and sentiment.
That said, the setup remains conditional. A decisive weekly close below the wedge’s lower boundary would invalidate the pattern and expose AVAX to further downside risk, with the next notable support area emerging near the $9.00 level.
For now, AVAX sits at a technically important crossroads. While broader market conditions remain fragile, the compression within this falling wedge suggests that a larger move may be approaching — with the coming weeks likely to determine whether this support zone becomes a base for recovery or a stepping stone to deeper losses.
Disclaimer: The views and analysis presented in this article are for informational purposes only and reflect the author’s perspective, not financial advice. Technical patterns and indicators discussed are subject to market volatility and may or may not yield the anticipated results. Investors are advised to exercise caution, conduct independent research, and make decisions aligned with their individual risk tolerance.
Disclaimer: The information on this page may come from third parties and does not represent the views or opinions of Gate. The content displayed on this page is for reference only and does not constitute any financial, investment, or legal advice. Gate does not guarantee the accuracy or completeness of the information and shall not be liable for any losses arising from the use of this information. Virtual asset investments carry high risks and are subject to significant price volatility. You may lose all of your invested principal. Please fully understand the relevant risks and make prudent decisions based on your own financial situation and risk tolerance. For details, please refer to
Disclaimer.
Related Articles
Here’s Why River (RIVER) Price Is Pumping Today
RIVER's price surged 25% to $27.54, driven by a bullish inverse head-and-shoulders breakout and increased trading volume. Analysts project further gains as traders respond to market conditions and ongoing ecosystem campaigns, indicating strong support for the price.
CaptainAltcoin2h ago
Brandt Spotlights 'Ugly' Bitcoin Pattern - U.Today
Peter Brandt advises Bitcoin traders to remain flexible amidst conflicting technical setups: a potential bullish "horn" pattern and a bearish "flag" pattern. He criticizes the dogmatic mindset of some in the crypto community, emphasizing adaptable trading strategies over fixed opinions.
UToday3h ago
XRP Ledger Hits 7.7M Holders as Price Jumps 14%
XRP Ledger's adoption hit 7.7 million wallets after 13 years, with a surge in active addresses to 46,767 as its price rose 14%. The cryptocurrency now faces resistance at $1.55–$1.70, indicating a cautious upward trend.
CryptoFrontNews3h ago
AHR999 Index Falls Below 0.45 for First Time in 837 Days
Gate News bot message, The AHR999 Index has dropped below 0.45, marking the first occurrence in 837 days. This level was last observed in February 2026. Prior to that, the index reached this zone in October 2023, preceding the price movement from $28K to $72K. The source notes this is not a buy sign
GateNews5h ago
XRP Supply Shift: Whales Add 200 Million Tokens as Price Eyes $1.50 - U.Today
XRP has seen a significant increase in whale activity, with 200 million XRP bought recently, while network activity and wallet numbers reach new highs. A "golden cross" signals potential price rises, as the SEC clarifies crypto asset regulations.
UToday7h ago
