Bitcoin (BTC) retreated below the $87,000 USD level, indicating weakening demand at higher price ranges. In a post on X, Glassnode reported that the 30-day simple moving average (SMA) of net inflows into Bitcoin and Ethereum ETFs has turned negative, signaling “a less active market phase, with declining participation and partial withdrawals by institutional allocators.”
Not only institutions, but also individual investors and short-term traders are showing a clear decline. Data from CryptoQuant shows that the 30-day SMA of active addresses has fallen to around 807,000 — the lowest in the past year.
Notably, the 30-day SMA of deposit and withdrawal addresses on Binance has also hit its yearly low, reflecting prolonged indecision and a lack of breakout momentum in the market.
So, what are the key support zones investors should watch for BTC and top altcoins? Let’s analyze the charts of the 10 largest cryptocurrencies to find the answer.
Technical Analysis of BTC
Buyers pushed the price above the 20-day exponential moving average (EMA) at $88,850 USD on Monday, but the long wick indicates strong selling pressure at higher levels.
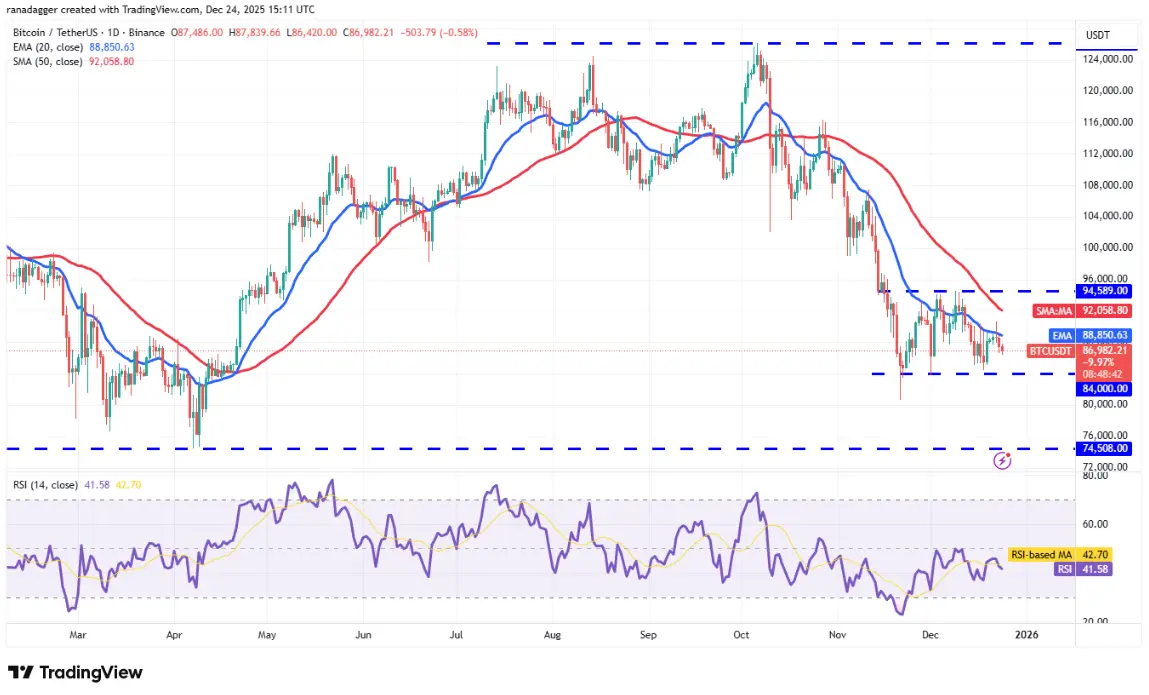 Daily BTC/USDT Chart | Source: TradingView Bears will try to pull the price back to the key support zone at $84,000 USD — an area expected to attract buying interest. If Bitcoin rebounds from $84,000 USD and breaks above the 20-day EMA, it suggests a potential short-term sideways consolidation. The BTC/USDT pair could trade within a range from $84,000 to $94,589 for some time.
Conversely, if the price breaks below $84,000 USD, it signals a continuation of the downtrend. The pair could then slide to $80,600 USD and even the critical support at $74,508 USD.
Technical Analysis of ETH
Ether (ETH) broke above the 20-day EMA at $3,010 USD on Monday, but the bulls failed to overcome the 50-day SMA at $3,088 USD.
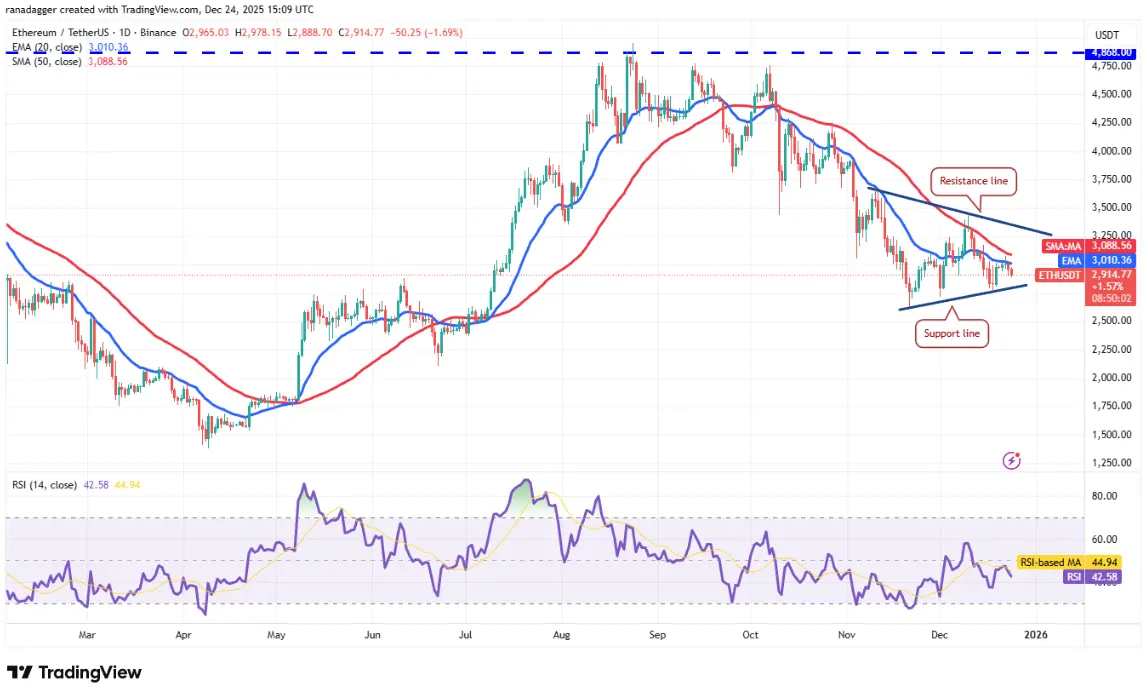 Daily ETH/USDT Chart | Source: TradingView The bears are attempting to regain control by pushing Ether below the support line of the symmetrical triangle pattern. If successful, ETH/USDT could drop sharply to $2,623 USD and then to $2,373 USD.
On the other hand, if the price rebounds strongly from the support line and moves above the moving averages, it indicates the pair may continue to oscillate within the triangle pattern for a while longer. Buyers will truly return when ETH closes above the resistance line.
Technical Analysis of BNB
BNB reversed from the 20-day EMA at $865 USD on Monday, indicating selling pressure even during short-term recoveries.
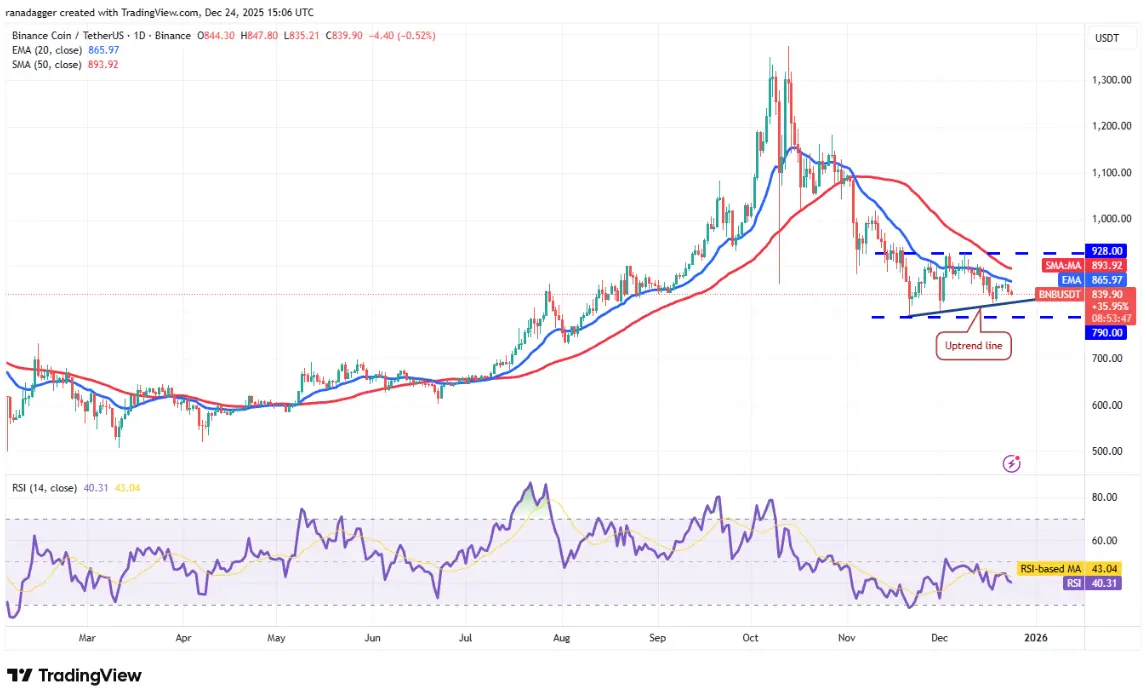 Daily BNB/USDT Chart | Source: TradingView The BNB/USDT pair faces the risk of breaking below the upward trendline. If that happens, BNB could plunge toward $790 USD. This is a critical level that bulls need to defend, as a breakdown could lead to further declines toward $730 USD.
Alternatively, if the price rebounds from the trendline or the $790 USD zone and breaks above the 20-day EMA, it suggests a potential recovery to $928 USD. Closing above $928 USD could open the way for a rally toward $1,019 USD, signaling that the correction phase may be over.
Technical Analysis of XRP
XRP continues to decline toward the support of the descending channel pattern, indicating bears are in control.
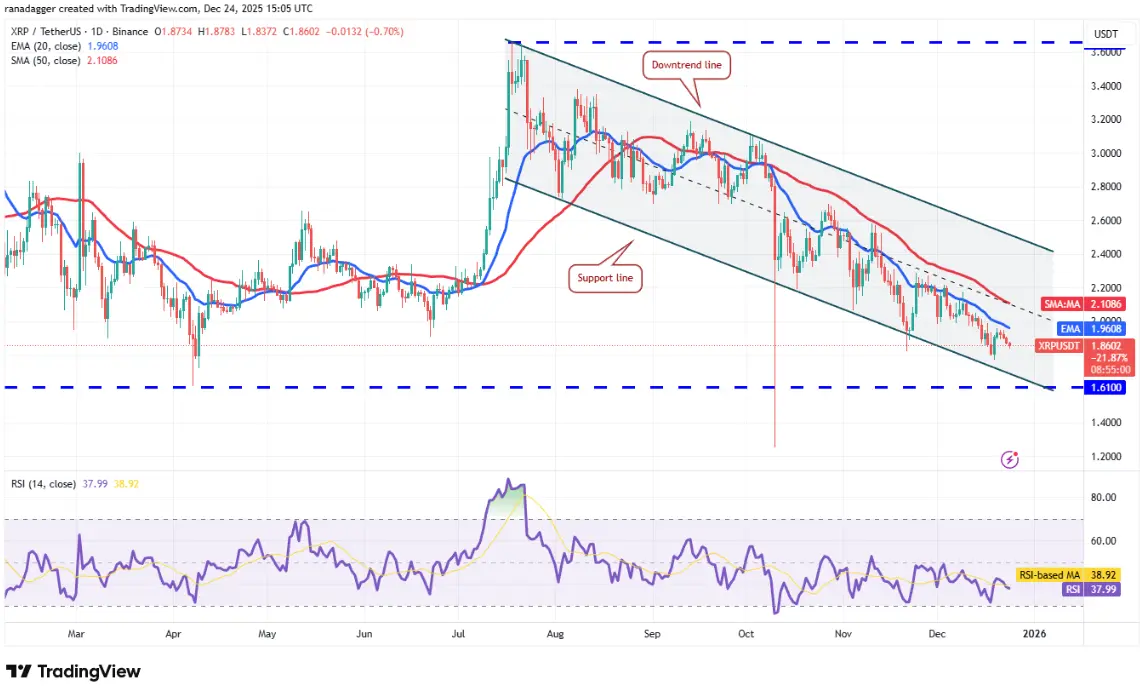 Daily XRP/USDT Chart | Source: TradingView Bulls are expected to defend the $1.61 USD level aggressively, but if bears dominate, XRP/USDT could sharply fall to the October 10th low at $1.25 USD.
Conversely, if the price rebounds from the support line and moves above the moving averages, it suggests the pair may continue to move within the downtrend channel for some more time.
Bulls will regain control when the price closes above the downtrend line. At that point, the pair could surge toward $3.10 USD.
Technical Analysis of SOL
Solana’s inability to break above the 20-day EMA at $128 USD indicates each recovery is met with selling.
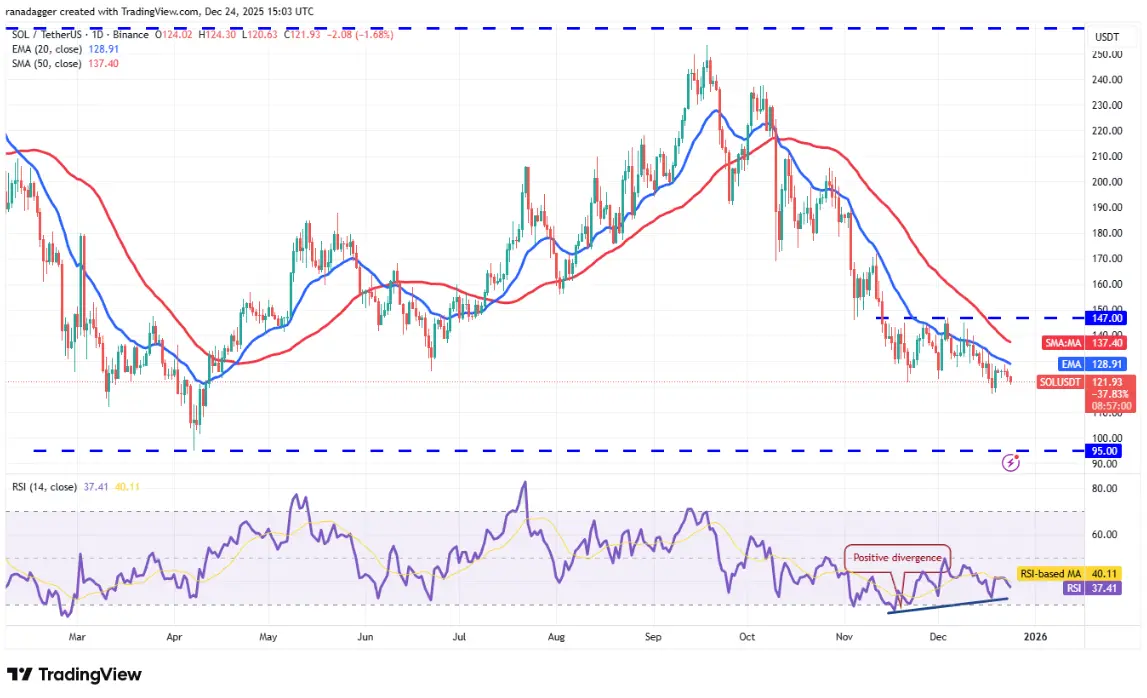 Daily SOL/USDT Chart | Source: TradingView The SOL/USDT pair faces the risk of breaking below $116 USD. If that occurs, Solana could decline sharply to $108 USD and then to the key support zone at $95 USD, where buying interest is expected to emerge.
On the upside, bulls need to push the price above the moving averages to signal strength. A short-term trend reversal would be confirmed if the pair breaks above the resistance at $147 USD. Then, the price could move toward $172 USD.
Technical Analysis of DOGE
Dogecoin reversed from the 20-day EMA at $0.13 USD on Tuesday, showing bears still control the trend.
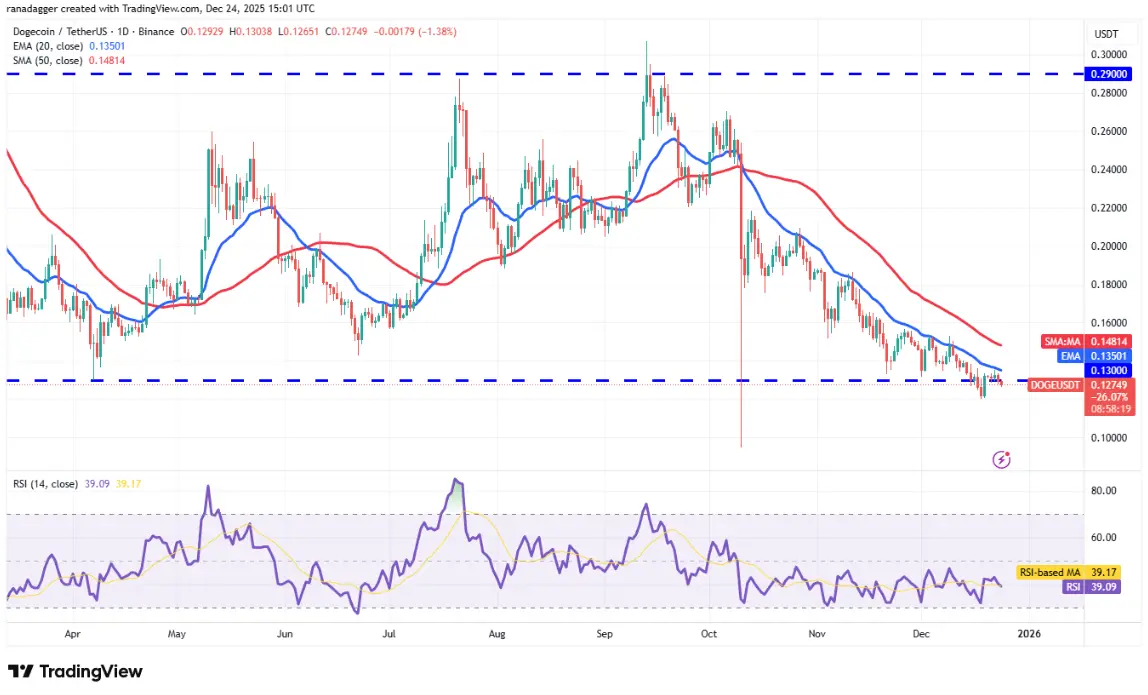 Daily DOGE/USDT Chart | Source: TradingView Sellers will attempt to initiate a new downtrend by pushing DOGE below $0.12 USD. If successful, DOGE/USDT could fall to the October 10th low at $0.10 USD.
This negative outlook will be invalidated in the short term if the price rebounds from the current zone and moves above the moving averages. This indicates the market has rejected the breakdown below the support zone at $0.13 USD. Then, the pair could recover to $0.16 USD and continue toward the $0.19 USD level.
Technical Analysis of ADA
Cardano (ADA) has reversed from the $0.37 USD level, indicating bears are trying to turn this area into resistance.
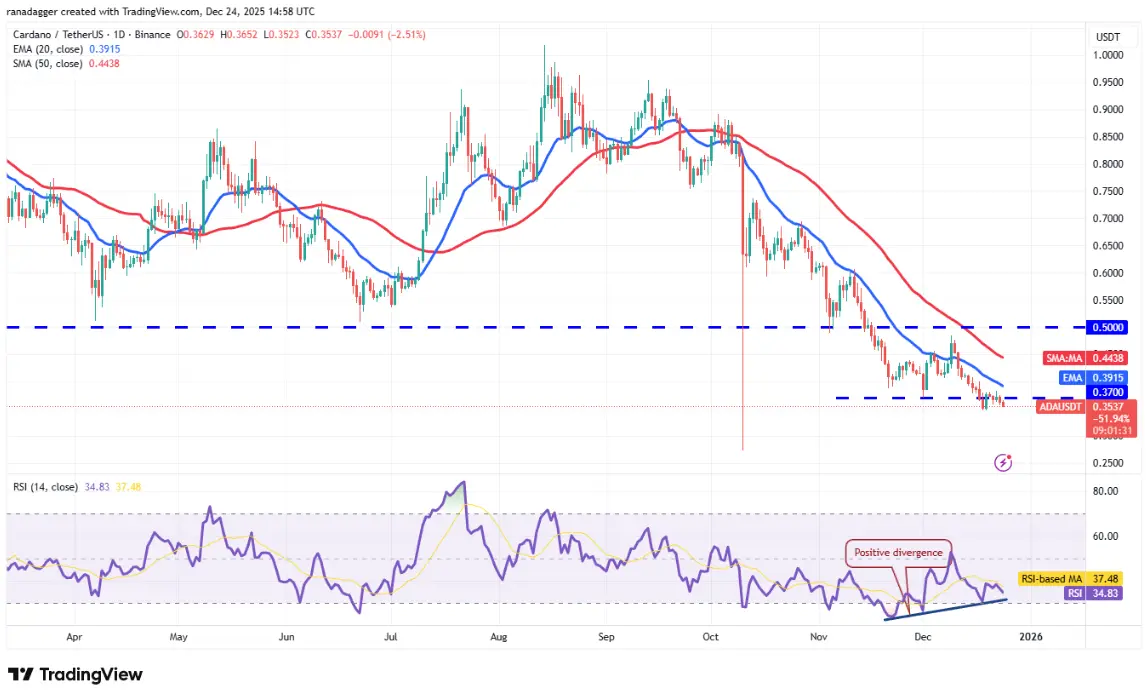 Daily ADA/USDT Chart | Source: TradingView Sellers will attempt to resume the downtrend by pushing ADA below $0.34 USD. If successful, ADA/USDT could plunge to $0.30 USD and then to the October 10th low at $0.27 USD.
Time is running out for the bulls. They need to quickly push the price above the moving averages to signal a recovery. If that happens, the pair could rise to the $0.50 USD zone — a previous breakout level that is likely to act as a major resistance.
Technical Analysis of BCH
Bitcoin Cash (BCH) rebounded from the 20-day EMA at $570 USD on Monday, but bulls could not sustain the recovery.
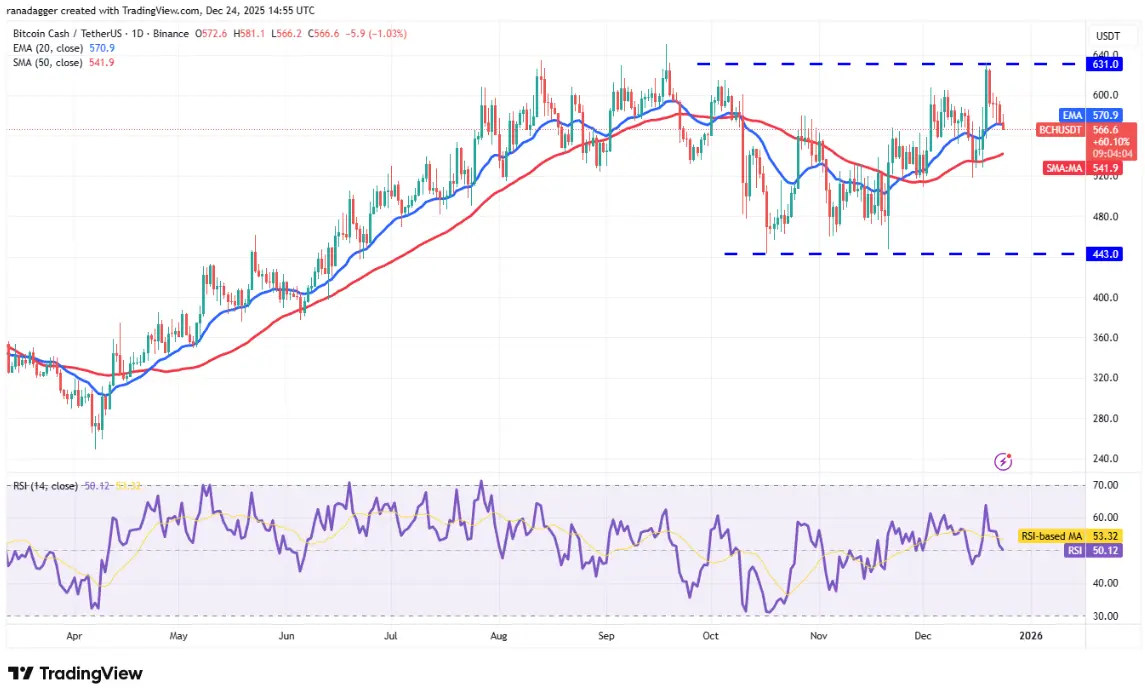 Daily BCH/USDT Chart | Source: TradingView The bears are trying to consolidate their position by pushing BCH below the 20-day EMA. If successful, BCH/USDT could decline to the 50-day SMA at $541 USD.
On the upside, if BCH rises sharply from the moving averages, it indicates bulls are still buying on dips. This scenario could push the price toward the resistance zone at $631–$651 USD.
Technical Analysis of LINK
Chainlink (LINK) reversed from the 20-day EMA at $12.91 USD on Monday, showing bears continue to sell on rebounds.
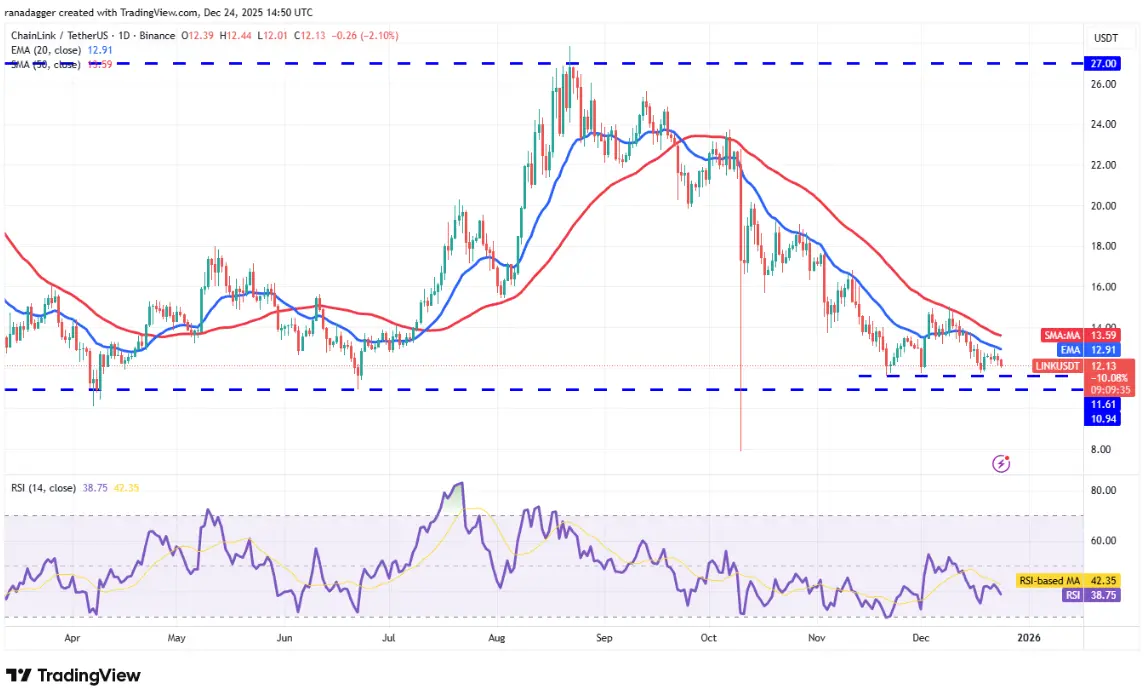 Daily LINK/USDT Chart | Source: TradingView There is a small support zone at $11.61 USD, but if this level is broken, LINK/USDT could test the strong support at $10.94 USD. Buyers are expected to defend the $10.94 USD level aggressively, because a breakdown could send LINK to the October 10th low at $7.90 USD.
To regain the advantage, bulls need to push the pair above the moving averages. If successful, the price could rise to $15.01 USD. A breakout and close above the resistance at $15.01 USD would suggest the downtrend may be over.
Technical Analysis of HYPE
Hyperliquid (HYPE)’s rally has even failed to reach the 20-day EMA at $27.09 USD, indicating weak buying demand from bulls at higher levels.
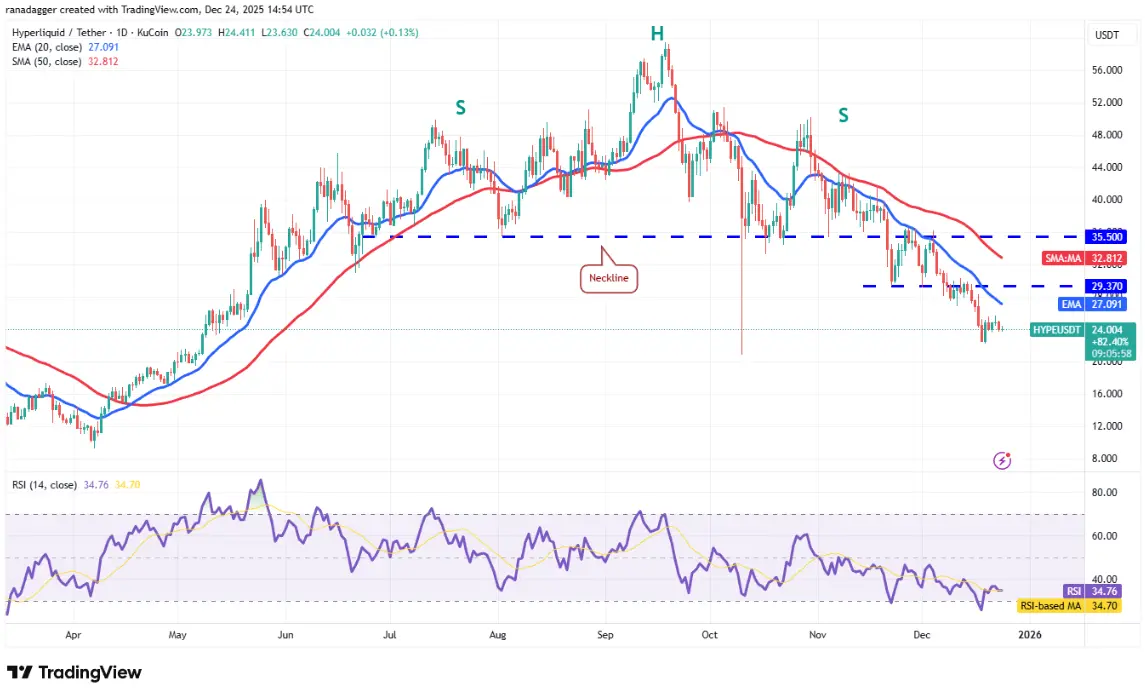 Daily HYPE/USDT Chart | Source: TradingView Bears will attempt to push HYPE below the support zone at $22.19 USD. If successful, HYPE/USDT could retest the October 10th low at $20.82 USD. Buyers are likely to step in at $20.82 USD, because a breakdown could send the pair plunging to $16.90 USD.
Bulls need to push the price above the 20-day EMA to signal strength. If they succeed, the pair could rise to $29.37 USD and then to the previous breakout level at $35.50 USD.
