
Date: Tue, Dec 23, 2025 | 10:20 AM GMT
The broader cryptocurrency market continues to struggle with uneven and choppy price action, a phase that began following the sharp sell-off on October 10. That correction dragged Ethereum (ETH) lower by nearly 20% over the past 60 days, keeping risk appetite subdued across the altcoin space. Pump.fun (PUMP) has not been spared from this weakness, remaining firmly under selling pressure as market sentiment stays cautious.
PUMP is now down more than 57% over the past two months, and while volatility has eased slightly in recent sessions, the daily chart reveals a technical structure that strongly favors further downside rather than an immediate recovery.
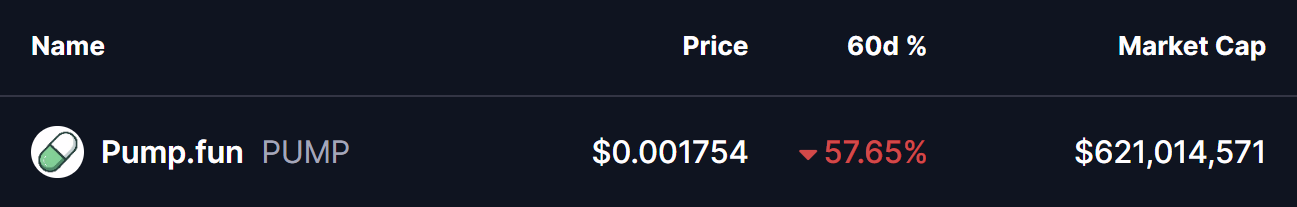
Source: Coinmarketcap
Head and Shoulders Breakdown Confirms Bearish Shift
On the daily timeframe, PUMP formed a textbook head and shoulders pattern — one of the most widely followed bearish reversal formations in technical analysis. The structure began to take shape in late August, with the left shoulder forming near the $0.004 area, followed by a sharp rally that pushed price to a higher peak, creating the head near $0.0095.
The right shoulder developed in early November, topping out around $0.00548 before momentum clearly faded. This failure to reclaim previous highs signaled growing weakness among buyers and set the stage for a breakdown.
As selling pressure increased, PUMP slid toward the neckline support near the $0.0035 zone — a level that had previously acted as a strong demand area. The chart shows that this support ultimately gave way, confirming the head and shoulders breakdown. Once price lost the neckline, downside momentum accelerated, driving PUMP toward the $0.00175 region.
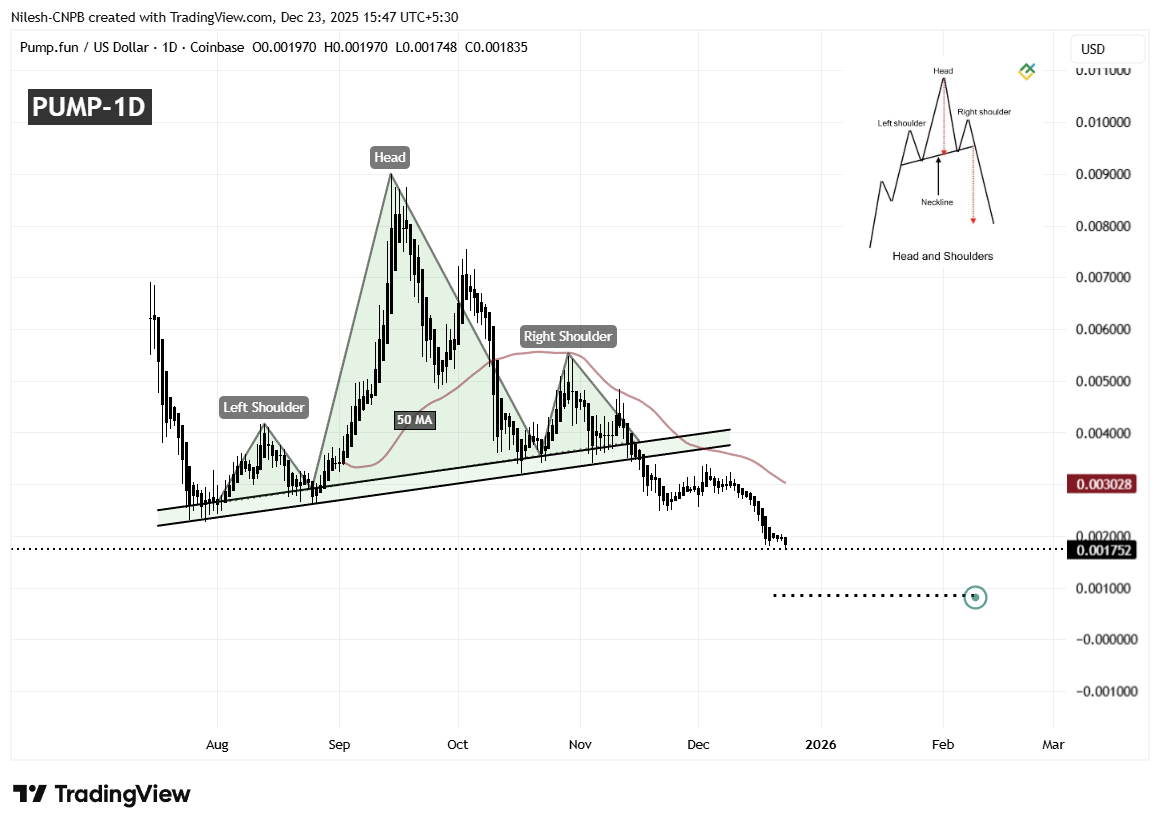
PUMP Daily Chart/Coinsprobe (Source: Tradingview)
This move represents a clear shift in market structure, with sellers firmly in control and bullish momentum largely exhausted.
What’s Next for PUMP?
With the breakdown now confirmed, attention turns to how PUMP behaves around former support levels. The $0.0035 neckline zone has flipped into resistance, and any relief bounce into this area that fails to reclaim it would likely reinforce the bearish outlook.
If downside pressure persists, the measured move from the head and shoulders pattern points toward a potential target near $0.00085. This level aligns with the projected breakdown objective and could act as a temporary pause point if selling accelerates further.
On the upside, a short-term relief rally cannot be ruled out, particularly if broader market conditions stabilize. A reclaim of the 50-day moving average near $0.003028 could trigger a bounce. However, even in that scenario, the overall structure would remain bearish unless PUMP can establish sustained acceptance above this level.
Until then, the trend favors caution, with sellers maintaining the upper hand and downside risks remaining elevated.
**Disclaimer: **The views and analysis presented in this article are for informational purposes only and reflect the author’s perspective, not financial advice. Technical patterns and indicators discussed are subject to market volatility and may or may not yield the anticipated results. Investors are advised to exercise caution, conduct independent research, and make decisions aligned with their individual risk tolerance.
Disclaimer: The information on this page may come from third parties and does not represent the views or opinions of Gate. The content displayed on this page is for reference only and does not constitute any financial, investment, or legal advice. Gate does not guarantee the accuracy or completeness of the information and shall not be liable for any losses arising from the use of this information. Virtual asset investments carry high risks and are subject to significant price volatility. You may lose all of your invested principal. Please fully understand the relevant risks and make prudent decisions based on your own financial situation and risk tolerance. For details, please refer to
Disclaimer.
Related Articles
Here’s Why River (RIVER) Price Is Pumping Today
RIVER's price surged 25% to $27.54, driven by a bullish inverse head-and-shoulders breakout and increased trading volume. Analysts project further gains as traders respond to market conditions and ongoing ecosystem campaigns, indicating strong support for the price.
CaptainAltcoin1h ago
Brandt Spotlights 'Ugly' Bitcoin Pattern - U.Today
Peter Brandt advises Bitcoin traders to remain flexible amidst conflicting technical setups: a potential bullish "horn" pattern and a bearish "flag" pattern. He criticizes the dogmatic mindset of some in the crypto community, emphasizing adaptable trading strategies over fixed opinions.
UToday3h ago
XRP Ledger Hits 7.7M Holders as Price Jumps 14%
XRP Ledger's adoption hit 7.7 million wallets after 13 years, with a surge in active addresses to 46,767 as its price rose 14%. The cryptocurrency now faces resistance at $1.55–$1.70, indicating a cautious upward trend.
CryptoFrontNews3h ago
AHR999 Index Falls Below 0.45 for First Time in 837 Days
Gate News bot message, The AHR999 Index has dropped below 0.45, marking the first occurrence in 837 days. This level was last observed in February 2026. Prior to that, the index reached this zone in October 2023, preceding the price movement from $28K to $72K. The source notes this is not a buy sign
GateNews4h ago
XRP Supply Shift: Whales Add 200 Million Tokens as Price Eyes $1.50 - U.Today
XRP has seen a significant increase in whale activity, with 200 million XRP bought recently, while network activity and wallet numbers reach new highs. A "golden cross" signals potential price rises, as the SEC clarifies crypto asset regulations.
UToday7h ago
