
Date: Mon, Dec 22, 2025 | 06:56 AM GMT
The broader altcoin market has experienced choppy and largely directionless price action over the past several weeks, a phase that began after the sharp sell-off on October 10. That correction dragged Ethereum (ETH) down from the sub-$4,700 region to the $3,000 area, leaving traders cautious and overall risk appetite muted. Over the last 60 days alone, ETH has declined by nearly 21%, reinforcing a short-term bearish narrative across the altcoin space.
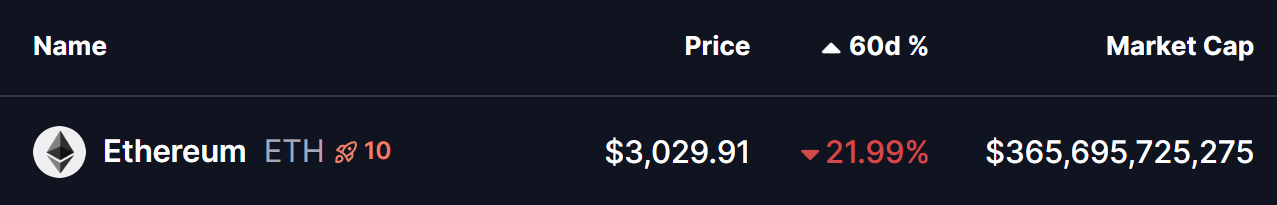
Source: Coinmarketcap
However, beneath the surface, the higher-timeframe technical structure is starting to hint at something far more constructive. Long-term signals on the ETH/BTC chart are now aligning in a way that has historically preceded major altcoin expansions, raising the possibility that the current weakness could be laying the groundwork for a bullish reversal into 2026.
ETH/BTC Chart Hints at a Bullish Altcoin Expansion
According to the latest analysis shared by @el_crypto_prof, the ETH/BTC weekly chart has once again recreated a structure that closely mirrors previous cycle transitions. This setup focuses on the interaction between the SMA100 and EMA100, two moving averages that have historically defined the beginning and end of major altcoin cycles.
In past market cycles, altcoin bull markets have tended to begin when the SMA100 crosses below the EMA100 — a bearish crossover that, counterintuitively, has marked long-term bottoms rather than tops. These moments often coincided with peak pessimism, underperformance of ETH versus BTC, and broad disinterest in altcoins.
Conversely, altcoin bull markets have historically ended when the SMA100 crosses back above the EMA100, signaling overheating conditions and the return of Bitcoin dominance.
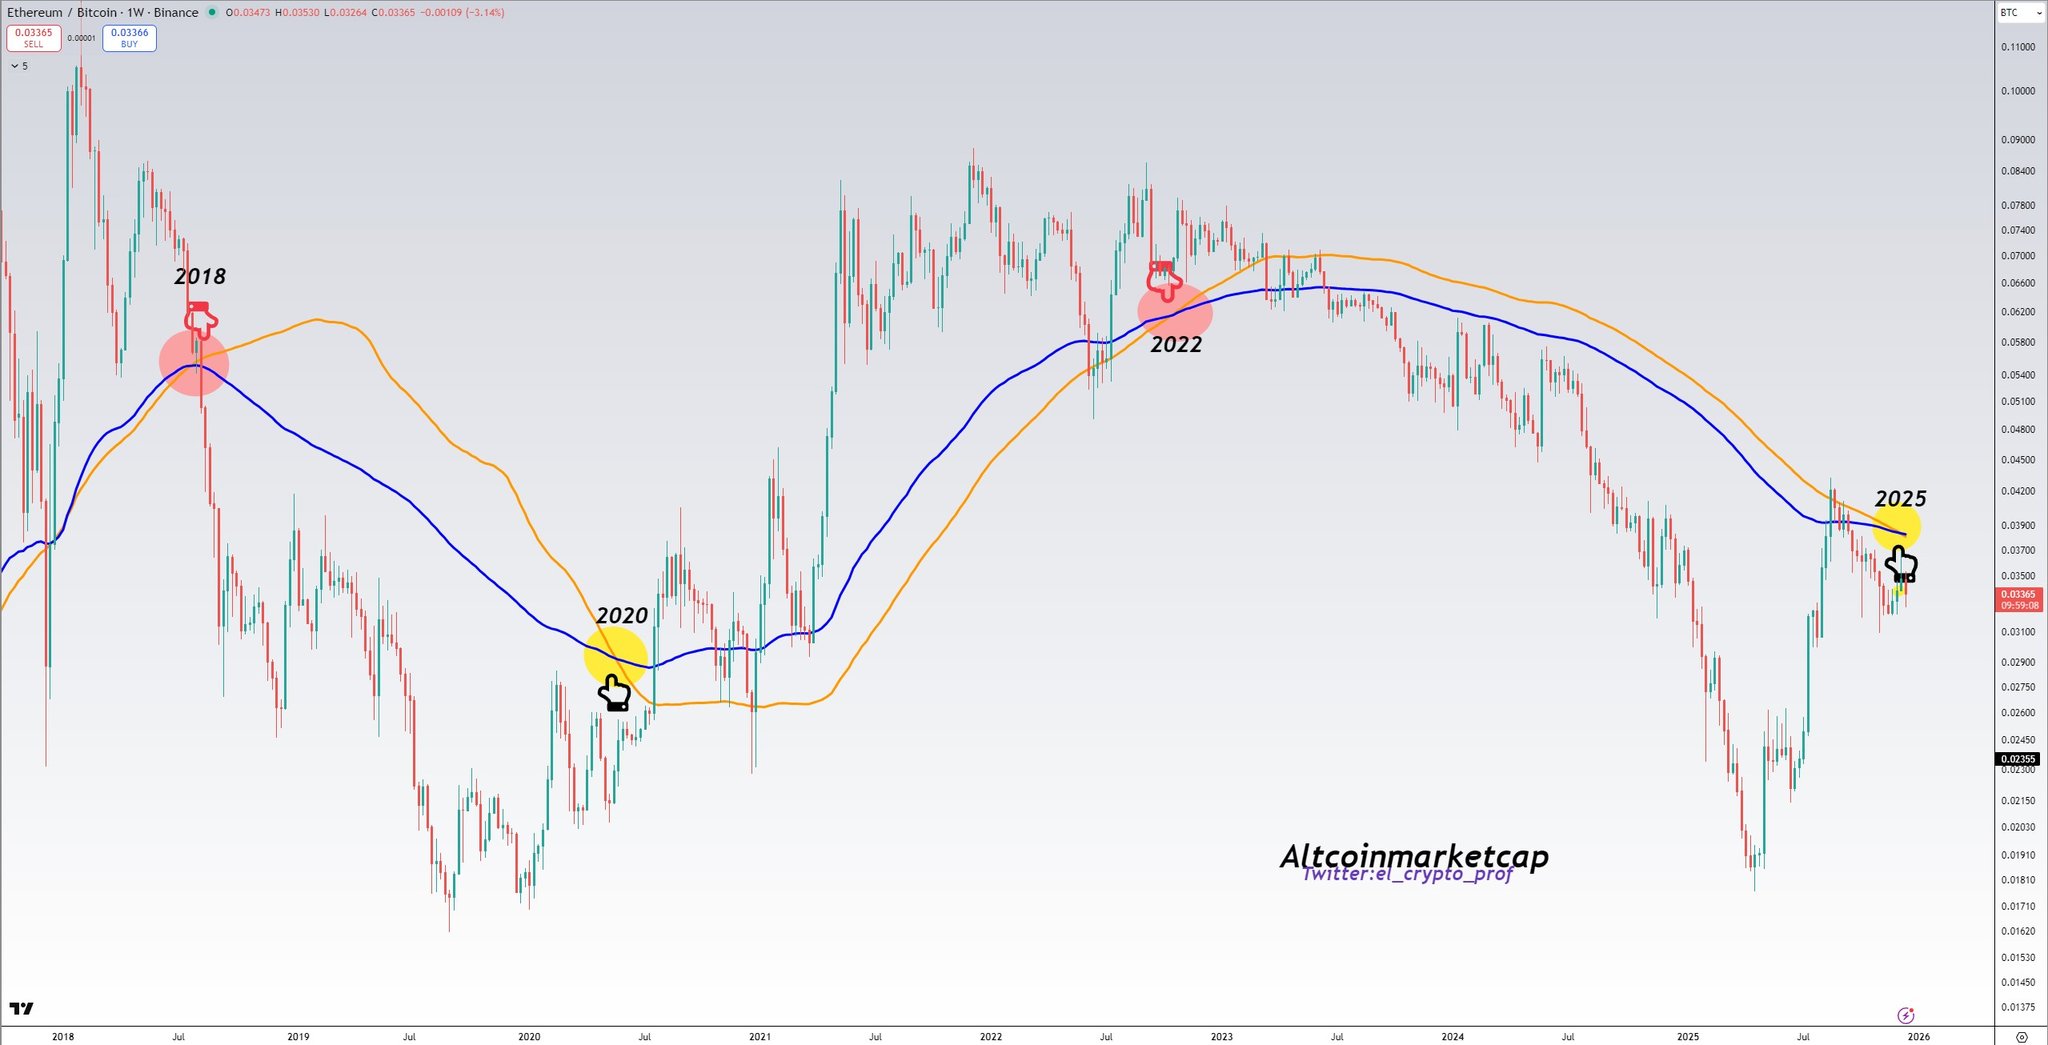
ETH-BTC Pair Chart/Credits: @el_crypto_prof (X)
The chart highlights three key moments:
In 2018, the bullish crossover marked the end of the altcoin cycle and preceded prolonged underperformance.
In 2020, the bearish crossover aligned closely with the start of a powerful altcoin expansion that carried into 2021.
In 2022, the bullish crossover once again signaled exhaustion and the onset of another prolonged correction.
Now, in 2025, the ETH/BTC pair has once again printed a bearish SMA100–EMA100 crossover, placing the market at a familiar inflection point. Historically, this has been the zone where altcoins quietly transition from distribution to accumulation.
What’s Next for Altcoins?
If this long-term setup continues to play out as it has in previous cycles, the coming months could mark the early stages of a broader altcoin recovery rather than the continuation of a downtrend. While short-term volatility and further downside cannot be ruled out, the structural signal suggests that downside risk may be gradually diminishing.
For altcoins, this phase has typically been characterized by range-bound price action, selective accumulation, and patience — followed by a sharp expansion once momentum returns and capital begins rotating out of Bitcoin.
Importantly, this is not a timing signal for immediate upside. Long-term moving average crossovers operate on a macro scale and often precede major rallies by months. But they do provide context: historically, these moments have offered some of the best risk-reward conditions for long-term altcoin exposure.
As 2026 approaches, the ETH/BTC chart suggests the altcoin market may be closer to a structural reset than many currently expect. If history repeats, today’s consolidation could ultimately be remembered as the calm before the next major altcoin cycle.
Disclaimer: The views and analysis presented in this article are for informational purposes only and reflect the author’s perspective, not financial advice. Technical patterns and indicators discussed are subject to market volatility and may or may not yield the anticipated results. Investors are advised to exercise caution, conduct independent research, and make decisions aligned with their individual risk tolerance.
Disclaimer: The information on this page may come from third parties and does not represent the views or opinions of Gate. The content displayed on this page is for reference only and does not constitute any financial, investment, or legal advice. Gate does not guarantee the accuracy or completeness of the information and shall not be liable for any losses arising from the use of this information. Virtual asset investments carry high risks and are subject to significant price volatility. You may lose all of your invested principal. Please fully understand the relevant risks and make prudent decisions based on your own financial situation and risk tolerance. For details, please refer to
Disclaimer.
Related Articles
APEPE Reclaims $0.051207 As Whale Buying Activity Sets a 500% Major Market Rally: Analyst
The Ape and Pepe (APEPE) coin shows signs that its market is approaching a potential big bounce. By reclaiming the $0.009000 level for the first time in almost a month and pushing past a multi-week consolidation range, the digital asset is displaying indicators of renewed bullish momentum,
BlockChainReporter16m ago
Bitcoin Veteran Buys $49 Million Worth of ETH as Experts Believe ETH Nears Breakout Price Levels
Bitcoin veteran buys $49 million worth of ETH.
Experts believe ETH is nearing major breakout prices.
ETH price could surge to $2,800 if it can hit $2,400.
The crypto community basks in high spirits as the price of Bitcoin (BTC) recovers targets over the $73,000 price range. At the
CryptoNewsLand44m ago
Ethereum Open Interest Jumps 18%, Bull Trap Signal? - U.Today
Ethereum's futures market saw a significant increase, with open interest rising over 18% to $33.37 billion, indicating heightened risk-taking. Despite bullish trends, traders appear cautious, hedging against potential downturns.
UToday49m ago
"Seeking a Sword by Marking a Boat" - Style Coin Price Predictions Go Viral: The Practical Logic and Flaws of Mystical Prophecies
Author: Frank, PANews
Whenever the market enters a confusing phase of going nowhere, people try to use a "cutting the boat to seek the sword" method of historical retrospection to predict the next market movement. In such cases, people often see from these theories and charts that history always repeats itself, and seem to automatically overlay and verify future price movements with a certain period in the past.
This coincidence seems to have a magical effect and is often verified. Some bloggers claim this prediction method has an accuracy rate of 75%~80%.
Does this "cutting the boat to seek the sword" style price prediction that repeatedly goes viral on social media help the market identify stages, or is it just packaging noise as prophecy?
From "Tick Fractals" to "History Rhyming"
The peak operation regarding predictions of October 2025 market tops is an analyst named CryptoBullet, who created a method called "ti
区块客1h ago
DeFi enters a "winter of yields": liquidity stagnation, leverage contraction, and the disappearance of arbitrage opportunities
The DeFi market entered an "interest rate winter" since September 2025, with deposit rates for major stablecoins declining sharply and supply-demand imbalances causing liquidity congestion. The rate decline reflects reduced capital demand and a lack of high-return opportunities. Stablecoin lending demand has dropped significantly, with market risk appetite shifting toward more stable investment channels. In response to this situation, the Sky protocol demonstrates competitiveness and adaptability by introducing real-world assets to enhance yields. The low interest rates during this phase can be viewed as an opportunity for DeFi market transformation.
区块客1h ago
