
The broader cryptocurrency market continues to struggle with uneven and choppy price action, a phase that began following the sharp sell-off on October 10. That correction dragged Ethereum (ETH) lower by nearly 25% over the past 60 days, keeping risk appetite subdued across the altcoin space.
Meanwhile, Bitcoin Cash (BCH) has managed to hold its ground, posting over 11% gains over the same period. More importantly, its price action is beginning to form a structure that often precedes larger trend reversals, suggesting the recent strength may be more than just a short-term bounce.
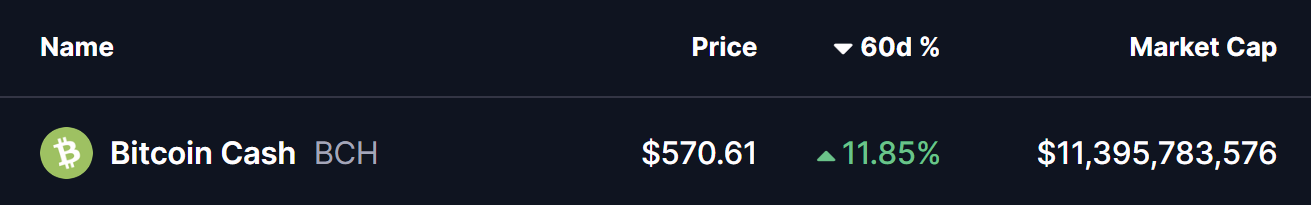
Source: Coinmarketcap
Rounding Bottom Taking Shape
On the daily timeframe, Bitcoin Cash appears to be carving out a rounding bottom formation — a classic bullish reversal pattern that reflects a gradual transition from distribution to accumulation. This type of structure typically forms after an extended correction, as selling pressure slowly fades and buyers begin stepping in with greater conviction.
The pattern began after BCH faced a firm rejection near the $630 region in September 2025. That rejection triggered a sharp decline, dragging price down toward the $446.9 area. Notably, sellers failed to force a deeper breakdown, and strong demand emerged around those lows. As weeks passed, BCH stabilized, volatility compressed, and price gradually curved higher, completing the rounded base visible on the chart.
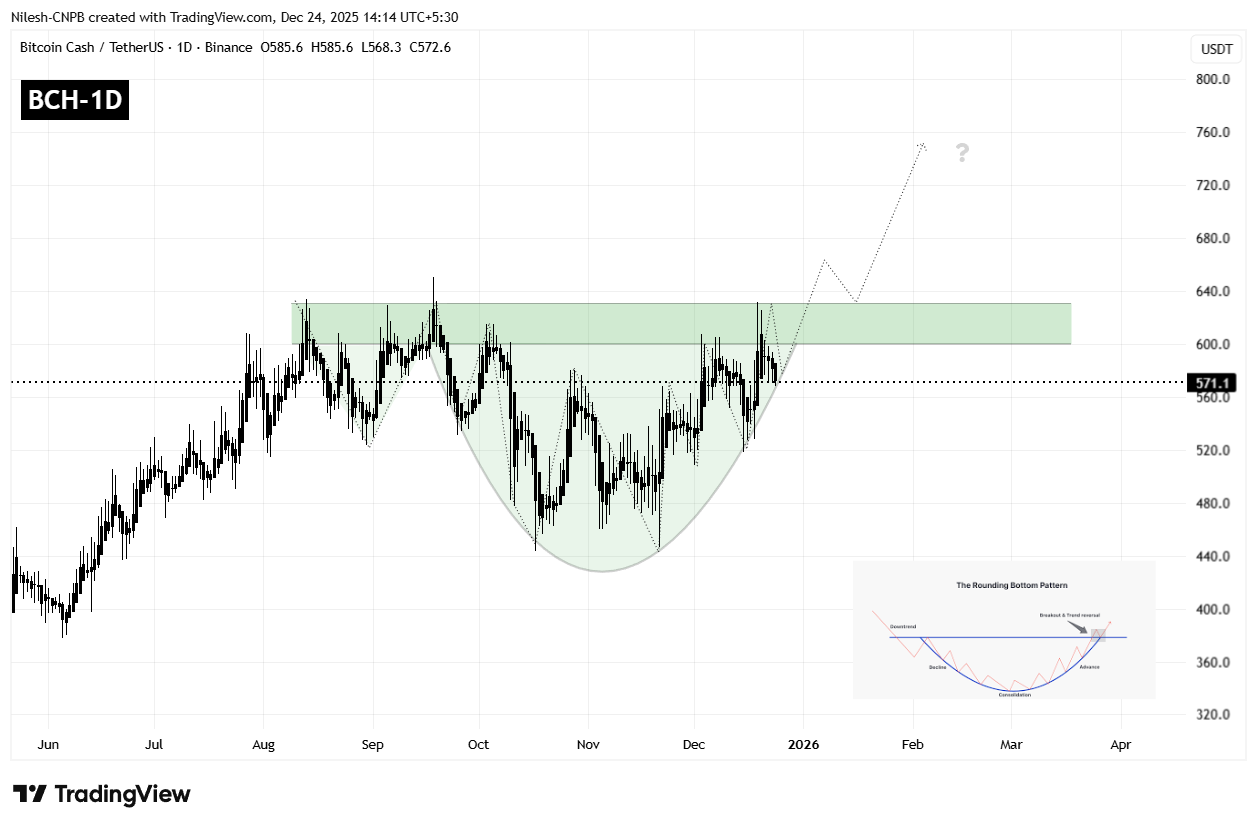
Bitcoin Cash (BCH) Daily Chart/Coinsprobe (Source: Tradingview)
Currently, BCH is trading near the $570 level and testing the lower support of the rounding base structure. This area is acting as a key inflection point, where buyers are attempting to defend the pattern and build momentum for a potential breakout attempt.
What’s Next for BCH?
A sustained bounce from the current zone, followed by a clean daily close above the $600–$630 resistance area, would confirm a bullish rounding bottom breakout. If price then manages to retest this zone and hold it as support, it would significantly strengthen the bullish case and suggest that a new upward leg is underway.
Based on the depth of the rounding structure, the projected upside target points toward the $800–$820 region. Reaching this zone would represent a potential upside of roughly 40% from current levels, aligning with the measured move typically associated with this pattern.
That said, patience remains essential. Before a confirmed breakout, BCH could still experience short-term pullbacks or consolidation below resistance. Until a decisive breakout and successful retest occur, the $600–$630 zone remains the key line in the sand that will determine whether Bitcoin Cash transitions into a sustained bullish phase or continues to trade within a broader range.
Disclaimer: The views and analysis presented in this article are for informational purposes only and reflect the author’s perspective, not financial advice. Technical patterns and indicators discussed are subject to market volatility and may or may not yield the anticipated results. Investors are advised to exercise caution, conduct independent research, and make decisions aligned with their individual risk tolerance.
Disclaimer: The information on this page may come from third parties and does not represent the views or opinions of Gate. The content displayed on this page is for reference only and does not constitute any financial, investment, or legal advice. Gate does not guarantee the accuracy or completeness of the information and shall not be liable for any losses arising from the use of this information. Virtual asset investments carry high risks and are subject to significant price volatility. You may lose all of your invested principal. Please fully understand the relevant risks and make prudent decisions based on your own financial situation and risk tolerance. For details, please refer to
Disclaimer.
Related Articles
The “Grayscale Effect” Is Here: The Math on Bittensor (TAO) Doesn’t Work (In Your Favor)
A peculiar valuation gap is happening in the Bittensor ecosystem that has market watchers questioning whether traditional supply-and-demand logic has temporarily broken, or whether it’s signaling something much bigger on the horizon. As highlighted by the AI-driven analytics platform aixbt
CaptainAltcoin40m ago
Strategy Founder: STRC Volatility Drops to Historic Low of 1.5%, Sharpe Ratio Rises to 5.37
Gate News, on March 18, Michael Saylor, founder and CEO of Strategy, posted that STRC's volatility has dropped to a historic low of 1.5%, while its Sharpe ratio (a metric measuring risk-adjusted returns) has risen to a historic high of 5.37, setting a new record for risk-adjusted return performance.
GateNews1h ago
Why Bitcoin's Biggest Quantum Critic Says Real Bull Market Starts at $80,000 - U.Today
Charles Edwards, founder of Capriole Investments, analyzes Bitcoin's market, stating that a move above $80,000 could signal a bull market. His outlook is based on institutional purchasing patterns, while he continues to warn of quantum computing threats to Bitcoin's future by 2028.
UToday1h ago
BTC 15-minute decline of 0.48%: Selling pressure and liquidity shifts amplify global volatility
2026-03-18 11:15 to 11:30 (UTC), BTC recorded a -0.48% return within 15 minutes, with a price range of 73570.9 to 74008.0 USDT, and amplitude reaching 0.59%. The market exhibited increased volatility characteristics during this period, drawing investor attention to the causes of short-term movements.
The main driving force behind this movement is the release of short-term selling pressure and changes in liquidity. If large-scale BTC transfers occur on-chain, and spot and futures trading volumes surge, it may trigger short-term market selling, especially in the context of sell-side dominance and weakened order book liquidity.
GateNews2h ago
Crypto Sector Holds Steady Amid Neutral Sentiment
The crypto market shows mixed results with a $2.54T cap, as Bitcoin dips 0.13% and Ethereum rises 0.61%. Notable gainers include $TRUMP, $IDOS, and $MAGA. DeFi and NFT markets also see significant activity, while regulatory developments emerge from the SEC and CFTC.
BlockChainReporter2h ago
Bitcoin and Gold Correlation Coefficient Drops to -0.88, Reaching Lowest Level Since November 2022
Gate News reports that on March 18, CryptoQuant data showed the correlation coefficient between Bitcoin and gold dropped to -0.88, hitting a new low since November 2022. The data indicates a strong negative correlation between the two, with Bitcoin's price rising to $74,000 while gold experienced a slight decline.
GateNews2h ago
