
The broader cryptocurrency market continues to struggle with uneven and choppy price action, a phase that began after the sharp sell-off on October 10. That correction dragged Ethereum (ETH) lower by nearly 25% over the past 60 days, keeping risk appetite muted across the altcoin space. Solana (SOL) has not been immune to this pressure, remaining under sustained selling as market participants stay cautious.
SOL is now down more than 37% over the same period. However, a closer look at the weekly chart suggests that the ongoing weakness may be part of a larger corrective structure rather than the start of a prolonged downtrend. Beneath the surface, the price action is beginning to form a technical setup that could lay the groundwork for a potential bullish reversal if key levels continue to hold.
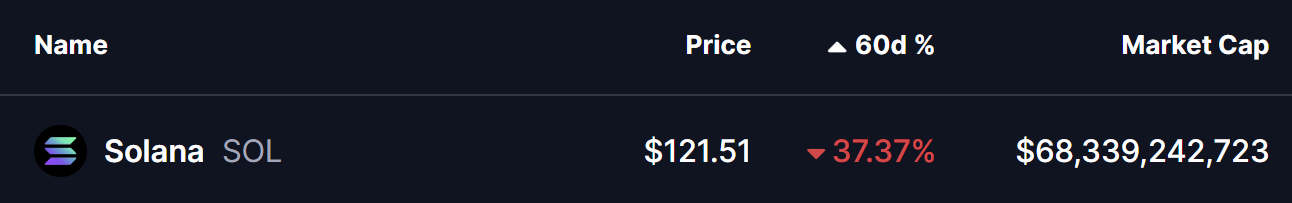
Source: Coinmarketcap
Bearish Butterfly Pattern Taking Shape
On the weekly timeframe, Solana appears to be developing a Bearish Gartley Butterfly pattern. Despite its name, this harmonic structure often signals exhaustion of the downtrend and sets the stage for an upside reversal once the pattern completes its final leg.
The structure began at Point X near the $295 region, followed by a sharp decline toward Point A. From there, SOL staged a rebound into Point B before rolling over once again. The current decline has pushed price into the $113–$122 zone, an area that aligns with the projected completion region of Point C within the pattern.
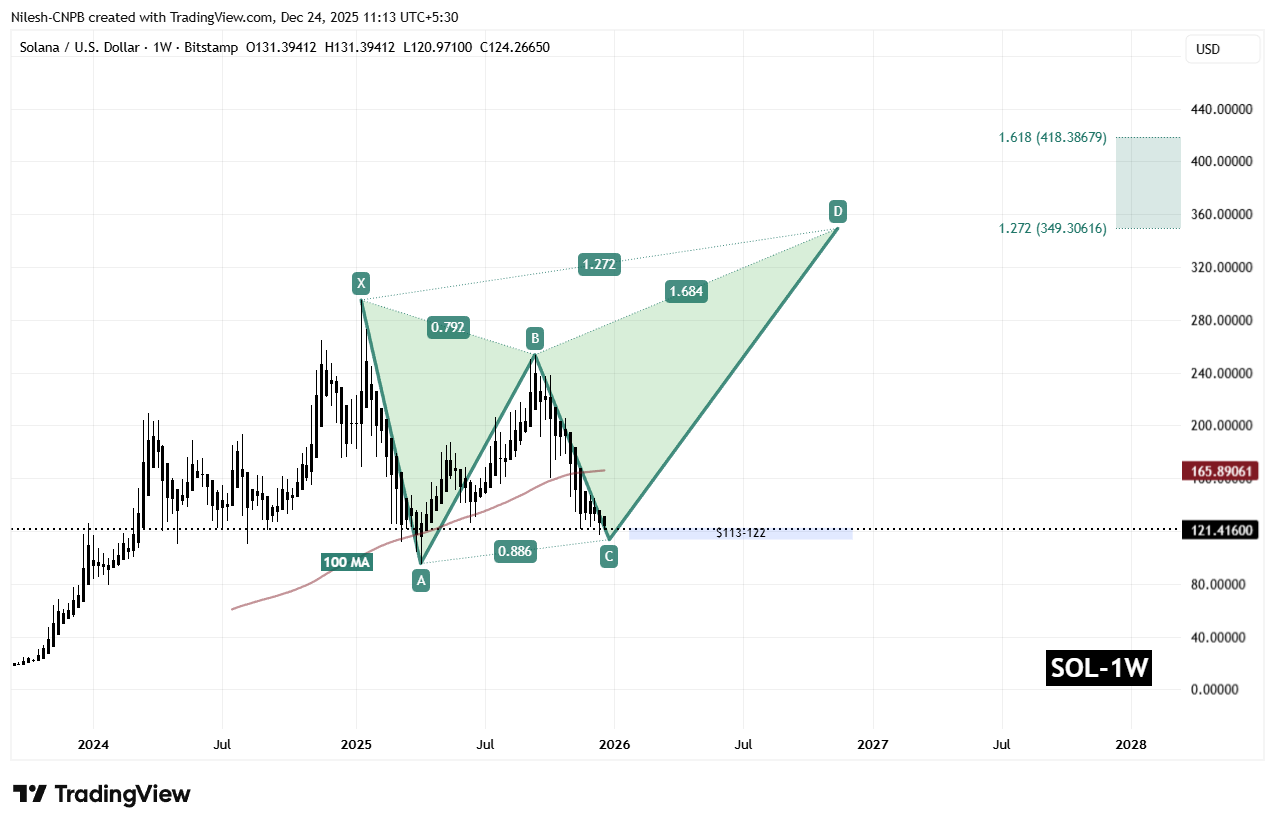
Solana (SOL) Weekly Chart/Coinsprobe (Source: Tradingview)
This zone is technically significant, as it represents a confluence of harmonic projections and historical demand. If buyers are able to defend this range, it would increase the probability that Point C is forming, opening the door for the bullish CD leg — the phase that typically drives recovery rallies in harmonic setups.
What’s Next for SOL?
If the $113–$122 support zone holds firm, Solana could begin to stabilize and attempt a reversal toward the 100-period moving average on the weekly chart, currently sitting near $165.89. A successful reclaim of this level would act as early confirmation that bullish momentum is returning.
Beyond that, the harmonic projection points to more ambitious upside targets. A sustained recovery could eventually drive SOL toward the $349.30 to $418.38 region, which aligns with the 1.272 and 1.618 Fibonacci extension levels of the pattern. From current prices, such a move would represent a potential upside of over 240%, assuming broader market conditions turn supportive.
That said, the setup remains conditional. A failure to hold the $113–$122 zone would weaken the bullish thesis, allowing sellers to regain control and potentially push SOL toward new local lows before any meaningful recovery attempt. For now, patience remains critical, and buyers may want to wait for clear confirmation before positioning for a reversal.
**Disclaimer: **The views and analysis presented in this article are for informational purposes only and reflect the author’s perspective, not financial advice. Technical patterns and indicators discussed are subject to market volatility and may or may not yield the anticipated results. Investors are advised to exercise caution, conduct independent research, and make decisions aligned with their individual risk tolerance.
Disclaimer: The information on this page may come from third parties and does not represent the views or opinions of Gate. The content displayed on this page is for reference only and does not constitute any financial, investment, or legal advice. Gate does not guarantee the accuracy or completeness of the information and shall not be liable for any losses arising from the use of this information. Virtual asset investments carry high risks and are subject to significant price volatility. You may lose all of your invested principal. Please fully understand the relevant risks and make prudent decisions based on your own financial situation and risk tolerance. For details, please refer to
Disclaimer.
Related Articles
Solana DApps Revenue Drops to 18-Month Low as SOL Price Risks Retesting $80 Level
Solana's native SOL token has declined 11% in just three days after touching a peak of $97.70. The correction momentum to $87 on Thursday triggered approximately $25 million in long position liquidations, thereby significantly dampening trader sentiment. Derivatives market data shows downside risk remains dominant
TapChiBitcoin3h ago
SOL breaks through 90 USDT, 24-hour gain of 0.66%
Gate News reports that on March 20, a certain CEX showed SOL surpassing 90 USDT, currently trading at 90.03 USDT, with a 24-hour increase of 0.66%.
GateNews7h ago
Solana DApps Fall to 18-Month Low, SOL Faces Risk of Retesting 80 Dollar Level
Solana ecosystem DApps revenue has dropped to $22 million, marking an 18-month low, while the derivatives market is also showing bearish signals with funding rates near 0% and option skew surging, reflecting institutional lack of confidence in the future. The rise of competitor Hyperliquid has further intensified the pressure, leading to erosion of Solana's market share in the derivatives sector.
MarketWhisper10h ago
Solana DApp Revenue Drops to $22 Million, SOL Price Falls 11% in Three Days to $87
Solana ecosystem decentralized application revenue has dropped to an 18-month low, with SOL price recently declining 11% to $87, while long positions have been liquidated. Despite strong performance in DEX trading volume, it faces intense competition in the perpetual futures market.
GateNews12h ago
