Date: Fri, Dec 26, 2025 | 10:28 AM GMT
The broader cryptocurrency market is showing modest strength, with both Bitcoin (BTC) and Ethereum (ETH) trading in the green. This steady performance from the majors has helped stabilize overall market sentiment, allowing several altcoins to begin forming constructive technical structures including Virtuals Protocol (VIRTUAL).
VIRTUAL is currently trading slightly higher on the day, but the real story lies beneath the surface. The daily chart structure is beginning to hint at a potential shift in momentum, suggesting that sellers may be losing control as buyers quietly step back in.
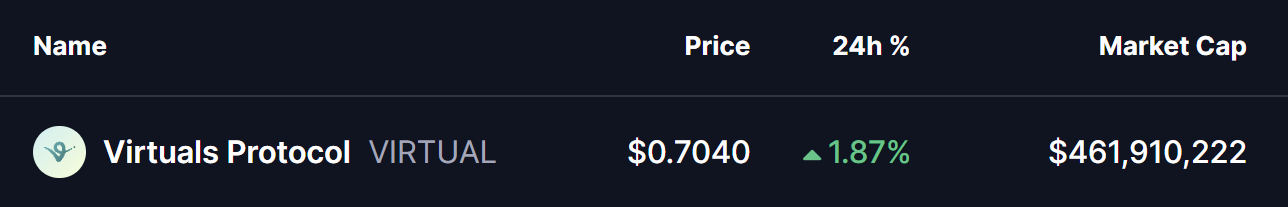
Source: Coinmarketcap
Falling Wedge Pattern Signals a Possible Reversal
On the daily timeframe, VIRTUAL is trading within a clearly defined falling wedge pattern. This structure is widely recognized as a bullish reversal formation, typically developing when selling pressure gradually weakens while price continues to make lower highs and lower lows within converging trendlines.
After several weeks of persistent downside, VIRTUAL found support around the $0.6518 level. This bounce marked an important reaction low and helped price recover toward the $0.7040 area. As seen on the chart, price is now pressing close to the wedge’s upper boundary, indicating that buyers are starting to challenge the prevailing downtrend.
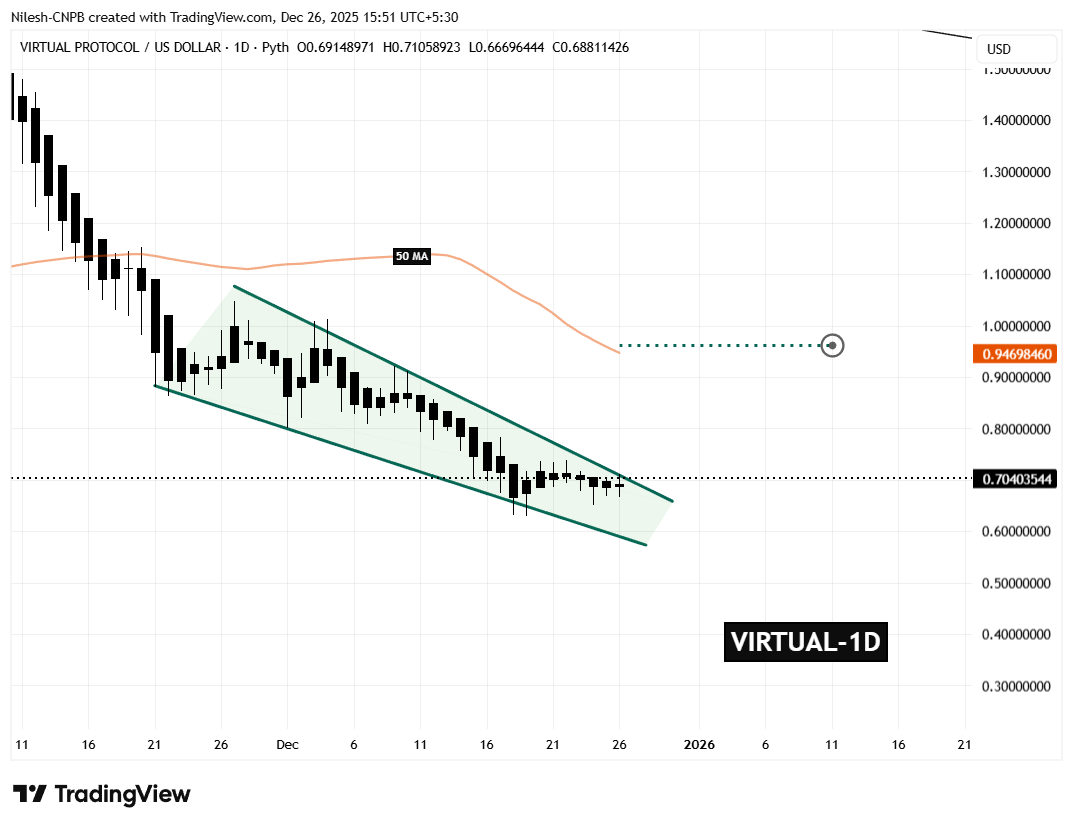
VIRTUAL Daily Chart/Coinsprobe (Source: Tradingview)
The compression within the wedge suggests that a decisive move may be approaching, with volatility likely to expand once price breaks out of the structure.
What’s Next for VIRTUAL?
A confirmed breakout above the falling wedge resistance, followed by a successful retest, would significantly improve the bullish outlook for VIRTUAL. In such a scenario, the first major area of interest lies near the 50-day moving average, currently positioned around $0.9469. This level also aligns closely with prior price congestion, increasing its technical importance.
Beyond that, the projected measured move from the wedge points toward a potential upside target near $0.962. Reaching this zone would represent a gain of more than 37% from current price levels, making it a notable recovery move if momentum accelerates.
On the flip side, failure to break above the wedge resistance could keep VIRTUAL range-bound. In that case, price may revisit the lower boundary of the wedge, where buyers would need to defend support to prevent a deeper retracement.
Disclaimer: The views and analysis presented in this article are for informational purposes only and reflect the author’s perspective, not financial advice. Technical patterns and indicators discussed are subject to market volatility and may or may not yield the anticipated results. Investors are advised to exercise caution, conduct independent research, and make decisions aligned with their individual risk tolerance.
Disclaimer: The information on this page may come from third parties and does not represent the views or opinions of Gate. The content displayed on this page is for reference only and does not constitute any financial, investment, or legal advice. Gate does not guarantee the accuracy or completeness of the information and shall not be liable for any losses arising from the use of this information. Virtual asset investments carry high risks and are subject to significant price volatility. You may lose all of your invested principal. Please fully understand the relevant risks and make prudent decisions based on your own financial situation and risk tolerance. For details, please refer to
Disclaimer.
Related Articles
HYPE Hits $35.53 After 2.4% Jump — Will Momentum Hold as Price Tests $35.59 Resistance?
Hyperliquid’s HYPE trades at $35.53, approaching the $35.59 resistance after a 2.4% daily gain.
The chart shows the $33.67 zone acting as support after price moved above a previously contested level.
Price now trades between $33.67 support and $35.59 resistance, shaping the immediate
CryptoNewsLand31m ago
Is Injective (INJ) a Dead Coin or the Next 2800% Opportunity? Here’s What The Chart Is Saying
The Injective price has fallen sharply from its previous all-time high, leading some traders to question whether the project has lost its momentum.
However, a recent technical analysis shared by top analyst Crypto Patel suggests that the recent decline may actually represent a typical
CaptainAltcoin1h ago
CFX 4-hour chart reaches a new high for the phase, with approximately 14% increase over 24 hours
Gate News: On March 15, market data shows that CFX reached a new phase high on the 4-hour K-line chart, with prices touching approximately 0.06282 USDT at their peak, representing a 24-hour gain of around 14%. Some community members believe this rally may be related to recent macroeconomic catalysts. Earlier, media outlets citing sources reported that Iran is considering allowing certain tankers to pass through the Strait of Hormuz on the condition that petroleum transport be settled in Chinese yuan. Related discussions have once again sparked market attention toward yuan stablecoins and cross-border payment narratives.
GateNews2h ago
After the network upgrade: What prospects await SOL?
The official approval of protocol SIMD-0266 aims to optimize computing efficiency on the Solana network by introducing p-tokens, simplifying transaction processing. This upgrade, set for April, has prompted increased buying activity and could lead to significant cost reductions and performance improvements.
TapChiBitcoin3h ago
Track FET's journey to the $0.24 milestone as the AI cryptocurrency sector records its most positive trading week in months
The cryptocurrency industry related to AI has recently recorded an impressive performance. According to data from CoinMarketCap, the total market capitalization of this sector has grown 16% in just the past week. Many leading tokens in this category have also achieved significant growth, attracting
TapChiBitcoin4h ago
DeFi enters a "winter of yields": liquidity stagnation, leverage contraction, and the disappearance of arbitrage opportunities
Since September 2025, the DeFi market has entered a "interest rate winter," with the annualized deposit yields of mainstream stablecoins dropping to lows, and supply and demand imbalances causing excess liquidity. As borrowing demand declines, stablecoin lending rates have also decreased, and the reduced risk appetite in the crypto market has led investors to shift toward more stable assets. Some protocols, such as Sky, offer stable returns through real-world assets, but the overall trend still indicates a period of adjustment and structural reform in DeFi.
区块客4h ago