 The Zcash (ZEC) price has had a wild few months. After topping out in the $700–$750 zone, ZEC sold off hard and lost roughly half its value, sliding all the way down to the $300 area. That drop marked the end of a fast and emotional rally, but it also set up the move that followed.
From that $300 low, ZEC bounced sharply. Price pushed back toward $500 and briefly traded in the $500–$550 range, delivering an 80%+ rebound for anyone who caught the move early. On the surface, that looks strong. But when you zoom out, the chart tells a more cautious story.
The Zcash (ZEC) price has had a wild few months. After topping out in the $700–$750 zone, ZEC sold off hard and lost roughly half its value, sliding all the way down to the $300 area. That drop marked the end of a fast and emotional rally, but it also set up the move that followed.
From that $300 low, ZEC bounced sharply. Price pushed back toward $500 and briefly traded in the $500–$550 range, delivering an 80%+ rebound for anyone who caught the move early. On the surface, that looks strong. But when you zoom out, the chart tells a more cautious story.
- What the ZEC Chart Is Showing
- Why the $300 Bounce Doesn’t Mean Safety For ZEC Price
- Key Levels Traders Are Watching For Zcash
What the ZEC Chart Is Showing
The recent bounce fits cleanly inside a larger corrective structure. The ZEC price rallied straight into a heavy resistance zone between $550 and $600, an area that has already rejected price multiple times.
This zone lines up with prior distribution and failed breakouts, which makes it a natural place for sellers to step back in.
The chart also shows that the move from $300 to $550 happened quickly, with little consolidation along the way. Rallies like that often attract late buyers near the top, especially after a big percentage gain. That’s where risk increases fast.
Above this zone, the next key level is around $720. A strong higher-timeframe close above that level would invalidate the bearish setup. Until that happens, price remains capped below major resistance.
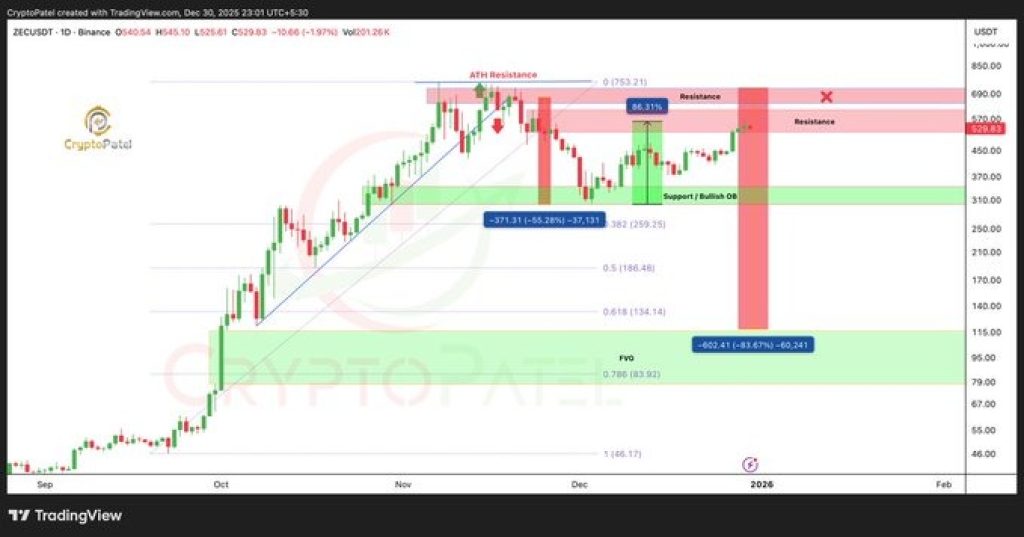
Source: X/CryptoPatel
Why the $300 Bounce Doesn’t Mean Safety For ZEC Price
It’s important to separate a bounce from a trend change. ZEC bouncing off $300 doesn’t automatically mean the worst is over. In fact, sharp rebounds are common in downtrends, especially after large drops.
The chart structure shows there is still room for price to move lower later on. If the Zcash price fails to hold above the mid-range and loses momentum near resistance, a deeper move becomes more likely.
The next major downside area sits below $200, where long-term support and prior accumulation zones start to appear.
That doesn’t mean price collapses immediately. It means the risk-to-reward for new longs above $500 is poor compared to earlier entries near $300.
_Read Also: _****Solana’s Validator Collapse Exposes a Harsh Truth About SOL’s Economics
Key Levels Traders Are Watching For Zcash
Right now, the market is focused on a few clear levels. The $550–$600 area acts as a decision zone. Holding below it keeps pressure on the downside. A clean break and hold above $720 would change the picture and force bears to step aside.
On the downside, $300 remains the first major support. If that level fails on a future retest, the chart opens up toward the sub-$200 region, where the next meaningful base could form.
Moreover, the ZEC price has already delivered the easy part of the move. The bounce from $300 to $550 rewarded patience and discipline. From here, the trade gets harder.
Chasing longs at these levels carries high risk, while the chart still allows for a much deeper pullback later. Until ZEC proves it can reclaim and hold above major resistance, the warning signs remain firmly in place.
Disclaimer: The information on this page may come from third parties and does not represent the views or opinions of Gate. The content displayed on this page is for reference only and does not constitute any financial, investment, or legal advice. Gate does not guarantee the accuracy or completeness of the information and shall not be liable for any losses arising from the use of this information. Virtual asset investments carry high risks and are subject to significant price volatility. You may lose all of your invested principal. Please fully understand the relevant risks and make prudent decisions based on your own financial situation and risk tolerance. For details, please refer to
Disclaimer.
Related Articles
BTC broke through $74,000 this week, with short-term holders' profits surging to $18.4 million per hour.
Gate News reported that on March 17, according to Glassnode data, Bitcoin price made a modest breakthrough above $74,000 this week, with short-term holder realized profit (STH-Realized Profit, 12-hour simple moving average) surging to $18.4 million per hour. This is consistent with the pattern observed in February: short-term holders continuously drain momentum from each bounce at the $70,000 level, absorbing upward momentum before any real breakout can form.
GateNews5m ago
Gold Shop Gold Purchase Loss 8%! Real Test "On-Chain Gold" Token PAXG Total Fees Crush Taiwan Bank Passbook
There are three ways for Taiwanese people to buy gold: Taiwan Bank Gold Passbook, gold shops, and on-chain gold token PAXG. Surveys show that despite PAXG appearing complex, its fees are actually the lowest, at approximately 1.2-3.2%. Gold shop transaction spreads reach as high as 8%, while Taiwan Bank is 2.3%. PAXG offers 24-hour liquidity, but the threshold for redeeming physical gold is high. Your choice should consider security, fees, and liquidity needs.
動區BlockTempo11m ago
ETH Price Chart Sees Bullish Pattern on Repeat, Is $30,000 ETH ATH a Possibility?
Pioneer altcoin ETH price chart sees bullish pattern on repeat.
Another expert expects $30,000 ATH target for ETH.
How high can the price of ETH go this year?
The crypto market grows steadily bullish once again as the price of Bitcoin (BTC) reclaims prices above the $74,00 price range an
CryptoNewsLand25m ago
Crypto Analyst Points out a Bullish Possibility for XRP Price
Crypto analyst Ali Charts predicts XRP could rise to $1.85, following a recent 3.25% increase. Despite cautious community sentiment, the token's price may surge in the coming months, although a correction to $1.49 is also anticipated.
TheNewsCrypto40m ago
Crypto Fear & Greed Index Rises to 28, Exits Extreme Fear Zone
Gate News bot message, the Crypto Fear & Greed Index climbed to 28 today, up from 23 yesterday and 13 last week, transitioning from Extreme Fear into Fear territory. Market sentiment demonstrates early signs of recovery, while participants maintain a cautious stance with limited risk appetite.
GateNews51m ago
