
Date: Wed, Dec 31, 2025 | 09:30 AM GMT
As the final day of 2025 arrives, the broader cryptocurrency market is showing modest strength, with both Bitcoin (BTC) and Ethereum (ETH) trading slightly in the green. This steady performance among major assets has helped stabilize overall market sentiment, creating room for select altcoins — including Chiliz (CHZ) — to develop constructive technical setups.
CHZ is standing out with an impressive 18% daily gain. More importantly, price action has confirmed a technically significant breakout, strengthening the case for further upside in the near term.
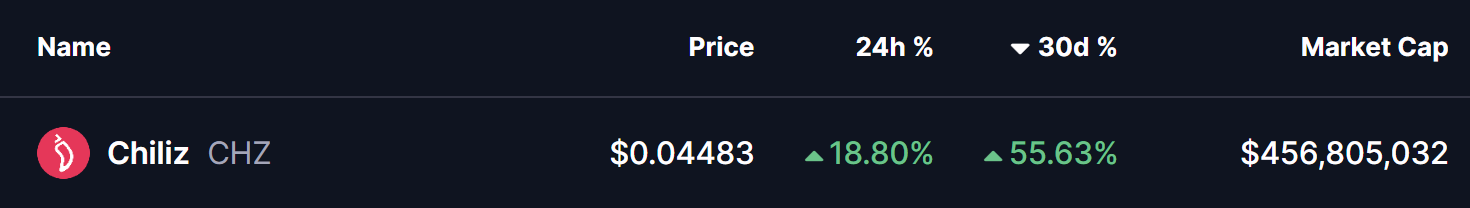
Source: Coinmarketcap
Descending Channel Breakout
On the daily chart, Chiliz had been trapped inside a well-defined descending channel since its early December peak near the $0.051 region. This structure was marked by a series of lower highs and lower lows, reflecting persistent bearish pressure that gradually pushed CHZ down toward the $0.028 support area.
That bearish phase now appears to be ending. After reclaiming the 200-day moving average, CHZ decisively broke above the upper boundary of the descending channel near the $0.04451 level. This breakout signals a meaningful shift in market control, with buyers stepping back in after weeks of compression.
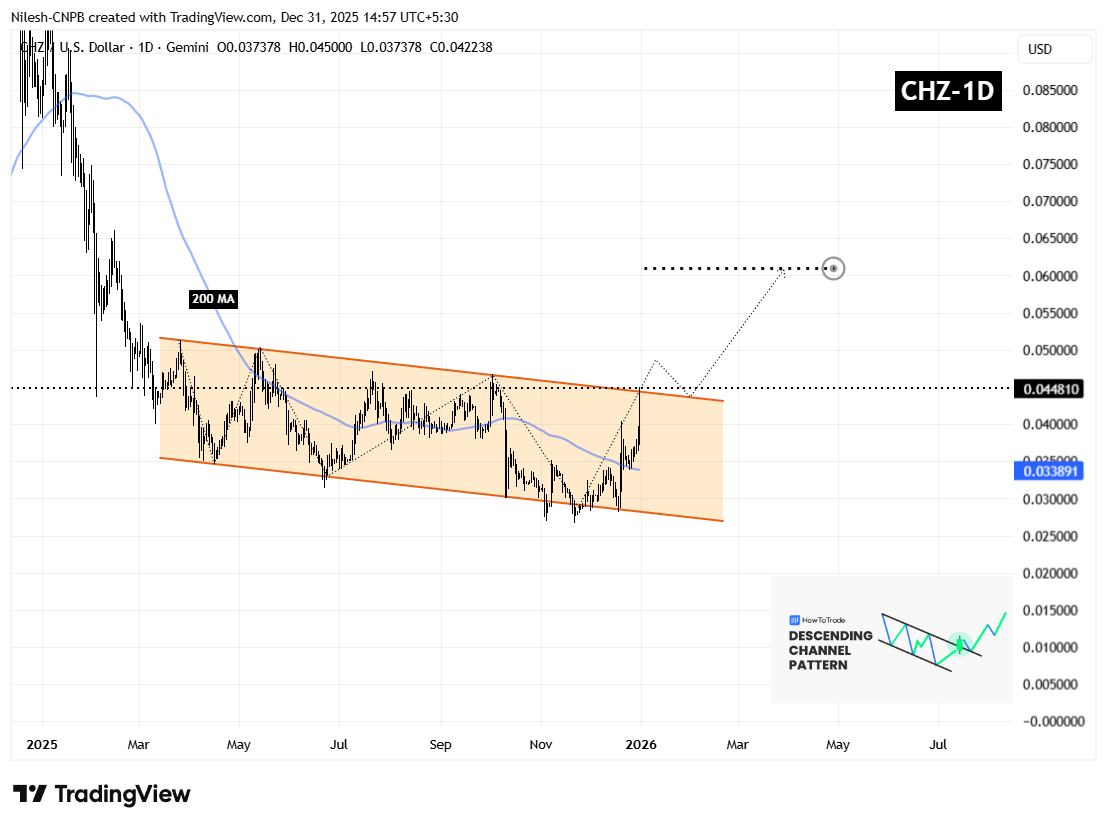
Chiliz (CHZ) Daily Chart/Coinsprobe (Source: Tradingview)
What’s Next for CHZ?
Following a breakout of this nature, short-term volatility is normal. A brief pullback toward the former resistance zone is often considered healthy. For CHZ, the $0.04451 area now stands as a critical support level. A successful retest of this zone, followed by renewed buying interest, would further validate the breakout and strengthen the bullish structure.
If buyers continue to defend reclaimed levels, the chart’s measured move points toward a potential upside target near the $0.06101 region. This would represent roughly a 35% advance from the breakout zone and aligns closely with the projected extension visible on the chart.
On the downside, a failure to hold above the breakout level could slow momentum and lead to consolidation. A sustained move back inside the descending channel would weaken the bullish outlook and delay any upside continuation. However, as long as CHZ remains above reclaimed resistance and the 200-day moving average, the broader technical structure favors higher prices in the sessions ahead.
For now, the breakout remains in its early stages, but CHZ appears well-positioned to extend its recovery move if overall market conditions remain supportive.
Disclaimer: The views and analysis presented in this article are for informational purposes only and reflect the author’s perspective, not financial advice. Technical patterns and indicators discussed are subject to market volatility and may or may not yield the anticipated results. Investors are advised to exercise caution, conduct independent research, and make decisions aligned with their individual risk tolerance.
About Author: Nilesh Hembade is the Founder and Lead Author of Coinsprobe, with over 5 years of experience in the cryptocurrency and blockchain industry. Since launching Coinsprobe in 2023, he has been providing daily, research-driven insights through in-depth market analysis, on-chain data, and technical research.

Disclaimer: The information on this page may come from third parties and does not represent the views or opinions of Gate. The content displayed on this page is for reference only and does not constitute any financial, investment, or legal advice. Gate does not guarantee the accuracy or completeness of the information and shall not be liable for any losses arising from the use of this information. Virtual asset investments carry high risks and are subject to significant price volatility. You may lose all of your invested principal. Please fully understand the relevant risks and make prudent decisions based on your own financial situation and risk tolerance. For details, please refer to
Disclaimer.
Related Articles
BTC rises 0.52% in 15 minutes: Major capital net inflows to exchanges and multiple market resonance driving the move
2026-03-20 21:15 to 21:30 (UTC), BTC recorded +0.52% return in 15 minutes, with a price range of 70124.0 to 70586.6 USDT, and amplitude of 0.66%. This round of volatility occurred against a backdrop of increased market attention and heightened fluctuations, with both on-chain and market participants showing highly active behavior.
The main driver of this volatility was whale funds (entities holding >=1,000 BTC) making a net inflow of 4,091.39 BTC to exchanges within 24 hours, data significantly exceeding the average for the same period. Concentrated net inflows
GateNews31m ago
Bitcoin Has Stabilized, But Investors Are Paying Up for Downside Protection: VanEck
Bitcoin's volatility has decreased to around $70,000, but traders are still heavily investing in downside protection. Although premiums for puts have dropped, they remain high historically, suggesting caution among investors. This defensiveness may signal an impending price bottom, as similar market conditions in the past have led to recoveries.
Decrypt1h ago
Cardano Flashes Weekly Buy Signal As ADA Holds Key $0.23 Support
Cardano is trying to shake off a bruising stretch of price weakness, and a fresh technical signal is giving traders a reason to pay attention again. Crypto analyst Ali Martinez said ADA has printed a TD Sequential buy signal on the weekly chart, showing a “black 9” that often appears when a
BlockChainReporter2h ago
Ethereum Approaches Cycle Low as Bitmain Indicates Violent Belief
The article explores Ethereum's potential market bottom, highlighting its correlation with past S&P 500 trends and significant institutional investment by Bitmain. Despite mixed market sentiment, historical patterns suggest possible recovery.
CryptoBreaking4h ago
Analyst: If Bitcoin falls below the $66,000 support level, it may trigger a 10%-20% correction
Gate News reported that on March 20, Chartered Market Technician (CMT) Aksel Kibar stated on March 21 that the lower support boundary of Bitcoin's potential rising wedge formation is located at 66,000, and a breakdown below this level could trigger a bearish reversal. Aksel Kibar pointed out that rising wedges, as a classic technical pattern, typically appear at the end of uptrends, signaling price momentum exhaustion. Historical data shows that after similar downside breakdowns are confirmed, the average pullback ranges from 10%-20%.
GateNews6h ago
