SEI trades above its 21-day MA as network activity tops one million users, signaling rising liquidity and a potential move toward $0.24–$0.26.
SEI is drawing renewed attention as price action shifts above a key short-term average.
Market analysts are tracking this move closely as ecosystem activity has continued to rise.
Network usage data, trading behavior, and liquidity positioning now shape expectations for SEI in the near term.
SEI Price Break Above 21-Day Average Signals Trend Change
SEI moved above the 21-day moving average during recent sessions, marking a technical shift. This level had capped price action during prior attempts.
As a result, short-term momentum indicators turned positive. Traders often treat this average as a trend filter.
$SEI broke through the 21-Day MA and is starting a new uptrend.
I can’t deny the fact that they have been constantly growing their ecoysystem.
Most active EVM chain in December with more than 1M active accounts.
This would mean that, given the amount of liquidity that’s ready… pic.twitter.com/hHPizqtlDR
— Michaël van de Poppe (@CryptoMichNL) January 3, 2026
The move occurred alongside steady volume, which added confirmation. Price stability above this level remains the main condition.
If price holds, market structure may gradually improve. However, failure to hold could return SEI to prior ranges.
This price behavior aligns with broader market rotation into active networks. Many traders monitor moving averages for trend validation.
Therefore, sustained closes above the 21-day average remain critical. This level now acts as immediate support.
Liquidity positioning also adds context to the move. Short positions built during consolidation may face pressure.
As price rises, forced exits can add momentum. This dynamic explains growing focus on higher resistance zones.
Network Activity Places SEI Among Leading EVM Chains
SEI recorded more than one million active accounts during December. This placed it among the most active EVM-compatible networks.
User growth has been steady rather than abrupt. Consistent onboarding supported sustained transaction demand.
Sei closed out December as a leading EVM chain by active addresses, capping a year of sustained growth.
EVM activity shows a growing trend: as markets increasingly move onchain, usage is concentrating around execution performance.
Markets Move Faster on Sei. pic.twitter.com/4KfB4ljAJ2
— Sei (@SeiNetwork) January 2, 2026
The network also benefits from high throughput design. SEI can process large transaction volumes with low latency.
This structure supports trading, gaming, and payment applications. Developers continue deploying applications that rely on speed.
Ecosystem growth supports the technical narrative. Active users often correlate with network demand.
Therefore, on-chain activity strengthens the case for sustained interest. Market participants increasingly monitor usage metrics.
SEI also gained attention from infrastructure updates. Fee adjustments improved cost efficiency for users.
This encouraged higher frequency interactions. As a result, daily activity remained elevated across applications.
Related Reading: Xiaomi Adds Built-In Crypto Wallets to New Smartphones Worldwide
Liquidity Conditions Point Toward Higher Target Zones
Liquidity data suggests notable short exposure remains in the market. As price moves higher, these positions face pressure.
Short covering often adds upward force during breakouts. This condition supports focus on higher price zones.
Analysts have pointed to the $0.24 to $0.26 range as a potential area. This zone aligns with prior consolidation levels.
Reaching it depends on sustained trend structure. Price must continue respecting higher support levels.
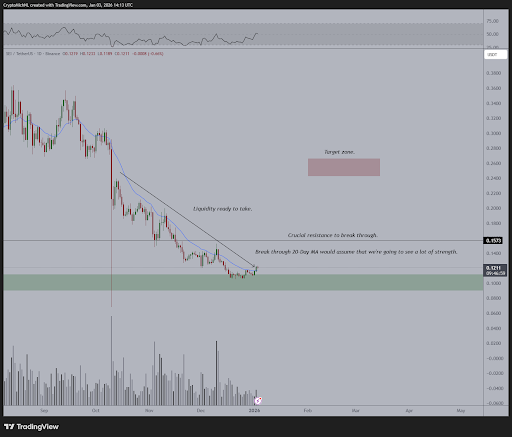
SEI/TetherUS Daily Chart | Source: CryptoMichNL/X
The broader market environment also plays a role. Bitcoin stability often supports altcoin rotation.
When risk appetite improves, active networks benefit. SEI fits this profile due to usage growth.
However, the trend remains conditional rather than confirmed. SEI still trades below longer-term averages.
Therefore, market structure requires further improvement. Sustained strength above the 21-day average remains the key reference.
As trading continues, attention stays on volume and support reactions. These factors guide short-term positioning.
For now, SEI remains closely watched. The focus stays on whether the emerging trend can hold.
Disclaimer: The information on this page may come from third parties and does not represent the views or opinions of Gate. The content displayed on this page is for reference only and does not constitute any financial, investment, or legal advice. Gate does not guarantee the accuracy or completeness of the information and shall not be liable for any losses arising from the use of this information. Virtual asset investments carry high risks and are subject to significant price volatility. You may lose all of your invested principal. Please fully understand the relevant risks and make prudent decisions based on your own financial situation and risk tolerance. For details, please refer to
Disclaimer.