
**Date: **Mon, Jan 05, 2026 | 05:26 AM GMT
As 2026 kicks off, the broader cryptocurrency market is showing renewed stability. Ethereum (ETH) is up nearly 4% on the week, and momentum is gradually spreading across major altcoins — including the decentralized exchange token Aster (ASTER).
While ASTER is also posting over 4% weekly gains, the more important story is unfolding beneath the surface. Recent price action suggests a meaningful structural shift may be developing — one that could mark the early stages of a bullish continuation if key technical levels are reclaimed.
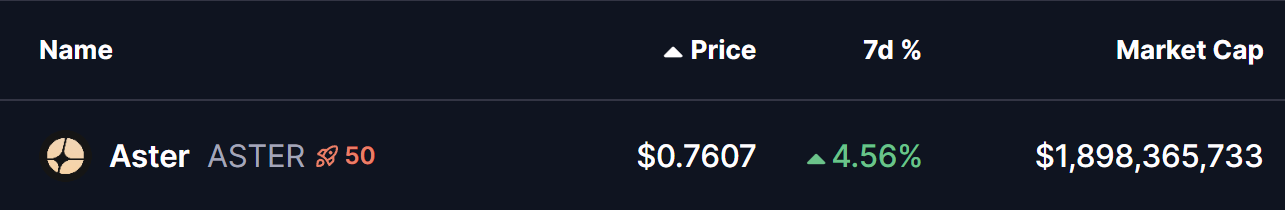
Source: Coinmarketcap
Rounding Bottom in Play
On the daily timeframe, **Aster **appears to be forming a rounding bottom pattern, a classic bullish reversal structure that typically develops after a prolonged corrective phase. This pattern reflects a gradual transition from aggressive selling to steady accumulation, as downside momentum fades and buyers slowly regain confidence.
The setup began after ASTER faced strong rejection near the $1.35–$1.40 neckline resistance zone, triggering a sharp decline through late November and December. That downside move eventually found strong demand near the $0.6546 support level, which has since acted as a critical base. Multiple defenses of this zone prevented further downside and helped establish a stable foundation for a potential trend reversal.
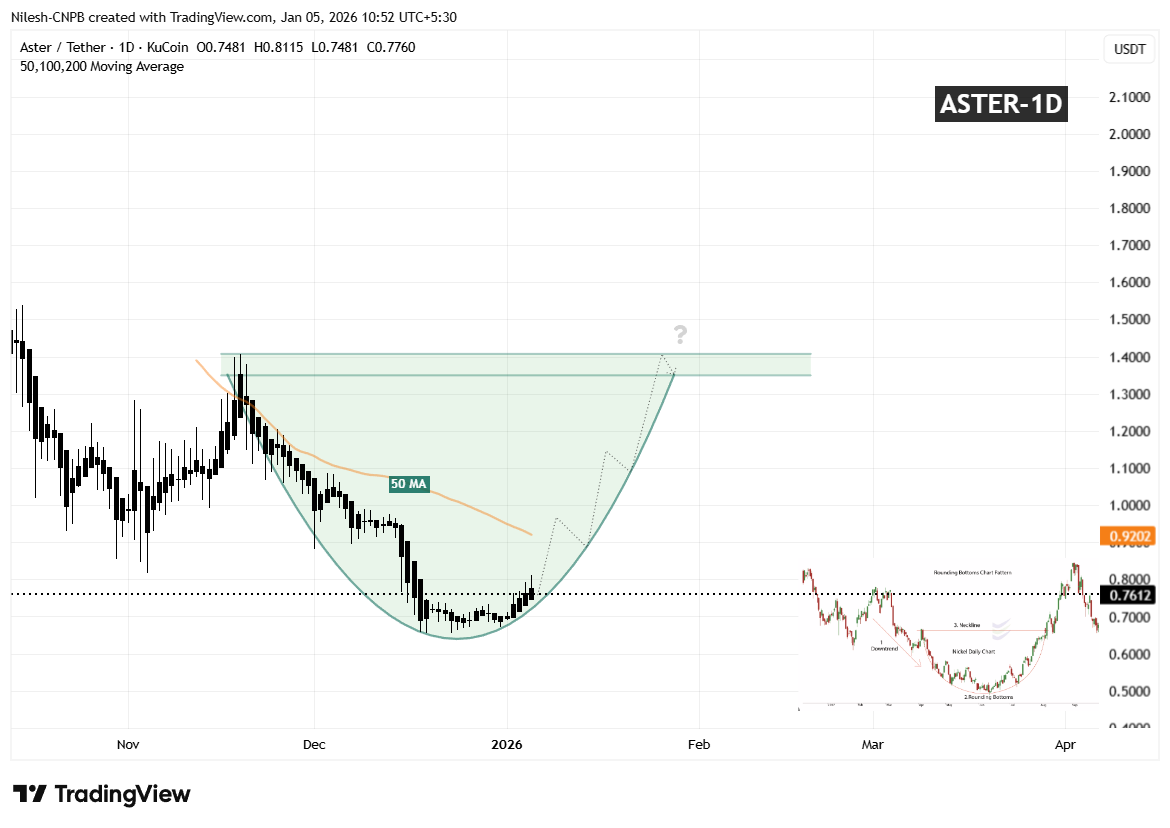
Aster (ASTER) Daily Chart/Coinsprobe (Source: Tradingview)
Since carving out that bottom, ASTER has started to curve higher in a smooth, rounded fashion — closely matching the textbook structure of a developing rounding bottom. The recent stabilization above the $0.76 region further supports the view that selling pressure is weakening and accumulation may be underway.
A key technical level now comes into focus: the 50-day moving average, currently hovering near $0.9202. This moving average has acted as dynamic resistance throughout the recovery phase, repeatedly capping upside attempts.
What’s Next for ASTER?
For the rounding bottom structure to gain confirmation, ASTER needs to reclaim the $0.9202 region and establish acceptance above the 50-day moving average. A sustained move above this zone would signal that buyers are regaining control after months of corrective price action.
Beyond that, the most significant technical barrier remains the $1.35–$1.40 neckline resistance. A clean and decisive breakout above this area would validate the entire reversal pattern and could open the door for a broader bullish expansion phase, with momentum traders and sidelined participants likely re-entering the market.
Until those levels are reclaimed, the pattern remains in development. Short-term consolidation or minor pullbacks remain possible if ASTER struggles near the 50-day MA. However, as long as price continues to form higher lows and holds above the established rounding base, the broader bottoming structure remains intact and constructive.
Disclaimer: The views and analysis presented in this article are for informational purposes only and reflect the author’s perspective, not financial advice. Technical patterns and indicators discussed are subject to market volatility and may or may not yield the anticipated results. Investors are advised to exercise caution, conduct independent research, and make decisions aligned with their individual risk tolerance.
About Author: Nilesh Hembade is the Founder and Lead Author of Coinsprobe, with over 5 years of experience in the cryptocurrency and blockchain industry. Since launching Coinsprobe in 2023, he has been providing daily, research-driven insights through in-depth market analysis, on-chain data, and technical research.
Disclaimer: The information on this page may come from third parties and does not represent the views or opinions of Gate. The content displayed on this page is for reference only and does not constitute any financial, investment, or legal advice. Gate does not guarantee the accuracy or completeness of the information and shall not be liable for any losses arising from the use of this information. Virtual asset investments carry high risks and are subject to significant price volatility. You may lose all of your invested principal. Please fully understand the relevant risks and make prudent decisions based on your own financial situation and risk tolerance. For details, please refer to
Disclaimer.
Related Articles
Analyst Says XRP Is ‘Criminally Undervalued’ as RSI Drops
Analyst says XRP RSI reached oversold levels last seen during the 2022 bear market bottom.
XRP trades near $1.39 with key support at $1.30–$1.35 and resistance between $1.45 and $1.70.
Price has declined from about $3.10 since Sept 2025, forming a prolonged downward trend.
XRP trades near
CryptoFrontNews32m ago
Shiba Inu Death Cross Appears on Daily Chart as Price Loses Support - U.Today
Shiba Inu (SHIB) is battling bearish pressure that threatens to undo its over 8.85% weekly gains. In the last 24 hours, the meme coin’s price and volume flipped negative as it recorded a death cross on its charts.
Death cross signals weakening momentum for Shiba Inu
For context, a death cross eme
UToday1h ago
加密货币恐慌指数升至16,市场仍处「极度恐慌」状态
Gate News 消息,3 月 14 日,据 Alternative 数据,今日加密货币恐慌与贪婪指数小幅升至 16,上月均值为 5,市场仍处于「极度恐慌」状态。恐慌指数阈值为 0-100,其计算包含以下指标:波动性(25%)、市场交易量(25%)、社交媒体热度(15%)、市场调查(15%)、比特币在整个市场中的比例(10%)及谷歌热词分析(10%)。
GateNews2h ago
Japan XRP Payment Rumors Ignite Massive Market Speculation
Japan's crypto landscape is buzzing with potential XRP adoption for payments, fueled by partnerships and regulatory developments, though no official mandate is in place yet. Speculative claims highlight a promising future for XRP amid ongoing fintech experiments.
Coinfomania2h ago
XRP Network is On Fire: Why Daily Transactions Just Tripled to a Massive 3 Million
If you’ve been waiting for "utility" to finally show up in the crypto charts, March 2026 just delivered. The XRP Ledger (XRPL) has officially hit a massive milestone, with daily transactions tripling to reach 3 million.
This isn't just a small bump; it’s a full-blown explosion in network usage.
Cryptoknowmics3h ago
Hyperliquid HYPE Price Climbs Toward $38 as Market Activity Rebounds
Key Insights
Hyperliquid HYPE rebounded from the $20 support zone and now trades near $37 as improving market activity strengthens the developing recovery trend.
Technical structure shows higher lows since January while resistance near $38 and $40 now determines whether bullish momentum
CryptoFrontNews3h ago