Pi Network is fluctuating around the $0.2000 USD mark at the time of writing on Thursday, after recording a nearly 2% decline in the previous trading session. Notably, in the past 24 hours, centralized exchanges (CEX) have received approximately 1.90 million PI tokens, a signal indicating cautious sentiment and risk-avoidance trends spreading among holders. Technically, PI has not yet broken out of the downward pressure zone, as the trend continues to lean bearish and the price faces the risk of breaking through the 20-day exponential moving average (EMA).
Large deposits increase selling pressure
Data from PiScan shows that over 1.90 million PI tokens have been transferred to centralized exchanges (CEX) listing PI, significantly increasing supply pressure in the market. Under normal circumstances, large token deposits to CEX are often seen as signals of upcoming selling activity, reflecting cautious sentiment and declining investor confidence. If the cash flow trend continues to flow steadily into exchanges, selling pressure on PI is likely to escalate in the near future.
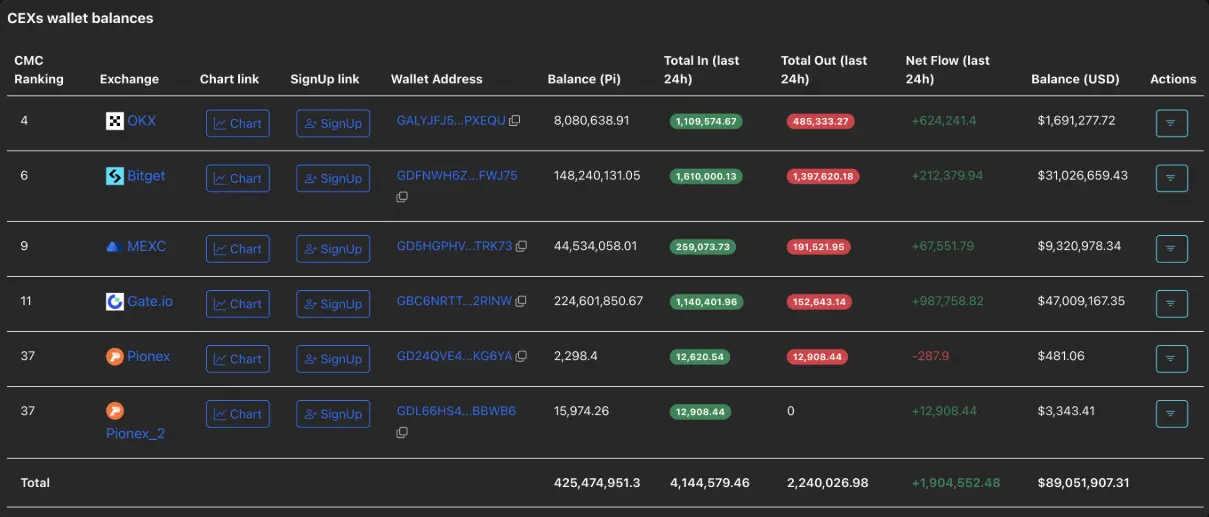 PI wallet balance on CEX | Source: PiScan## Technical outlook: Can Pi Network continue to decline below $0.20?
Pi Network is currently testing the 20-day EMA at $0.2092 USD, after reversing from the 50-day EMA around $0.2166 USD. This movement indicates increasing selling pressure as the price approaches higher EMA lines, implying new supply has emerged and is restraining the recovery.
The RSI indicator has retreated to 48 and crossed below the neutral threshold, reflecting that bears are gaining dominance, and opening room for deeper correction before entering oversold territory.
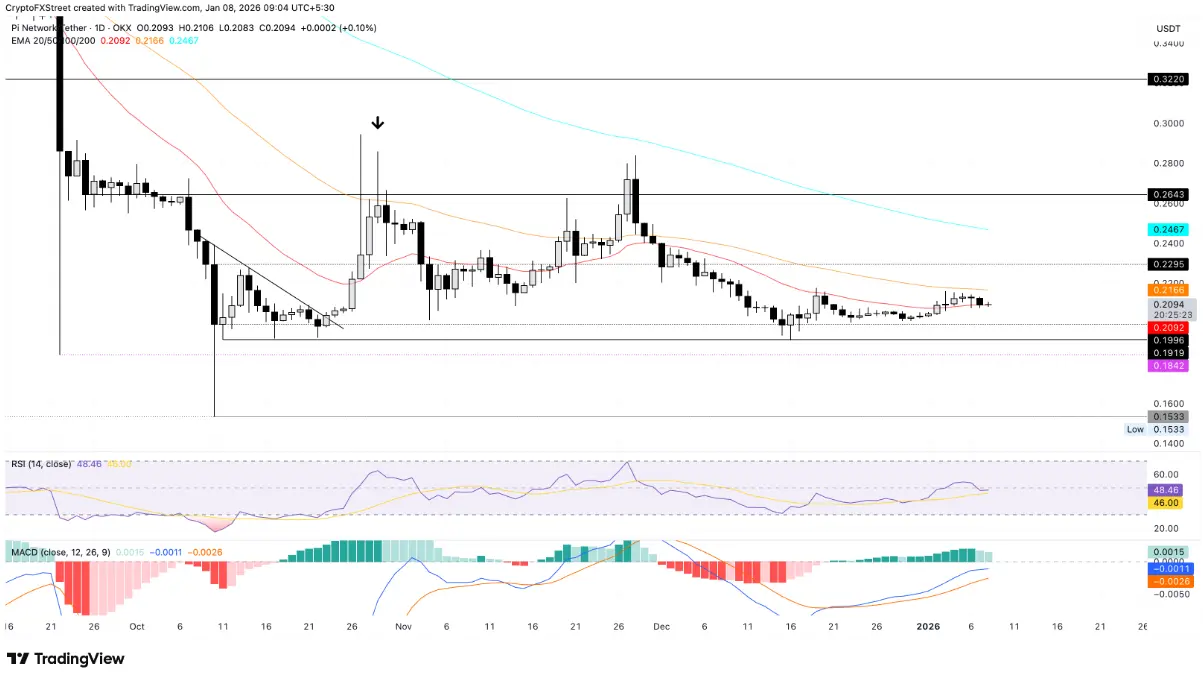 Daily PI/USDT chart | Source: TradingView Additionally, the MACD shows signs of stalling as green histogram bars gradually shrink, indicating weakening bullish momentum. If the MACD crosses below the signal line, a bearish scenario will be reinforced.
If selling pressure continues to dominate, the support levels at the lows of 10/11 at $0.1996 USD and 9/22 at $0.1842 USD are likely to become important support points to watch.
Conversely, if PI successfully breaks above the 50-day EMA at $0.2166 USD, the upward trend could resume, targeting $0.2295 USD — the price zone most recently tested on 12/5.
SN_Nour
Disclaimer: The information on this page may come from third parties and does not represent the views or opinions of Gate. The content displayed on this page is for reference only and does not constitute any financial, investment, or legal advice. Gate does not guarantee the accuracy or completeness of the information and shall not be liable for any losses arising from the use of this information. Virtual asset investments carry high risks and are subject to significant price volatility. You may lose all of your invested principal. Please fully understand the relevant risks and make prudent decisions based on your own financial situation and risk tolerance. For details, please refer to
Disclaimer.
Related Articles
Coixa Wallet Applies for Pi Network KYB Certification, Accelerating Ecosystem Utility Transformation
Pi Network ecosystem welcomes major development, with DeFi gateway Coixa applying for KYB certification to standardize operations and enhance network trust. Once approved, it will drive the Pi ecosystem's transformation into practical applications while meeting the latest project requirements, promising to provide users with more services.
GateNews13h ago
Pi Coin Price Brewing 22% Breakthrough: Key Indicator "Goes Silent," $0.20 USD Becomes Bulls-Bears Dividing Line
Pi Network (PI) price is hovering around $0.188, with a slight decline intraday but an 11.6% increase this month. Technical analysis indicates the market is approaching a potential reversal point, showing bullish signals and a cup-and-handle pattern. However, short-term momentum depends on the PISI indicator, which is currently near neutral, suggesting that PI has not yet formed a strong upward trend. The key resistance level is at $0.200; a break above this could lead to further gains toward $0.246. The market still needs to wait for changes in capital flow to trigger a breakout.
GateNews14h ago
Pi Network Bullish Pattern Formation, PISI Indicator Shows 22% Breakout Yet to Come
On March 24, Pi Network (PI) was trading near $0.188, with an overall gain of 11.6%. Hidden bullish divergence and a cup and handle pattern indicate potential for a 22% rally if it breaks through the $0.204 neckline. However, the PISI indicator is near zero, suggesting a lack of independent momentum. The CMF indicator has turned positive, hinting that large capital may be re-establishing positions. The key support level is $0.182, and if it breaks below $0.168, the cup and handle pattern will be invalidated.
MarketWhisper14h ago
