
**Date: **Wed, Jan 07, 2026 | 06:20 AM GMT
The broader cryptocurrency market continues to show strong New Year momentum, with Bitcoin (BTC) up around 4% and Ethereum (ETH) gaining over 9% on a weekly basis. This improving sentiment is gradually spilling over into major altcoins — including the DePIN-focused token Akash Network (AKT).
AKT has already posted an impressive 20% weekly gain. While this short-term strength has caught traders’ attention, the more important development is unfolding on the higher-timeframe chart. Recent price action suggests a meaningful shift in market structure, hinting that AKT may be transitioning out of a prolonged corrective phase and into the early stages of a bullish continuation.

Source: Coinmarketcap
Falling Wedge and Rounding Bottom in Play
On the daily chart, AKT has been trading within a broader falling wedge — a structure that often precedes bullish reversals as selling pressure gradually weakens. Within this larger wedge, price action is also shaping a developing rounding bottom pattern, reflecting steady accumulation and seller exhaustion.
The formation began after AKT faced strong rejection near the $0.5441 resistance zone in late November. That rejection triggered a sharp sell-off, pushing price lower toward the $0.3465 region. However, bears failed to extend losses beyond this area. Instead, demand stepped in, downside momentum slowed, and price began to stabilize.
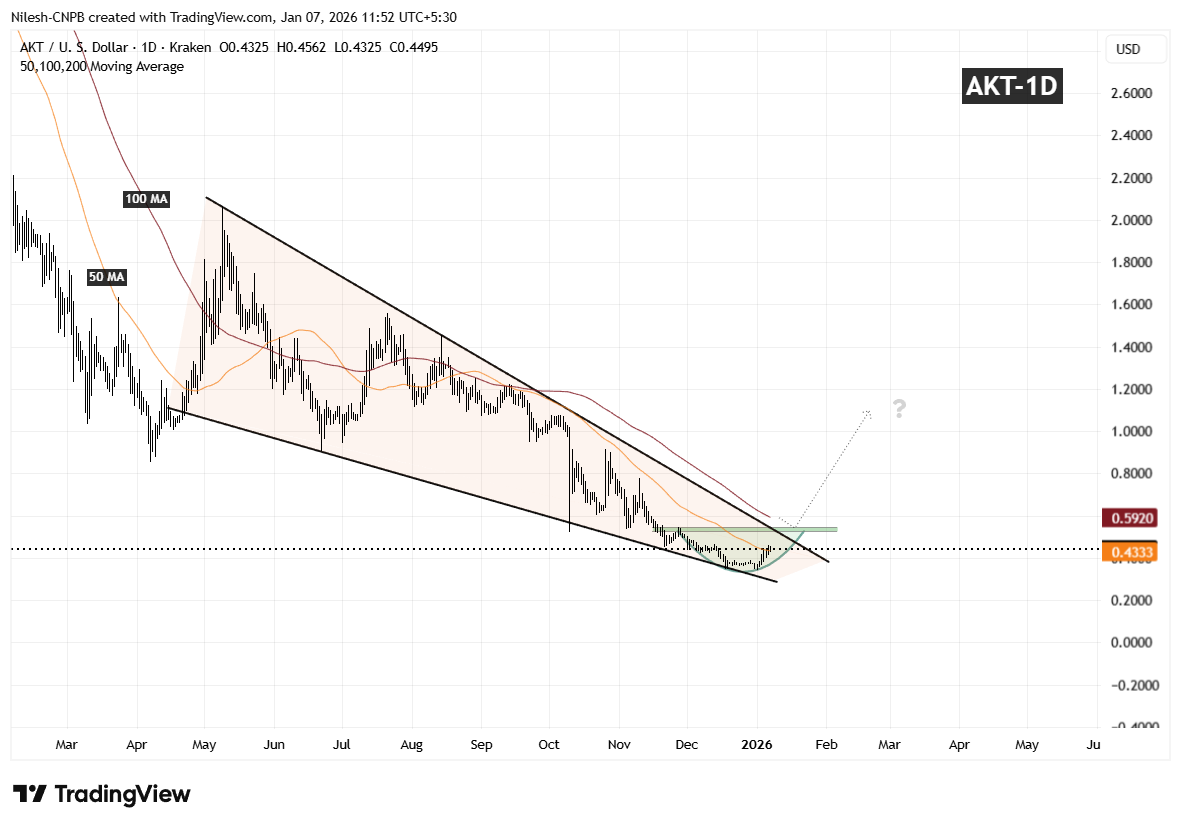
Akash Network (AKT) Daily Chart/Coinsprobe (Source: Tradingview)
Over the following weeks, volatility compressed and AKT started to curl higher in a smooth, rounded fashion — closely matching the textbook behavior of a rounding bottom. Importantly, the recent rebound has pushed price back above the 50-day moving average around $0.4333, a level that had previously acted as resistance and is now beginning to flip into support.
What’s Next for AKT?
If AKT can continue to hold above the 50-day moving average, this area may act as a solid base for further upside attempts. From here, attention shifts toward the descending resistance trendline of the falling wedge, which aligns closely with the $0.5441 resistance zone.
A clean and decisive breakout above this confluence area, followed by sustained acceptance, would confirm a broader bullish expansion phase and mark a clear trend reversal from the prior downtrend. Such a move would likely attract renewed momentum participation as the market recognizes the structural shift.
Until that breakout occurs, the pattern remains in development. Short-term consolidation or shallow pullbacks are still possible as price digests recent gains. However, as long as AKT continues to print higher lows above the established base, the broader technical structure remains constructive.
Overall, the chart suggests AKT is approaching a critical inflection point — one that could determine whether this recovery evolves into a sustained bullish trend as 2026 progresses.
Disclaimer: The views and analysis presented in this article are for informational purposes only and reflect the author’s perspective, not financial advice. Technical patterns and indicators discussed are subject to market volatility and may or may not yield the anticipated results. Investors are advised to exercise caution, conduct independent research, and make decisions aligned with their individual risk tolerance.
About Author: Nilesh Hembade is the Founder and Lead Author of Coinsprobe, with over 5 years of experience in the cryptocurrency and blockchain industry. Since launching Coinsprobe in 2023, he has been providing daily, research-driven insights through in-depth market analysis, on-chain data, and technical research.
Disclaimer: The information on this page may come from third parties and does not represent the views or opinions of Gate. The content displayed on this page is for reference only and does not constitute any financial, investment, or legal advice. Gate does not guarantee the accuracy or completeness of the information and shall not be liable for any losses arising from the use of this information. Virtual asset investments carry high risks and are subject to significant price volatility. You may lose all of your invested principal. Please fully understand the relevant risks and make prudent decisions based on your own financial situation and risk tolerance. For details, please refer to
Disclaimer.
Related Articles
VIA on Fire: 31.12% Surge Sparks Trader Excitement
VIA's price surged by 31.12% to $0.003697, following a 67.21% rise in 24 hours and increased trading volume. This movement reflects heightened trader interest amid broader market trends, with key support at $0.003 and resistance at $0.006.
Coinfomania25m ago
鏈上熱到爆、以太幣卻漲不動?專家揭「致命死穴」:恐下探 1,500 美元
CryptoQuant 報告指出,以太坊面臨「採用悖論」,雖然網路活躍度創新高,但幣價卻下滑。若熊市持續,到第三季末以太幣可能跌至 1,500 美元。智能合約活躍度上升與以太幣價格脫鉤,交易所流入量更能反映價格動態。投資需求疲軟,資金持續流失是主要隱憂。
区块客58m ago
Dogecoin (DOGE) phát tín hiệu khởi sắc khi dòng tiền nhà đầu tư cá nhân quay lại
Dogecoin (DOGE) is experiencing a recovery, currently up over 2% and nearing the psychological $0.1000 mark. Increased speculative activity is attracting traders to the derivatives market, and technical indicators suggest a cautious positive outlook for DOGE.
TapChiBitcoin1h ago
DePIN and AI Lead the Charge – Analyzing the Top Weekly Crypto Gainers
The cryptocurrency market serves as an indicator for new technological trends, and weekly data for the cryptocurrency market collected by CoinMarketCap show that investor sentiment has recently changed a lot. The market remains directionless overall, yet an exclusive set of projects, particularly in
BlockChainReporter1h ago
Liệu RAVE có sẵn sàng tăng 30% sau khi lấy lại được mức hỗ trợ này?
RaveDAO (RAVE) hiện đang giao dịch ở mức $0,2475 sau khi ghi nhận mức tăng ấn tượng 16,45%. Đáng chú ý, sự gia tăng mạnh mẽ trong hoạt động thị trường đã được ghi nhận, với khối lượng giao dịch tăng vọt 125%, đạt $88,15 triệu. Điều này phản ánh sự quan tâm lớn từ các nhà đầu tư và nhà giao dịch đối
TapChiBitcoin2h ago
+112 Billion Shiba Inu (SHIB) in 24 Hours Returns Notorious 80 Trillion Threshold - U.Today
Shiba Inu finally recovering
Shiba Inu are ready to sell
More than 112 billion SHIB tokens were transferred to exchanges in the past day, bringing total exchange reserves back above the 80 trillion SHIB threshold, indicating a discernible change in Shiba Inu's on-chain dynamics.
Shiba Inu final
UToday2h ago